 Open Access Article
Creative Commons Attribution 3.0 Unported Licence
Depth-dependent oxygen redox activity in lithium-rich layered oxide cathodes†
Andrew J.
Naylor‡
 *a,
Eszter
Makkos
b,
Julia
Maibach
 c,
Niccolò
Guerrini
a,
Adam
Sobkowiak
a,
Erik
Björklund
c,
Juan G.
Lozano
a,
Ashok S.
Menon
c,
Reza
Younesi
c,
Niccolò
Guerrini
a,
Adam
Sobkowiak
a,
Erik
Björklund
c,
Juan G.
Lozano
a,
Ashok S.
Menon
c,
Reza
Younesi
 c,
Matthew R.
Roberts
a,
Kristina
Edström
c,
M. Saiful
Islam
c,
Matthew R.
Roberts
a,
Kristina
Edström
c,
M. Saiful
Islam
 b and
Peter G.
Bruce
 *ade
*ade
aDepartment of Materials, University of Oxford, Parks Road, Oxford OX1 3PH, UK. E-mail: andy.naylor@kemi.uu.se; peter.bruce@materials.ox.ac.uk
bDepartment of Chemistry, University of Bath, Bath, BA2 7AY, UK
cDepartment of Chemistry – Ångström Laboratory, Uppsala University, Box 538, SE-75121 Uppsala, Sweden
dThe Henry Royce Institute, Parks Road, Oxford, OX1 3PH, UK
eThe Faraday Institution, Quad One, Becquerel Avenue, Harwell Campus, Didcot, OX11 0RA, UK
First published on 27th September 2019
Abstract
Lithium-rich materials, such as Li1.2Ni0.2Mn0.6O2, exhibit capacities not limited by transition metal redox, through the reversible oxidation of oxide anions. Here we offer detailed insight into the degree of oxygen redox as a function of depth within the material as it is charged and cycled. Energy-tuned photoelectron spectroscopy is used as a powerful, yet highly sensitive technique to probe electronic states of oxygen and transition metals from the top few nanometers at the near-surface through to the bulk of the particles. Two discrete oxygen species are identified, On− and O2−, where n < 2, confirming our previous model that oxidation generates localised hole states on O upon charging. This is in contrast to the oxygen redox inactive high voltage spinel LiNi0.5Mn1.5O4, for which no On− species is detected. The depth profile results demonstrate a concentration gradient exists for On− from the surface through to the bulk, indicating a preferential surface oxidation of the layered oxide particles. This is highly consistent with the already well-established core–shell model for such materials. Ab initio calculations reaffirm the electronic structure differences observed experimentally between the surface and bulk, while modelling of delithiated structures shows good agreement between experimental and calculated binding energies for On−.
Introduction
The lithium ion battery utilising a LiCoO2 cathode, with a capacity of 160–190 mA h g−1, was the first commercially successful chemistry released to the marketplace. LiCoO2 has a layered structure in which lithium cations lie between anionic sheets containing cobalt and oxygen. Over the subsequent years of research this general structure has proved extremely versatile, with routine substitution of the Co for other transition metals to form new materials that are analogous to LiCoO2. Today, the energy density of Li-ion batteries is limited by the cathode. The state-of-the-art NMC (LiNi1−x−yCoxMnyO2) and NCA (LiNi1−x−yCoxAlyO2) materials approach 200 mA h g−1. However, they are limited by storing electrons only on the transition metals (TM-redox). In recent years it has been shown that so called “Li-rich” cathode materials, e.g. Li1.2Ni0.2Mn0.6O2 and Li1.2Ni0.134Co0.134Mn0.54O2, can exceed the limit of TM-redox by invoking O-redox, where electrons are stored on oxygen as well as the transition metal ions.1–6 Capacities exceeding 250 mA h g−1 are possible, making these materials candidates for future Li-ion batteries. This process of O-redox has been extensively characterised using X-ray absorption near edge structure (XANES), soft X-ray absorption spectroscopy (SXAS), online electrochemical mass spectrometry (OEMS), X-ray photoelectron spectroscopy (XPS), resonant inelastic X-ray scattering (RIXS) and several models exist for the nature of the oxygen redox process.7–10 Typically, whilst the oxygen oxidation and reduction processes are reversible, a significant oxygen loss component is seen. It is known that the surface/near surface of Li transition metal oxide cathodes, not only Li-rich, are often composed of rocksalt/spinel-like structures even in the pristine materials.11–17 For instance, Koga et al.9 demonstrate a mixture of two phases formed on charging of Li1.20Mn0.54Co0.13Ni0.13O2; oxygen participates in different reactions depending on whether it is located in the surface or the bulk phase. It has been proposed that O-loss from Li-rich materials on charging, inherently a surface process, results in densification forming rocksalt/spinel structures at the surface.12–14,18,19 The consequence is a core–shell morphology to the particles. Such a morphology has implications for using techniques that are surface sensitive for probing the nature of the O-redox process.How the electronic structure varies from the surface to the bulk in the materials at various states of charge is not well known. In this work, we use the archetypal Li-rich cathode material Li1.2Ni0.2Mn0.6O2 to show that the balance between O-redox and TM-redox varies significantly from the surface to the bulk and that the surface, likely owing to its greater energy and interface with the electrolyte, appears to exhibit significantly higher degrees of oxygen oxidation. The concentration gradient of oxidised oxygen observed within the particle on charge supports the already well-established model for such materials, in which a rocksalt shell encases a layered core.7,9,11–15,20,21 We reach these conclusions through the first use of energy-tuned synchrotron X-ray photoelectron spectroscopy (XPS) with a truly wide range of excitation energies to give the most reliable depth profile. This is contrary to previous studies which use just one energy corresponding to a fixed depth, or only energies in the hard X-ray range, not taking into consideration near-surface processes.22,23 Whereas Assat et al.1 determine that oxidised oxygen formation in Li1.2Ni0.13Mn0.54Co0.13O2 is dependent on state of charge of the electrode, their range of excitation energies is limited leading to few observable surface vs. bulk differences. Whilst Sathiya et al.24 and McCalla et al.25 investigated Li2Ru0.5Sn0.5O3 and Li2IrO3, respectively, using laboratory-based XPS instruments fixed at one excitation energy, with neither study commenting on surface vs. bulk processes. Typically, XPS depth profiling is achieved by argon-ion sputtering, taking a measurement at regular intervals in between sputter sequences in order to build up a layer-by-layer chemical profile of the sample. This is a destructive technique and it has been shown to alter the bonding environment and oxidation state of atoms at the exposed surfaces.26–29 Energy-tuning utilises the effect of changing the ejected electron kinetic energy and thus their escape depth by altering the energy of the incident X-rays. Through doing so, very near surface structures can be observed (to ∼3 nm depth) when exciting the electrons with soft X-rays and information from deeper into the particles (up to 30 nm) can be obtained using tender to hard X-rays, as highlighted in Fig. 1a. As a comparison, the use of Al Kα X-ray radiation on a laboratory XPS corresponds to a depth of more than 6 nm which could not be considered surface-sensitive for the purposes of this study. Since the radial dimension of the particles (determined previously30) in this study is only double the approximate sampling depth we can consider this technique to be relatively bulk sensitive.
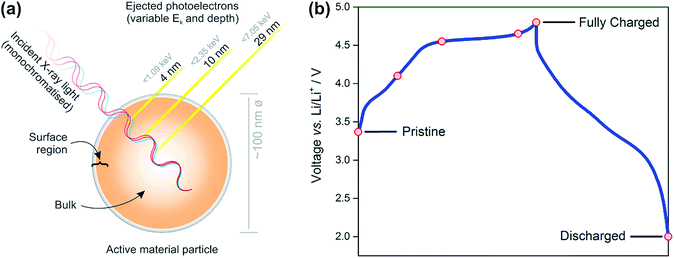 | ||
| Fig. 1 Schematic diagram representing the principles of energy-tuned X-ray photoelectron spectroscopy measurements (a) for cathodes removed from cells at various voltages along the charge–discharge curve (b). Photoelectrons of variable kinetic energy are ejected as a result of excitation by monochromatic light of different energies thus probing different depths of an active material particle. Refer to the ESI† (Note 1) for an explanation of calculated depths of origin. Red-coloured markers on the voltage profile of Li1.2Ni0.2Mn0.6O2 represent points at which samples were prepared for photoelectron spectroscopy measurements (pristine, charged to 4.1, 4.55, 4.65, and 4.8 V, discharged to 2 V vs. Li/Li+). | ||
We performed the energy-tuned XPS depth profiling at the I09 beamline at the Diamond Light Source taking advantage of its unique capabilities to collect spectra from soft and hard X-rays on the same sample. This allows us to map gradients in the oxygen and transition metal oxidation states for various states of charge. Additionally, excellent energy resolution can be achieved at the beamline, allowing spectral features to be resolved which may not have been possible using other sources, thus ensuring a reliable fitting of the data. The experimental results have been compared to theoretical models calculated using high level DFT methodology and this has been used to help us rationalise the difference between surface and bulk structures.
Methods
1. Materials synthesis
2. Electrode preparation
The cathode electrodes were prepared in the form of pellets composed of a mixture of active material, carbon Super P (Timcal) and polyethylene tetrafluoride (PTFE) in an 8![[thin space (1/6-em)]](https://www.rsc.org/images/entities/char_2009.gif) :
:![[thin space (1/6-em)]](https://www.rsc.org/images/entities/char_2009.gif) 1
1![[thin space (1/6-em)]](https://www.rsc.org/images/entities/char_2009.gif) :
:![[thin space (1/6-em)]](https://www.rsc.org/images/entities/char_2009.gif) 1 mass ratio, respectively. Once weighed in the correct ratio the powder mixture was homogenised with a mortar and pestle. Subsequently, 0.5 mL of isopropyl alcohol (99.5%, Sigma Aldrich) was added drop by drop to allow for a better homogeneity of the components distribution within the pellet. The wet powders were continuously kneaded in the mortar until all the IPA was evaporated and a uniform and compact pellet was attained. The pellet was then roll pressed down to a thickness of 125 μm and cut into small pieces that were dried overnight under dynamic vacuum at 80 °C before being assembled into coin cells.
1 mass ratio, respectively. Once weighed in the correct ratio the powder mixture was homogenised with a mortar and pestle. Subsequently, 0.5 mL of isopropyl alcohol (99.5%, Sigma Aldrich) was added drop by drop to allow for a better homogeneity of the components distribution within the pellet. The wet powders were continuously kneaded in the mortar until all the IPA was evaporated and a uniform and compact pellet was attained. The pellet was then roll pressed down to a thickness of 125 μm and cut into small pieces that were dried overnight under dynamic vacuum at 80 °C before being assembled into coin cells.
3. Cell preparation
After being completely dried the electrodes were assembled into coin cells from CR2325 coin-cells parts, provided by the National Research Council of Canada, under an inert argon atmosphere inside a glove box (MBraun LABmaster sp, O2 and H2O < 0.1 ppm). A lithium metal disc (Ø = 18 mm, 0.1 mm thick) was used as counter electrode with one Celgard and two glass fibre discs (Ø = 22 mm, Whatman GF-D) as separator, soaked with 0.2 mL of LP30 Selectilyte electrolyte (1 M LiPF6 in 1![[thin space (1/6-em)]](https://www.rsc.org/images/entities/char_2009.gif) :
:![[thin space (1/6-em)]](https://www.rsc.org/images/entities/char_2009.gif) 1 w/w ethylene carbonate
1 w/w ethylene carbonate![[thin space (1/6-em)]](https://www.rsc.org/images/entities/char_2009.gif) :
:![[thin space (1/6-em)]](https://www.rsc.org/images/entities/char_2009.gif) dimethyl carbonate, provided by BASF).
dimethyl carbonate, provided by BASF).
4. Electrochemical cycling
Cells were cycled on a BioLogic VMP3 potentiostat/galvanostat at 30 °C in a thermostatically controlled oven. A constant current corresponding to 50 mA g−1 was applied to the cells. The electrochemical behaviour of the materials is highly reproducible and the cells from which the samples were taken cycled as expected.5. X-ray photoelectron spectroscopy
Cells were disassembled under an inert argon atmosphere inside a glovebox (O2 and H2O < 0.1 ppm) and the cathodes washed in dry dimethyl carbonate (<10 ppm H2O) three times before being dried under vacuum for 5 minutes. Samples were mounted on copper plates using copper tape and loaded into a UHV transfer suitcase to be transported from the glovebox (at the home laboratory in Oxford) to the synchrotron. Hard X-ray photoelectron spectroscopy (HAXPES) and soft X-ray photoelectron spectroscopy (SOXPES) were performed at the Surface and Interface Structural Analysis beamline (I09) at Diamond Light Source (Oxfordshire, UK). In the hard X-ray regime, excitation energies of 2350 eV and the 3rd order light 7050 eV were used on all samples. To minimize radiation damage of the samples and to probe a large area of the sample to reduce the possibility of heterogeneity between particles, the beam was spread out using defocused settings; the spot at the sample is estimated to be approximately 300 μm (H) and up to 1 mm (W). Photons were monochromatized by a Si(111) double-crystal monochromator. In the soft X-ray regime, 1090 eV was used for more surface sensitive measurements. This branch of the beam line uses a plane grating monochromator. No charge neutralizer was used during the measurements. The spectra were recorded using a hemispherical VG Scienta EW4000 analyser set to a pass energy of 50 eV for soft X-rays and 200 eV for hard X-rays. Binding energies are calibrated to the C![[double bond, length as m-dash]](https://www.rsc.org/images/entities/char_e001.gif) C peak, from the carbon black in the electrodes, at 284.0 eV in the C 1s spectra (see ESI,† Note 3). The software package CasaXPS was used for analysis of photoelectron spectroscopy data and the Gaussian/Lorentzian peak shape GL(30) was used throughout the fitting. Replicate measurements on another separate set of samples demonstrated to us that the results and trends observed are reproducible.
C peak, from the carbon black in the electrodes, at 284.0 eV in the C 1s spectra (see ESI,† Note 3). The software package CasaXPS was used for analysis of photoelectron spectroscopy data and the Gaussian/Lorentzian peak shape GL(30) was used throughout the fitting. Replicate measurements on another separate set of samples demonstrated to us that the results and trends observed are reproducible.
6. Ab initio simulations
All calculations were performed using spin-polarised density functional theory (DFT) implemented in the Vienna ab initio simulation package (VASP).32 The Heyd–Scuseria–Ernzerhof (HSE06) hybrid functional33 was used to describe the electron exchange and correlation, with a hybrid mixing parameter of 0.2. It was shown that the application of this functional is necessary for the accurate description of the oxygen hole sates34–36 and redox activity.37–39 The projector augmented plane-wave method (PAW)40 was used for the interactions between valence and core electrons, while the valence electrons are described as plane waves with a cut-off energy of 520 eV. The k-space was sampled with an automatically generated k-point mesh using a spacing smaller than 0.05 Å−1. All atomic coordinates and lattice parameters were allowed to fully relax until the residual forces were smaller than 0.05 eV Å−1. Similar computational techniques have been applied in successful studies of other electrode materials.39,41–43 The structure of the Li-excess material was simulated with the composition Li1.17Ni0.25Mn0.58O2. The 2 × 1 × 2 supercell of Li2MnO3 was modified to contain 24 formula units of layered Li1.17Ni0.25Mn0.58O2, while the cation disordered rocksalt was created based on an Fm![[3 with combining macron]](https://www.rsc.org/images/entities/char_0033_0304.gif) m LiMnO2 structure containing 12 formula units. The cation ordering within the pristine materials and the Li+ arrangement within the delithiated structures of the layered oxide were generated following the methodology described by Seo et al.4 and using the Python Materials Genomics tool (pymatgen).44 The core level binding energies (ECL) of the O 1s electrons were evaluated with the initial state approximation45–50 and shifted with respect to a reference system (Li2MnO3 (ref. 51)) into the experimentally observed energy region.48,49 Full description of the applied methodology is in the ESI† (Note 10). It is important to note that the calculated core level energies are not suited for predictions of absolute values. Nevertheless, since the simulated core level shifts are accurate, these calculations assist in the interpretation of the experimental data by differentiating between types of oxygen species and environments at an atomistic level.
m LiMnO2 structure containing 12 formula units. The cation ordering within the pristine materials and the Li+ arrangement within the delithiated structures of the layered oxide were generated following the methodology described by Seo et al.4 and using the Python Materials Genomics tool (pymatgen).44 The core level binding energies (ECL) of the O 1s electrons were evaluated with the initial state approximation45–50 and shifted with respect to a reference system (Li2MnO3 (ref. 51)) into the experimentally observed energy region.48,49 Full description of the applied methodology is in the ESI† (Note 10). It is important to note that the calculated core level energies are not suited for predictions of absolute values. Nevertheless, since the simulated core level shifts are accurate, these calculations assist in the interpretation of the experimental data by differentiating between types of oxygen species and environments at an atomistic level.
Results
7. Photoelectron spectra of Li-rich Li1.2Ni0.2Mn0.6O2
Fig. 1b shows the voltage profiles for the Li1.2Ni0.2Mn0.6O2 cathode material studied. The red points indicate the voltages of samples analysed by photoelectron spectroscopy. The samples include the pristine electrode, charged to 4.1 V (during Ni oxidation), charged to 4.55 V (beyond the onset voltage typically associated with oxygen oxidation, and after Ni oxidation),22,52,53 charged to 4.65 V (further along the plateau), the top of charge (4.8 V), and discharged to 2 V.A positive shift (∼0.15–0.3 eV) of the transition metal oxide peak (O2−) is observed in the surface spectra, compared with the bulk, at all voltages. This shift has been determined to be a true chemical effect rather than a result of charging or an instrumental artefact (see ESI,† Note 4). Such a small shift represents the slightly more oxidised environment of oxygens (O(−1.x)) existing in the near-surface region or under-coordinated oxygens at the very surface making up the various facets of the particle. It is also possible for phases other than the layered structure to exist at some surface facets, as has been reported previously, even for pristine materials.11–17 For example, in the disordered rocksalt structure, cation mixing occurs between the transition metal and lithium layers, forming a greater number of Li–O–Li bonds than in the layered structure. This greater coordination of oxygen by lithium ions results in a larger degree of ionic bonding and hence less electron density on oxygen. This leads to the positive shift of the O2− peak observed at the surface.
On charge, a shift to a lower binding energy (∼528.8 eV) of the oxide (O2−) peak for all excitation energies can be attributed to the removal of Li+ ions from around O2− in the structure. It is expected that fewer Li+ ions coordinated to the O2− would result in more charge density on the oxide, leading to a negative shift on charging the cathode. The reverse is observed on discharge, when it is expected that lithium is inserted into the structure.
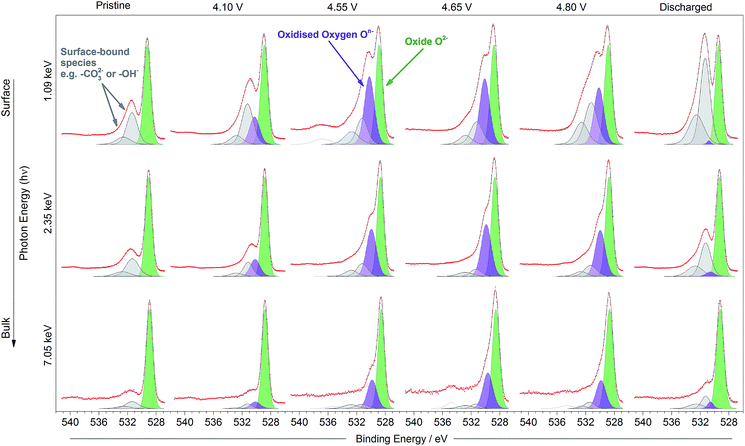
The oxidation of O2− to some kind of oxidised condition On− is typically reported23–25 as a relatively large positive shift which can be represented by a new peak (purple in figure, 530 eV) fitted in the spectra to higher binding energy of the O2− peak. This new peak can be resolved in the spectra for the electrodes at all potentials and excitation energies as the material is charged up to 4.8 V. The relative intensity for the On− peak is seen to be much smaller at 4.1 V than for higher voltages, where the oxygen redox processes are expected to a larger extent; this will be discussed further later. Apart from consistency with previous studies, the On− peak assignment is clear when compared with spectra for a material which does not exhibit oxygen redox activity and where such a peak would not be expected. The spinel-phase LiNi0.5Mn1.5O4 (Fig. 3), which offers robust high-voltage cycling and is not known to exhibit oxygen redox activity, does not show the formation of the On− species on charge. This provides further confirmation that the new peak fitted for the Li-rich material is attributable to the species On− and is a strong indication for the material undergoing oxygen oxidation on charge.
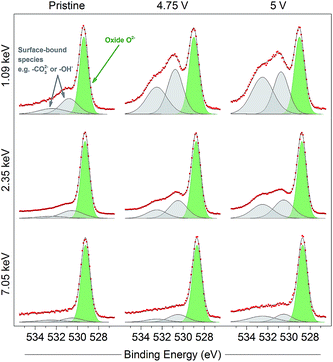 | ||
| Fig. 3 O 1s photoelectron spectra for pristine and charged (4.75 V and 5 V) high voltage spinel LiNi0.5Mn1.5O4 electrodes, measured using photon energies of 1.09, 2.35, and 7.05 keV. Only one peak can be fitted for structural oxygen (O2−, green), while surface-bound species (grey) show greatest intensity in near-surface measurements. Increasing intensity of the surface-bound species on charge is consistent with electrolyte oxidation/decomposition at the surface of the active material particles. Refer to the ESI† (Note 8) for further details. Raw data (red points) and the fitted model (black solid line), both without background subtracted, are superimposed and vertically offset from the component peaks. | ||
On lithiation of the layered oxide, the area for the On− peak reduces almost to nothing and an increase in the signal from surface-bound species is evident. This suggests a highly (but not completely) reversible process for the oxygen redox reaction. While extensive decomposition of the electrolyte is unlikely at 2 V vs. Li/Li+, it may be possible for a minor surface layer to form, detectable using the most surface-sensitive photon energies. The binding energy of the main surface species present on discharge is identical to that of the surface species already fitted in the spectra of the other samples, suggesting that lithium carbonate or similar is present. A peak at 55.6 eV corresponding to Li2CO3 is also present in the Li 1s spectrum of the discharged sample (ESI,† Note 5).
Further analysis in the ESI† (Note 6) explores the necessity to include the On− peak in the fitting model. Moreover, an alternative approach to the analysis (ESI,† Note 7), with the presumption of a uniform On− distribution from surface to bulk, results in a poorly fitted model to the experimental data and inconsistencies with previously reported observations.9
Fig. 4 shows the percentage On− out of the total oxide contribution (On−/[O2− + On−]%) at each depth, based on peak area analysis, as a function of voltage. The plot indicates that the proportion of On− is greater near to the surface for each of the charged samples. This demonstrates a strong depth dependency for the oxidation state of oxygen in this material during charge, with a greater concentration of On− near to the particle surface. While we might expect the ratio to increase across the oxygen redox plateau, in fact it drops slightly at the top of charge (4.8 V). This is consistent with the previously observed loss of oxygen from the structure at high voltages after the oxygen redox plateau.10,54
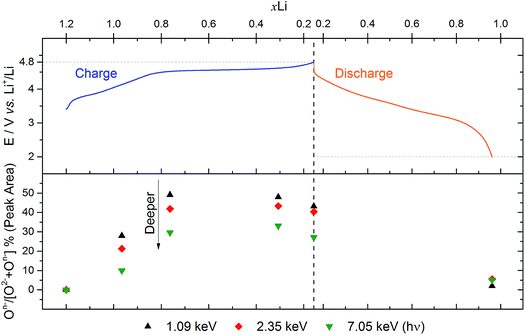 | ||
| Fig. 4 Analysis of O 1s spectra from Fig. 2 for Li1.2Ni0.2Mn0.6O2 electrodes at various voltages. The top panel shows a plot of the voltage profile for the first cycle as a function of the molar fraction of lithium, xLi (based on charge passed). The bottom panel shows the percentage On− out of the total oxide contribution (On−/[O2− + On−]%), based on peak areas, for each excitation energy (1.09, 2.35, and 7.05 keV) as a function of xLi. | ||
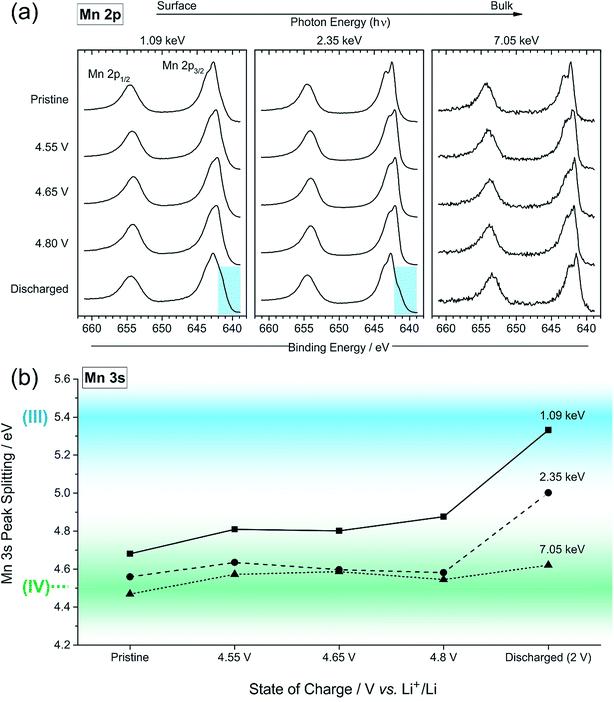
The most significant observation that we can make of the peak shape is in the series of spectra at 7.05 keV photon energy. On charge, particularly at 4.1 V but also at 4.55, 4.65, and 4.8 V, a shoulder (blue region) is observed at the higher BE side of the Ni 2p3/2 peak, which is also present in the spectra measured at 2.35 keV. Upon discharge the shape returns to one identical to that of the pristine sample. For surface measurements, we observe an opposite shift, to lower binding energies, for the charged samples, and can be indicative of a reduction of nickel at the near-surface. These features will be analysed further later in the discussion.
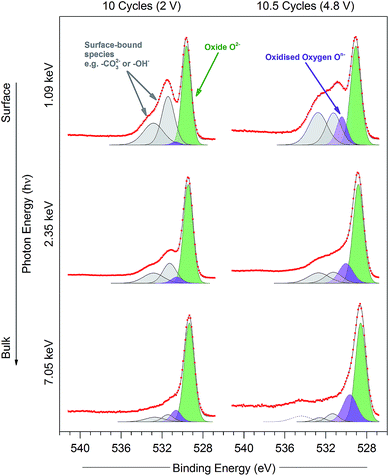 | ||
| Fig. 7 O 1s photoelectron spectra for the Li1.2Ni0.2Mn0.6O2 samples at 10 cycles (discharged state, 2 V) and 10.5 cycles (charged state, 4.8 V) measured using excitation energies of 1.09, 2.35, and 7.05 keV. Peaks are fitted for O2− (green), On− (purple), and surface-bound species (grey), according to the procedure in the ESI† (Note 2). Raw data (red points) and the fitted model (black solid line), both without background subtracted, are superimposed and vertically offset from the component peaks. | ||
8. Electronic structure simulations of layered and rocksalt structures
To complement and help interpret the spectroscopic measurements, we performed high level ab initio simulations including complex calculations of binding energies. The pristine material was investigated both as a layered oxide and a cation disordered rocksalt structure with the composition of Li1.17Ni0.25Mn0.58O2, which is a generally accepted simulation model.38,58 The cation disordered rocksalt structure serves as a representative surface phase, which is particularly consistent with previous reports of rocksalt formation on charge, but which may also be present to an extent on the pristine material. We note that the surface structure may not only be limited to the rocksalt phase, but that there may also be other phases present at the surface of the particles. The intention for these simulations is to demonstrate shifts in binding energies dependent on atomic arrangement in different structures of the same composition. The final simulated layered structure was fully consistent with previous studies,58–60 in which the excess Li ions in the transition metal layers are arranged in a honeycomb structure surrounded with either six Mn ions, or five Mn ions and one Ni ion (details in ESI,† Note 10). The rocksalt structure (Fm![[3 with combining macron]](https://www.rsc.org/images/entities/char_0033_0304.gif) m) was considered fully disordered with the same transition metal ratio as in the layered structure. We find that the disordered rocksalt form, as a bulk phase, is calculated to have a higher total energy than the layered structure by approximately 0.5 eV f.u.−1, which falls in the same range as previous reports on ordered/disordered LiMO2 materials.61
m) was considered fully disordered with the same transition metal ratio as in the layered structure. We find that the disordered rocksalt form, as a bulk phase, is calculated to have a higher total energy than the layered structure by approximately 0.5 eV f.u.−1, which falls in the same range as previous reports on ordered/disordered LiMO2 materials.61
Fig. 8 shows the simulated XPS binding energies for the O 1s core level of the two structure types of the pristine material, broken down into different transition metal oxide environments. For the rocksalt structure, many of the environments have higher binding energy than those in the layered structure. Therefore, we find a net positive shift in the calculated mean binding energy upon cation disordering: the mean core level binding energies are 530.5 eV and 530.8 eV for layered and cation disordered structures, respectively. The simulated energy difference agrees with the experimentally measured value (0.3 eV) between the surface and bulk, although we note that the calculated XPS energies are not sufficiently accurate for a quantitative comparison. In addition, the calculated normal Gaussian distribution of binding energies is broader for the disordered structure, which is also consistent with our experimental XPS data.
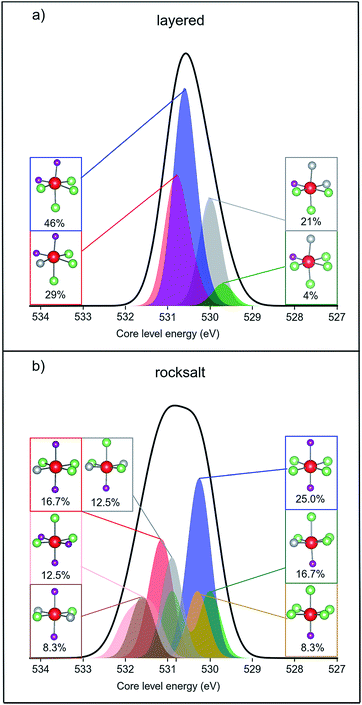 | ||
| Fig. 8 Simulated XPS data of pristine Li1.17Ni0.25Mn0.58O2 (a) layered structure (b) cation disordered rocksalt structure. The calculated O 1s core level binding energies were shifted with respect to the reference material Li2MnO3 (see ESI,† Note 10). The shape of the simulated XPS spectrum was created by fitting a Gaussian type “unit function” for each core level energy value and the functions cumulated for the whole system (black line) or for each different oxygen environment (coloured areas). The oxygen environments and their calculated % concentrations are summarised in subsets using ball and stick representations (Mn = purple, Li = green, Ni = grey, O = red). | ||
By plotting a cumulative Gaussian distribution for each type of oxygen coordination and for every oxygen within the structure we observe that the broadening is the consequence of a greater number of possible oxygen environments within the cation disordered rocksalt phase. Oxygens coordinated to four Li ions and two Mn ions are the most common in both structures of Li1.17Ni0.25Mn0.58O2. However, there are a total of four different coordination environments around oxygen within the layered-oxide model, while the rocksalt phase contains seven possible octahedral configurations. In addition, half of the oxygen environments of the layered structure appear to have linear Li–O–Li bonds, whereas every oxygen has such bonding within the rocksalt structure. According to Seo et al.,4 the linear Li–O–Li coordination is a structural requirement for oxygen oxidation upon delithiation. The presence of rocksalt phases at the surface may therefore, additionally, promote the formation of oxidised oxygens.
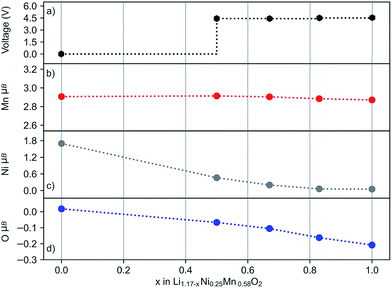
Four delithiated phases of layered Li1.17−xNi0.25Mn0.58O2 (x = 0.0, 0.5, 0.67, 0.83 and 1.0) were modelled and their O 1s core level binding energies calculated. Several different Li+ arrangements were considered to generate structures for the delithiated phases. According to previous studies, defect spinel-like features are possible on Li extraction, leading to Li+ in tetrahedral coordination.62,63 To allow for this possibility our delithiated structures contain Li+ ions in both octahedral and tetrahedral coordination. The simulated charging profile (shown in Fig. 9a) has the characteristic voltage plateau around 4.4–4.5 V in the 0.5 ≤ x ≤ 1.0 region.
The oxidation state of ions can best be related to their calculated magnetic moments as this reflects the spin density. Fig. 9b–d show the average magnetic moments of every ion type during the charging process. Our results indicate the oxidation of a small number of anions even at the beginning of the voltage plateau (x = 0.5), accompanied by the partial oxidation of Ni2+. With further extraction of lithium, the number of oxidised oxygens gradually increases and all Ni2+ ions oxidise. In contrast, the oxidation state of the Mn4+ ions is unchanged. While the Mn4+ has a constant value (2.9 μB), the magnetic moment for Ni varies between ∼1.7 and 0.0 μB depending on the lithium content. The change in average magnetic moment for oxygen is small in magnitude, but detectable, and corresponds to one quarter of the oxygens being oxidised. This is in good agreement with the experimental bulk On− signal. In general, the experimental data and models on oxygen redox activity are supported by these simulation results.
The oxygen redox activity within the delithiated structures is further investigated through analysis of the partial density of states and spin density (Fig. 10). Such analysis helps to support the modelling of the delithiated states where localised hole states are observed, and demonstrates consistency with other studies. It was previously shown35,39 that localised hole states on the oxygen have 2p character and usually appear in the lowest unoccupied bands. This aspect is illustrated more clearly by plotting the partial density of states for only the oxygens that are identified as O− based on their magnetic moments (Fig. 10a). Fig. 10b shows the charge density associated with the lowest unoccupied states, indicating that these oxygens are indeed associated with localised 2p holes and, interestingly, point in the direction of an unoccupied (or vacant) Li site along an Li–O–Li axis.
Ab initio simulations were also used to evaluate the core level binding energies of every oxygen for Li1.17−xNi0.25Mn0.58O2 structures with varying Li content (x = 0.0, 0.5, 0.67, 0.83 and 1.0), and are summarised in Table 1; the methodology used is described in the ESI† (Note 10). The results reveal a distinct energy difference between the core level energies of the two different oxygen species: the lattice O2− peak is found to fall around 530.2–531.0 eV, whereas the oxidised oxygen always appear at higher binding energies of ∼532.0 eV. We conclude that the difference between calculated mean values (i.e. the peak separation) is around 1.1–1.5 eV, which is in agreement with the experimental peak difference; these results again provide quantitative support for our experimental analysis of the oxygen redox activity.
| x | 〈ECL(O2−)〉/eV | 〈ECL(O−)〉/eV | ΔECL/eV |
|---|---|---|---|
| 0.0 | 530.5 (0.3) | — | — |
| 0.50 | 530.2 (0.5) | 531.7 (0.1) | 1.5 |
| 0.67 | 530.4 (0.6) | 531.8 (0.4) | 1.4 |
| 0.83 | 530.5 (0.5) | 532.0 (0.2) | 1.4 |
| 1.0 | 531.0 (0.8) | 532.1 (0.5) | 1.1 |
Discussion
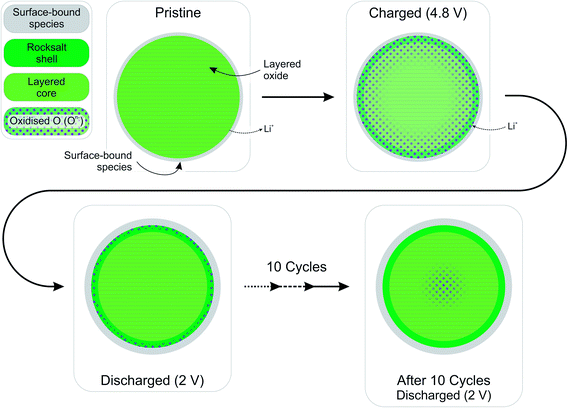
The high resolution O 1s photoelectron spectra demonstrate that there are two discrete species of oxygen, O2− and an oxidised oxide ion On−. This is consistent with the model for O-redox described in our previous paper,2 in which we showed experimentally that the holes generated on oxide ions upon oxidation are localised at specific oxygens in the lattice, those coordinated by ionic bonds with Li and Mn. However, the specific degree of oxidation cannot be confirmed from the XPS results, as is also the case in previous studies where the oxidised oxygen is described as either On−, O−, or ‘peroxo-like’.1,22,23 The observation of the two species at 4.1 V suggests that the onset of oxygen oxidation can occur in the near-surface region at lower voltages than previously thought, while the major onset at 4.55 V is consistent with previous reports for bulk measurements. An advantage to using the surface-sensitive soft X-ray XPS is that this initial onset at the surface can be detected while exclusively bulk-sensitive techniques such as transmission mode absorption spectroscopies may not have detected such a signal. The O2− ion signal exhibits a slightly higher binding energy at the surface than in the bulk, consistent with a variation in the electronic structure at the near-surface compared with the bulk. This observation is in good accord with the established core–shell model for these materials, particularly for delithiated phases, but additionally for pristine materials which have been shown to exhibit alternative phases (e.g. rocksalt) to the bulk.11–17 This has been particularly reported from STEM experiments for the material in the present study and similar Li-rich materials, in the pristine state and after cycling of the electrode.7,9,11–15,20,21 Our calculations of mean core level binding energies for rocksalt and layered structures, identified by the DFT studies in this work, support the shifts in binding energies observed experimentally, which are attributed to a core–shell particle structure. A broadening of the O2− peak (increase in FWHM) at the surface in the pristine sample (1.13 eV for the 1.09 keV; 1.03 eV for the 7.05 eV) represents the greater disorder and more numerous oxygen environments at the near-surface, consistent with a rocksalt layer. The slightly lower binding energy for O2− at high voltage can be interpreted as due to the loss of Li+ ions from the coordination environment of the O2− ions, resulting in an upward shift in the O 2p states. A depth-dependant shift in the Ni 2p spectra for the pristine material is also consistent with a core–shell structure, while shifting in surface spectra on charge points towards further structural rearrangements. Nickel is observed to be most active in the bulk layered phase with a clear change of peak shape occurring at 4.1 V on charge, indicative of an oxidation process likely from Ni2+ to Ni3+/Ni4+. This feature is still evident, but to a lesser extent, upon continued charging up to 4.8 V, after which the peak shape returns to that of the pristine material on discharge suggesting a reduction of the nickel. The calculated average magnetic moment of nickel in the disordered rocksalt structure (1.4 μB) is slightly lower than in the layered structure (1.7 μB), suggesting a different structural phase or partially oxidised Ni ions close to the surface, which accounts for slightly different binding energies at the surface to the bulk for Ni in the pristine material. However, for the charged electrodes we observe what is likely attributed to a reduction of nickel at the surface. This is consistent with previous reports of nickel reduction being associated with greater oxygen oxidation activity at the surface of particles.52 The calculated average magnetic moment of manganese in the rocksalt is 3.2 μB, while for the layered structure it is 2.9 μB, indicative of manganese in a partially reduced state close to the surface of the pristine material. This is supported experimentally, primarily by a mixture of Mn4+ and Mn3+ states at the surface determined by the Mn 3s peak splitting, but also by Mn 2p BE shifting and peak shape changes from surface to bulk for the pristine material. Mn is stable during charge remaining in the Mn4+ state, as predicted by our calculations of magnetic moments. However, on discharge we observe from both the Mn 2p and Mn 3s analysis a reduction of Mn close to the surface, further supporting the core–shell model. In addition, the reduction of Mn near the surface upon discharge could be consistent with activation of Mn due to oxygen loss, formation of a rocksalt layer, or dissolution.Experimentally, we observe a higher proportion of On− at the surface than in the bulk in the charged states, characterised by the higher intensity of the On− peaks at the surface, relative to the O2− peaks. Energy-tuned XPS is used as an inherently surface-sensitive (nm scale, up to 29 nm in this case) technique as opposed to a bulk-‘whole electrode’-sensitive technique (>100 μm) in order to probe a large series of individual particles within the electrode. This gives us confidence that the concentration gradient observed on the scale of the particles rather than a result of the solid-state diffusion effects across the electrode thickness. Our results suggest that oxygen oxidation occurs preferentially in the particle surface layers, with an On− concentration gradient existing through to the particle bulk. The signal for On− in the surface measurement upon charge (43% at 4.8 V) cannot account for the whole On− signal observed in the bulk measurement (27% at 4.8 V), despite the exponential decay of electron escape depth exhibited in XPS measurements, since the range of probing depth is so large (4 nm vs. 29 nm). A thorough calculation demonstrating that part of the On− signal is originating from the bulk is provided in ESI, Note 1.† Therefore, whilst at each voltage a greater proportion of On− is observed close to the surface, the results indicate that a significant amount of the oxidised oxygen is formed in the bulk. This would be expected from the substantial charge compensation attributed to O-redox. The concentration gradient observed for the oxidised oxygen is highly consistent with the well-established core–shell model for the material, which is characterised by the formation of a substantial rocksalt phase surface layer 2–3 nm in thickness as seen in STEM images (ESI,† Note 11). However, with part of the oxidised oxygen signal originating from the bulk, we can say that it is not only the rocksalt layer which contains the On− species. This points to the well-established core–shell structure of such materials not being directly coupled to the oxidised oxygen concentration gradient observed in this study. This is despite the rocksalt surface layer likely exhibiting a higher probability of oxygen redox, due to the greater proportion of Li–O–Li bonding compared with the layered structure. More likely, the concentration gradient observed is as a result of the oxygen at the near-surface being oxidised first as lithium continues to be inserted from the electrolyte. As diffusion of lithium from surface to bulk proceeds, so then the bulk oxygen is partially oxidised as well. This mechanism is presented schematically in Fig. 11. It was shown that after 10 cycles there is a greater retention of On− in the bulk than at the surface. We see this as particularly significant and suggests that diffusion limitations of the structure prevent oxygen loss from the bulk. This further supports the greater activity at the near-surface region and agrees well with the core–shell model. We expect that, close to the end of charge after extensive delithiation of the structure, the possible locations for oxygen oxidation (e.g. Li–O–Li configurations) will be fewer leading to the reduced possibility for oxygen oxidation. This is likely to contribute to the limitation of the oxygen redox reaction or oxygen loss from the structure, and limit the charge capacity of the electrode. It is probable that the particle structure is more complicated than what has been determined in this study, for example with certain facets of a particle surface demonstrating a high affinity for oxygen oxidation than others. However, by using a large spot size for our experiments we have measured an average state over many particles within each sample and therefore present an overall picture but with a clear surface vs. bulk trend.
These results additionally highlight the importance of making such measurements using multiple excitation energies over a wide range to probe the structure from the very surface through to the bulk. The lowest excitation energy of 1.09 keV used in this study is able to probe almost exclusively the 2–3 nm rocksalt layer present at the surface of the particles, whilst the use of only one ‘mid-range’ energy on a laboratory XPS, corresponding to a depth of more than 6 nm does not represent the near-surface region. Similarly, employing only hard X-ray energies, as in previous studies, disregards surface processes, creating ambiguity and not revealing the true nature of the material and processes being investigated.
Conclusions
To conclude, a depth dependency for the oxygen oxidation reaction has been demonstrated by using energy-tuned photoelectron spectroscopy to probe the Li-rich layered Li1.2Ni0.2Mn0.6O2 cathode material. As expected and reported elsewhere, this material exhibits a high degree of redox activity by oxygen in the lattice, being oxidised from O2− to a species we designate On− on charge; both are detected as discrete species in our photoelectron spectroscopy measurements. This is in contrast to the oxygen spectra obtained for the oxygen redox inactive high voltage spinel LiNi0.5Mn1.5O4, for which no On− species is detected. A concentration gradient of the On− species is observed in the layered material with a higher concentration at the surface of particles compared with the bulk in the charged electrodes. Our findings support an already well-established core–shell particle structure but appear to show that the concentration gradient is not directly coupled to the 2–3 nm rocksalt shell often observed. Measurements indicate a variation between surface and bulk in the electronic structure of the oxide or the presence of alternative surface phases already on the pristine material, but as would be particularly expected of the charged material. High level ab initio calculations support this observation, where the O2− of the rocksalt structure, representing a possible surface layer, has a higher mean binding energy than that for the layered structure. Calculated core level binding energy differences for O2− and O− species are in very close agreement with experimental analysis. The simulations on delithiated phases show oxidation of nickel, with negligible change to the manganese oxidation state, in good agreement with bulk photoelectron spectroscopy measurements and previous studies using alternative bulk-sensitive spectroscopies. By employing a spectroscopic technique sensitive to both the surface and the bulk, we have been able to reveal the depth-dependent oxygen redox activity of this material, which is consistent with the existing core–shell model. This methodology could be applied to similar such materials in order to further understand their charge compensation mechanisms.Supporting data
Supporting research data has been deposited in the Oxford Research Archive and is available under this DOI: 10.5287/bodleian:8grVPv41rConflicts of interest
There are no conflicts to declare.Acknowledgements
P. G. B. is indebted to the Engineering and Physical Sciences Research Council (EPSRC), including the SUPERGEN Energy Storage Hub [EP/L019469/1], Enabling Next Generation Lithium Batteries [EP/M009521/1], Henry Royce Institute for Advanced Materials [EP/R00661X/1, EP/S019367/1, EP/R010145/1] and the Faraday Institution All-Solid-State Batteries with Li and Na Anodes [FIRG007, FIRG008] for financial support. The authors gratefully acknowledge the MCC/Archer consortium (EP/L000202/1) and the Swedish National Graduate School in Neutron Scattering (SwedNess), part of the Swedish Foundation for Strategic Research (SSF). We thank Diamond Light Source for access to beamline I09 (proposal numbers NT14733-1 and SI16629-1) that contributed to the results presented here. We are grateful to Dr Tien-Lin Lee, Dr Christoph Schlueter and Dr Pardeep Thakur Kumar for their assistance.References
- G. Assat, D. Foix, C. Delacourt, A. Iadecola, R. Dedryvère and J.-M. Tarascon, Nat. Commun., 2017, 8, 2219 CrossRef PubMed.
- K. Luo, M. R. Roberts, R. Hao, N. Guerrini, D. M. Pickup, Y.-S. Liu, K. Edström, J. Guo, A. V Chadwick, L. C. Duda and P. G. Bruce, Nat. Chem., 2016, 8, 684–691 CrossRef CAS PubMed.
- L.-C. Duda and K. Edström, J. Electron Spectrosc. Relat. Phenom., 2017, 221, 79–87 CrossRef CAS.
- D.-H. Seo, J. Lee, A. Urban, R. Malik, S. Kang and G. Ceder, Nat. Chem., 2016, 8, 692–697 CrossRef CAS PubMed.
- J. Hong, W. E. Gent, P. Xiao, K. Lim, D.-H. Seo, J. Wu, P. M. Csernica, C. J. Takacs, D. Nordlund, C.-J. Sun, K. H. Stone, D. Passarello, W. Yang, D. Prendergast, G. Ceder, M. F. Toney and W. C. Chueh, Nat. Mater., 2019, 18, 256–265 CrossRef CAS PubMed.
- M. Ben Yahia, J. Vergnet, M. Saubanère and M.-L. Doublet, Nat. Mater., 2019, 18, 496–502 CrossRef CAS PubMed.
- N. Yabuuchi, K. Yoshii, S. T. Myung, I. Nakai and S. Komaba, J. Am. Chem. Soc., 2011, 133, 4404–4419 CrossRef CAS PubMed.
- N. Tran, L. Croguennec, M. Ménétrier, F. Weill, P. Biensan, C. Jordy and C. Delmas, Chem. Mater., 2008, 20, 4815–4825 CrossRef CAS.
- H. Koga, L. Croguennec, M. Ménétrier, P. Mannessiez, F. Weill and C. Delmas, J. Power Sources, 2013, 236, 250–258 CrossRef CAS.
- R. Armstrong, M. Holzapfel, P. Novák, C. S. Johnson, S. H. Kang, M. M. Thackeray and P. G. Bruce, J. Am. Chem. Soc., 2006, 128, 8694–8698 CrossRef PubMed.
- C. Genevois, H. Koga, L. Croguennec, M. Ménétrier, C. Delmas and F. Weill, J. Phys. Chem. C, 2015, 119, 75–83 CrossRef CAS.
- M. Gu, A. Genc, I. Belharouak, D. Wang, K. Amine, S. Thevuthasan, D. R. Baer, J. G. Zhang, N. D. Browning, J. Liu and C. Wang, Chem. Mater., 2013, 25, 2319–2326 CrossRef CAS.
- J. Zheng, P. Xu, M. Gu, J. Xiao, N. D. Browning, P. Yan, C. Wang and J. G. Zhang, Chem. Mater., 2015, 27, 1381–1390 CrossRef CAS.
- F. Lin, I. M. Markus, D. Nordlund, T.-C. Weng, M. D. Asta, H. L. Xin and M. M. Doeff, Nat. Commun., 2014, 5, 3529 CrossRef PubMed.
- P. Lu, P. Yan, E. Romero, E. D. Spoerke, J. G. Zhang and C. M. Wang, Chem. Mater., 2015, 27, 1375–1380 CrossRef CAS.
- B. Strehle, K. Kleiner, R. Jung, F. Chesneau, M. Mendez, H. A. Gasteiger and M. Piana, J. Electrochem. Soc., 2017, 164, A400–A406 CrossRef CAS.
- T. Teufl, B. Strehle, P. Müller, H. A. Gasteiger and M. A. Mendez, J. Electrochem. Soc., 2018, 165, A2718–A2731 CrossRef CAS.
- S. Kim, W. Cho, X. Zhang, Y. Oshima and J. W. Choi, Nat. Commun., 2016, 7, 13598 CrossRef CAS PubMed.
- P. Yan, A. Nie, J. Zheng, Y. Zhou, D. Lu, X. Zhang, R. Xu, I. Belharouak, X. Zu, J. Xiao, K. Amine, J. Liu, F. Gao, R. Shahbazian-Yassar, J.-G. Zhang and C.-M. Wang, Nano Lett., 2015, 15, 514–522 CrossRef CAS PubMed.
- K. J. Carroll, D. Qian, C. Fell, S. Calvin, G. M. Veith, M. Chi, L. Baggetto and Y. S. Meng, Phys. Chem. Chem. Phys., 2013, 15, 11128 RSC.
- A. K. Shukla, Q. M. Ramasse, C. Ophus, H. Duncan, F. Hage and G. Chen, Nat. Commun., 2015, 6, 8711 CrossRef CAS PubMed.
- K. Shimoda, T. Minato, K. Nakanishi, H. Komatsu, T. Matsunaga, H. Tanida, H. Arai, Y. Ukyo, Y. Uchimoto and Z. Ogumi, J. Mater. Chem. A, 2016, 4, 5909–5916 RSC.
- D. Foix, M. Sathiya, E. McCalla, J.-M. Tarascon and D. Gonbeau, J. Phys. Chem. C, 2016, 120, 862–874 CrossRef CAS.
- M. Sathiya, G. Rousse, K. Ramesha, C. P. Laisa, H. Vezin, M. T. Sougrati, M.-L. Doublet, D. Foix, D. Gonbeau, W. Walker, a. S. Prakash, M. Ben Hassine, L. Dupont and J.-M. Tarascon, Nat. Mater., 2013, 12, 827–835 CrossRef CAS PubMed.
- E. McCalla, A. M. Abakumov, M. Saubanère, D. Foix, E. J. Berg, G. Rousse, M. L. Doublet, D. Gonbeau, P. Novák, G. Van Tendeloo, R. Dominko and J. M. Tarascon, Science, 2015, 350, 1516–1521 CrossRef CAS PubMed.
- D. Leinen, A. Fernández, J. P. Espinós and A. R. González-Elipe, Surf. Interface Anal., 1993, 20, 941–948 CrossRef CAS.
- N. Sanada, A. Yamamoto, R. Oiwa and Y. Ohashi, Surf. Interface Anal., 2004, 36, 280–282 CrossRef CAS.
- J.-N. Kim, K.-S. Shin, D.-H. Kim, B.-O. Park, N.-K. Kim and S.-H. Cho, Appl. Surf. Sci., 2003, 206, 119–128 CrossRef CAS.
- G. Panzner, B. Egert and H. P. Schmidt, Surf. Sci., 1985, 151, 400–408 CrossRef CAS.
- K. Luo, M. R. Roberts, N. Guerrini, N. Tapia-Ruiz, R. Hao, F. Massel, D. M. Pickup, S. Ramos, Y. S. Liu, J. Guo, A. V. Chadwick, L. C. Duda and P. G. Bruce, J. Am. Chem. Soc., 2016, 138, 11211–11218 CrossRef CAS PubMed.
- K. M. Shaju and P. G. Bruce, Adv. Mater., 2006, 18, 2330–2334 CrossRef CAS.
- G. Kresse and J. Furthmüller, Phys. Rev. B: Condens. Matter Mater. Phys., 1996, 54, 11169–11186 CrossRef CAS PubMed.
- J. Heyd, G. E. Scuseria and M. Ernzerhof, J. Chem. Phys., 2006, 124, 2005–2006 CrossRef.
- J. B. Varley, A. Janotti, C. Franchini and C. G. Van De Walle, Phys. Rev. B, 2012, 85, 2–5 CrossRef.
- H. Chen and N. Umezawa, Phys. Rev. B, 2014, 90, 1–5 Search PubMed.
- H. Chen and J. A. Dawson, Phys. Rev. Appl., 2015, 3, 064011 CrossRef.
- V. L. Chevrier, S. P. Ong, R. Armiento, M. K. Y. Chan and G. Ceder, Phys. Rev. B: Condens. Matter Mater. Phys., 2010, 82, 075122 CrossRef.
- D. H. Seo, A. Urban and G. Ceder, Phys. Rev. B, 2015, 92, 1–11 Search PubMed.
- H. Chen and M. S. Islam, Chem. Mater., 2016, 28, 6656–6663 CrossRef CAS.
- P. E. Blöchl, Phys. Rev. B: Condens. Matter Mater. Phys., 1994, 50, 17953–17979 CrossRef PubMed.
- Y. Yuan, C. Zhan, K. He, H. Chen, W. Yao, S. Sharifi-Asl, B. Song, Z. Yang, A. Nie, X. Luo, H. Wang, S. M. Wood, K. Amine, M. S. Islam, J. Lu and R. Shahbazian-Yassar, Nat. Commun., 2016, 7, 13374 CrossRef CAS PubMed.
- C. Eames, J. M. Frost, P. R. F. Barnes, B. C. O'Regan, A. Walsh and M. S. Islam, Nat. Commun., 2015, 6, 7497 CrossRef CAS PubMed.
- A. R. Armstrong, C. Lyness, P. M. Panchmatia, M. S. Islam and P. G. Bruce, Nat. Mater., 2011, 10, 223–229 CrossRef CAS PubMed.
- S. P. Ong, W. D. Richards, A. Jain, G. Hautier, M. Kocher, S. Cholia, D. Gunter, V. L. Chevrier, K. A. Persson and G. Ceder, Comput. Mater. Sci., 2013, 68, 314–319 CrossRef CAS.
- S. Lizzit, A. Baraldi, A. Groso, K. Reuter, M. V. Ganduglia-Pirovano, C. Stampfl, M. Scheffler, M. Stichler, C. Keller, W. Wurth and D. Menzel, Phys. Rev. B: Condens. Matter Mater. Phys., 2001, 63, 205419 CrossRef.
- L. Köhler and G. Kresse, Phys. Rev. B: Condens. Matter Mater. Phys., 2004, 70, 165405 CrossRef.
- P. B. Paramonov, S. A. Paniagua, P. J. Hotchkiss, S. C. Jones, N. R. Armstrong, S. R. Marder and J. L. Bredas, Chem. Mater., 2008, 20, 5131–5133 CrossRef CAS.
- É. Guille, G. Vallverdu and I. Baraille, J. Chem. Phys., 2014, 141, 244703 CrossRef PubMed.
- É. Guille, G. Vallverdu, Y. Tison, D. Bégué and I. Baraille, J. Phys. Chem. C, 2015, 119, 23379–23387 CrossRef.
- N. Pueyo Bellafont, F. Vines, W. Hieringer and F. Illas, J. Comput. Chem., 2017, 38, 518–522 CrossRef CAS PubMed.
- S. Han, Y. Xia, Z. Wei, B. Qiu, L. Pan, Q. Gu, Z. Liu and Z. Guo, J. Mater. Chem. A, 2015, 3, 11930–11939 RSC.
- W. E. Gent, K. Lim, Y. Liang, Q. Li, T. Barnes, S.-J. Ahn, K. H. Stone, M. McIntire, J. Hong, J. H. Song, Y. Li, A. Mehta, S. Ermon, T. Tyliszczak, D. Kilcoyne, D. Vine, J.-H. Park, S.-K. Doo, M. F. Toney, W. Yang, D. Prendergast and W. C. Chueh, Nat. Commun., 2017, 8, 2091 CrossRef PubMed.
- L. Simonin, J.-F. Colin, V. Ranieri, E. Canévet, J.-F. Martin, C. Bourbon, C. Baehtz, P. Strobel, L. Daniel and S. Patoux, J. Mater. Chem., 2012, 22, 11316 RSC.
- J. Xu, M. Sun, R. Qiao, S. E. Renfrew, L. Ma, T. Wu, S. Hwang, D. Nordlund, D. Su, K. Amine, J. Lu, B. D. McCloskey, W. Yang and W. Tong, Nat. Commun., 2018, 9, 947 CrossRef PubMed.
- R. Azmi, V. Trouillet, M. Strafela, S. Ulrich, H. Ehrenberg and M. Bruns, Surf. Interface Anal., 2018, 50, 43–51 CrossRef CAS.
- M. C. Biesinger, B. P. Payne, A. P. Grosvenor, L. W. M. Lau, A. R. Gerson and R. S. C. Smart, Appl. Surf. Sci., 2011, 257, 2717–2730 CrossRef CAS.
- J. L. Junta and M. F. Hochella, Geochim. Cosmochim. Acta, 1994, 58, 4985–4999 CrossRef CAS.
- B. Xu, C. R. Fell, M. Chi and Y. S. Meng, Energy Environ. Sci., 2011, 4, 2223 RSC.
- J.-S. Kim, C. S. Johnson, J. T. Vaughey, M. M. Thackeray, S. A. Hackney, W. Yoon and C. P. Grey, Chem. Mater., 2004, 16, 1996–2006 CrossRef CAS.
- Y. S. Meng, G. Ceder, C. P. Grey, W.-S. Yoon, M. Jiang, J. Bréger and Y. Shao-Horn, Chem. Mater., 2005, 17, 2386–2394 CrossRef CAS.
- A. Abdellahi, A. Urban, S. Dacek and G. Ceder, Chem. Mater., 2016, 28, 3659–3665 CrossRef CAS.
- A. Abdellahi, A. Urban, S. Dacek and G. Ceder, Chem. Mater., 2016, 28, 5373–5383 CrossRef CAS.
- K. Kang, Y. S. Meng, J. Bréger, C. P. Grey, G. Ceder and G. Ceder, Science, 2006, 311, 977–980 CrossRef CAS PubMed.
Footnotes |
| † Electronic supplementary information (ESI) available. See DOI: 10.1039/c9ta09019c |
| ‡ Current address: Department of Chemistry – Ångström Laboratory, Uppsala University, Box 538, SE-75121 Uppsala, Sweden. |
| This journal is © The Royal Society of Chemistry 2019 |

