 Open Access Article
Sr2Fe1.4Mn0.1Mo0.5O6−δ perovskite cathode for highly efficient CO2 electrolysis†
Yunan
Jiang
a,
Yi
Yang
a,
Changrong
Xia
 *a and
Henny J. M.
Bouwmeester
 *ab
*ab
aCAS Key Laboratory of Materials for Energy Conversion Department of Materials Science and Engineering, University of Science and Technology of China, No. 96 Jinzhai Road, Hefei, Anhui Province 230026, P. R. China. E-mail: xiacr@ustc.edu.cn
bElectrochemistry Research Group, Membrane Science and Technology, Department of Science and Technology, MESA+ Research Institute for Nanotechnology, University of Twente, Drienerlolaan 5, 7522 NB, Enschede, The Netherlands. E-mail: h.j.m.bouwmeester@utwente.nl
First published on 24th September 2019
Abstract
High-temperature solid oxide cells afford chemical storage of renewable electricity. In particular, the electrochemical conversion of the greenhouse gas CO2 is attracting increasing interest to facilitate a sustainable energy technology. In this work, the effectiveness of perovskite-structured Sr2Fe1.4Mn0.1Mo0.5O6−δ (SFMM0.1) for use as cathode material for CO2 electrolysis has been investigated. Both parent Sr2Fe1.5Mo0.5O6−δ (SFM) and SFMM0.1 are found to be redox stable in air and 5% H2/Ar at 850 °C. Electrical conductivity relaxation experiments and first-principle calculations reveal that oxygen transport, CO2 adsorption and reduction kinetics are enhanced upon doping of SFM with Mn. The faster CO2 reduction kinetics observed for SFMM0.1 relative to SFM is reflected in a lower polarization resistance when both materials are used as single-phase electrodes in symmetrical cells. The polarization resistance in 50% CO/CO2 at 800 °C decreases from 1.15 Ω cm2 for SFM to 0.60 Ω cm2 for SFMM0.1. Under similar conditions, the polarization resistance decreases further to 0.50 Ω cm2 for a symmetrical cell with dual-phase SFMM0.1-SDC (samaria-doped ceria) electrodes. Unprecedented performance is demonstrated when SFMM0.1-SDC is integrated as the cathode in a solid oxide cell for electrolysis of pure CO2, achieving a current density of 1.35 A cm2 at 800 °C at 1.5 V.
Introduction
There is a worldwide interest to convert surplus electricity generated from renewables to storable fuels such as hydrogen, methane and liquid fuels.1–3 In particular, solid oxide electrolysis of the greenhouse gas CO2, with subsequent conversion of the products to useful fuels, attracts great interest.4 Currently, the nickel–yttria-stabilized zirconia (Ni–YSZ) cermet electrode is the most commonly used cathode in high-temperature solid oxide electrolysis cells (SOECs) due to its high electrocatalytic activity toward CO2 reduction. Its inherent drawback, however, is the limited redox stability of Ni. Under typical operating conditions of an SOEC device, Ni is easily oxidized to NiO, Ni(OH) or highly volatile Ni(OH)2, when the concentration of the reducing gas is too low and, hence, the oxygen partial pressure gets too high.5 Furthermore, degradation and/or delamination may occur when the current density exceeds values of the order of ∼1 A cm−2.3 Consequently, researchers still endeavor to find alternative cathode materials, thereby focusing on mixed ionic-electronic conducting oxides capable of redox changes, while retaining (long-term) stability under the harsh conditions of SOEC operation. Compared to the Ni-YSZ cermet electrode, where the electrochemical reduction is confined to the vicinity of the triple-phase boundary (TPB) lines, ceramic oxides with mixed ionic-electronic conductivity have the advantage in that they extend the active region over the entire gas/solid phase interface. Many mixed-conducting perovskite-type oxides have been tested for use as cathode for CO2 electrolysis such as La0.75Sr0.25Cr0.5Mn0.5O3 (LSCM),6–8 LaxSr1−xTiO3−δ (LST),9–11 La0.8Sr0.2FeO3−δ (LSF),12 and Sr2Fe1.5Mo0.5O6−δ (SFM).13–15 Amongst these, the iron-based materials LSF and SFM are reported to exhibit the highest electrocatalytic activity for CO2 reduction in the intermediate to high temperature range (600–850 °C).Isomorphic substitution of A- or B-sites by other types of cations is a known strategy to optimize the performance of perovskite oxide electrodes.16–25 In previous research,13–15 we showed that the double perovskite SFM is a promising electrode material for pure CO2 electrolysis. Aiming at further promoting the rate of CO2 reduction at the SFM surface, we have investigated in this work the influence of partial substitution of Fe in SFM by Mn (to produce Sr2Fe1.4Mn0.1Mo0.5O6−δ (SFMM0.1)) on its effectiveness as a cathode material for CO2 electrolysis. Density functional theory (DFT) computations are performed to evaluate oxygen migration and the interaction between adsorbed CO2 and the Mn-doped SFM surface.
Experimental
Synthesis
The citric acid-glycine combustion method was used to synthesize Sr2Fe1.5−xMnxMo0.5O6−δ (SFMMx; x = 0, 0.1, 0.2, 0.3, 0.4, 0.5) powders. Sr(NO3)2, Fe(NO3)3·9H2O, (CH3COO)2Mn·4H2O and (NH4)6Mo7O24·4H2O (purity of 99.0%) in the appropriate stoichiometric ratios were dissolved in distilled water. To this solution glycine and citric acid were added in a molar ratio of citric acid![[thin space (1/6-em)]](https://www.rsc.org/images/entities/char_2009.gif) :
:![[thin space (1/6-em)]](https://www.rsc.org/images/entities/char_2009.gif) glycine
glycine![[thin space (1/6-em)]](https://www.rsc.org/images/entities/char_2009.gif) :
:![[thin space (1/6-em)]](https://www.rsc.org/images/entities/char_2009.gif) total metal cations of 1.5
total metal cations of 1.5![[thin space (1/6-em)]](https://www.rsc.org/images/entities/char_2009.gif) :
:![[thin space (1/6-em)]](https://www.rsc.org/images/entities/char_2009.gif) 2
2![[thin space (1/6-em)]](https://www.rsc.org/images/entities/char_2009.gif) :
:![[thin space (1/6-em)]](https://www.rsc.org/images/entities/char_2009.gif) 1. All the above chemicals with high purity (>99.0%) were purchased from Sinopharm Chemical Reagent Co., Ltd. After stirring with a magnetic mixer for 2 h, the solution was put into an induction cooker and heated to self-combustion, producing dark brown ashes. The ashes were collected and annealed at 1100 °C for 5 h in air, using a heating rate of 3 °C min−1, and subsequently furnace-cooled to room temperature. Ce0.8Sm0.2O1.9 (SDC) was used as electrode additive and was prepared using a similar sol–gel method. The combustion product was annealed at 600 °C for 2 h to form the phase-pure fluorite phase as checked by X-ray powder diffraction (see below). Powders of La0.9Sr0.1Ga0.8Mg0.2O3−δ (LSGM) and La0.6Sr0.4Co0.2Fe0.8O3−δ (LSCF), both from Fuel Cell Materials, USA, were used without any further treatment.
1. All the above chemicals with high purity (>99.0%) were purchased from Sinopharm Chemical Reagent Co., Ltd. After stirring with a magnetic mixer for 2 h, the solution was put into an induction cooker and heated to self-combustion, producing dark brown ashes. The ashes were collected and annealed at 1100 °C for 5 h in air, using a heating rate of 3 °C min−1, and subsequently furnace-cooled to room temperature. Ce0.8Sm0.2O1.9 (SDC) was used as electrode additive and was prepared using a similar sol–gel method. The combustion product was annealed at 600 °C for 2 h to form the phase-pure fluorite phase as checked by X-ray powder diffraction (see below). Powders of La0.9Sr0.1Ga0.8Mg0.2O3−δ (LSGM) and La0.6Sr0.4Co0.2Fe0.8O3−δ (LSCF), both from Fuel Cell Materials, USA, were used without any further treatment.
Characterization methods
The phase purity of powders was checked by X-ray diffraction using a Rigaku D/Max 2100 diffractometer with Cu-Kα radiation (λ = 1.5418 Å). XRD patterns were recorded in the range 20–80° with a step size of 0.02° and a scan speed of 1° min−1 at 40 kV and 200 mA. The GSAS software package with the EXPGUI interface was used for Rietveld analysis.26 The JSM-6700F (JEOL GmbH, Germany) scanning electron microscope (SEM) was used for microstructural investigations. X-ray photoelectron spectroscopy (XPS) analysis on powder samples was conducted using a Kratos Analytical AXIS 165 with a monochromatic Al-Kα source for determination of the oxidation states. Measurements were performed on as-synthesized SFMM0.1 powder and that obtained after ex situ reduction at 850 °C in flowing 5% H2/Ar (30 ml min−1) for 12 h. The reduced powder was furnace-cooled to room temperature after which the gas flow was stopped. Care was taken to avoid re-oxidation of the sample (enclosed in a plastic sealed bag) during transfer to the XPS apparatus. Temperature-programmed desorption (TPD) was examined from 25 °C to 900 °C at 10 °C min−1 in Ar (30 ml min−1), using a Thermo-Finnigan TPDRO 1100 (Thermo Scientific, USA). Powder samples were pre-treated in pure CO2 at 200 °C for 30 min. The TPD signal was normalized to the surface area of the sample. Brunauer–Emmett–Teller (BET) surface area measurements were performed on a 3H-3000A system (Beishide instrument S&T Co., Ltd, China) using nitrogen as probe gas at 77 K. Prior to measurements the samples were degassed under vacuum at 150 °C. Raman measurements were performed on a Renishaw inVia reflex Raman spectrometer (Renishaw plc, Wotton-under-Edge, UK).Electrical conductivity and electrical conductivity relaxation measurements
Dense SFM and SFMM0.1 bars were prepared for electrical conductivity and electrical conductivity relaxation (ECR) measurements. To this end, the corresponding powder was mixed with 4 drops of a dispersed PVA solution per gram of powder and milled for 2 h. The infiltrated powder was uniaxially pressed into a rectangular bar under 300 MPa, and subsequently sintered at 1400 °C in air for 5 h to dimensions of ∼20 × 4.8 × 0.5 mm3. The relative density was in excess of 99.6% as measured by Archimedes' method. Conductivity measurements were performed in the temperature range 700–850 °C, using a dc four-probe technique (Keithley, 2001-785D). Silver wires were used as probes, and silver gel (DAD87, Shanghai Institute of Synthetic Resin) was used to improve the contacts between the wires and the sample. The temperature was changed stepwise with intervals of 50 °C, using heating and cooling rates of 5 °C min−1. The sample was held at each temperature for 10 h to ensure full equilibration with the ambient before data acquisition. For ECR measurements, the transient conductivity was measured following switching of the gas stream from 66.7% CO/CO2 to 50% CO/CO2 at 200 ml min−1 (STP). The gas switching was achieved in less than 1 s. All gases were purchased from Nanjing special gas factory Co., Ltd. The transient conductivity was normalized and fit to the appropriate solution of Fick's second law to obtain the surface exchange coefficient (kchem) and the chemical diffusion coefficient (Dchem). Detailed descriptions of the ECR technique and the model used for data fitting are given elsewhere.27Electrochemical measurements
Electrolyte-supported symmetrical cells and full solid oxide electrolysis cells were prepared to test the performance of electrodes. Pure SFMM0.1 powder or SFMM0.1-SDC mixed powders (weight ratio SFMM0.1![[thin space (1/6-em)]](https://www.rsc.org/images/entities/char_2009.gif) :
:![[thin space (1/6-em)]](https://www.rsc.org/images/entities/char_2009.gif) SDC = 6
SDC = 6![[thin space (1/6-em)]](https://www.rsc.org/images/entities/char_2009.gif) :
:![[thin space (1/6-em)]](https://www.rsc.org/images/entities/char_2009.gif) 4) were grounded for 1 h and dispersed in a solution of ethyl cellulose in α-terpineol. The obtained electrode ink was screen-printed 3 times with intermediate drying at 90 °C for 2 h onto a 400 μm thick LSGM electrolyte disc (of 9 mm in diameter), followed by calcination at 1000 °C for 2 h under stagnant air to form a 10–12 μm thick porous electrode (with effective area of 0.91 cm2).
4) were grounded for 1 h and dispersed in a solution of ethyl cellulose in α-terpineol. The obtained electrode ink was screen-printed 3 times with intermediate drying at 90 °C for 2 h onto a 400 μm thick LSGM electrolyte disc (of 9 mm in diameter), followed by calcination at 1000 °C for 2 h under stagnant air to form a 10–12 μm thick porous electrode (with effective area of 0.91 cm2).
For symmetrical cells, two identical electrodes were screen-printed on both sides of the electrolyte disc. The symmetrical cells were employed to measure the polarization resistance of the SFMM0.1 and SFMM0.1-SDC electrodes in 50% CO/CO2. For the solid oxide electrolysis cells, LSCF-SDC and SFMM0.1-SDC composites were screen printed on opposite sides of the electrolyte disc, as oxygen and fuel electrode, respectively. The ink for the oxygen electrode was prepared in a similar way as described above. The cell was sealed to one end of an alumina tube, using silver paste, calcined at 800 °C for 2 h in stagnant air, and then the cathode exposed immediately to flowing CO2 (30 ml min−1). Silver mesh current collectors were attached to each electrode using silver paste for both the symmetrical-cell and the solid-oxide-electrolysis-cell tests. The schematics of the electrochemical cell and experimental set-up used for CO2 electrolysis tests is shown in Fig. S1.†
The electrochemical tests were performed in the temperature range 700 °C–850 °C. The impedance of the symmetrical cells was measured using a Solartron 1260 impedance/gain phase analyzer in the range of frequencies from 0.01 Hz to 1 MHz under open circuit conditions and at an excitation voltage of 10 mV. Polarization curves (linear sweep rate of 0.1 V s−1 from 0 to 1.6 V) and impedance of the solid oxide electrolysis cells were measured using a Princeton electrochemical workstation (VMC-4 multichannel). The impedance spectra were fitted to an equivalent circuit using ZView® software (Scribner, Associates Inc., USA). The spectra obtained for the symmetrical cells were further analyzed by the distribution of relaxation times (DRT) method using a home-made software program. The program employs Tikhonov regularization to enable the DRT deconvolution.
Computational methods
Density functional theory (DFT) calculations were carried out using the Vienna ab initio simulation package (VASP).28,29 The generalized gradient approximation (GGA) with the Perdew–Burke–Ernzerhof (PBE) functional was adopted to approximate the exchange-correlation term.30 The projector augmented wave (PAW) method with C (1s22s22p2), O (1s22s22p4), Mn ([Ar]3d54s2), Fe ([Ar]3d64s2), Sr ([Kr]5s2), and Mo ([Kr]4d55s1) was used to describe the interaction between the ionic core and valence electrons. Following previous DFT studies on SFM,31,32 the exchange correlation energy of the 3d electrons was calculated within the generalized gradient approximation (GGA) with an Ueff parameter of 4 eV for Mn and Fe, and with no Ueff parameter for Mo. The kinetic energy cutoff was 520 eV, and the energy convergence criterium was set to 10−5 eV. Structure optimization was carried out until the forces on each atom were less than 0.03 eV Å−1. All the calculations were spin-polarized and ferromagnetic states were used.Calculations were performed on the basis of the 40 atoms-containing (Sr8Fe6Mo2O24) unit cell of the double perovskite structure of Sr2Fe1.5Mo0.5O6 represented in space group Fm![[3 with combining macron]](https://www.rsc.org/images/entities/char_0033_0304.gif) m. A 6 × 6 × 6 Monkhorst–Pack34k-point grid was used to sample the Brillouin zone. For Mn-doped SFM, one Fe atom was substituted by Mn in the optimized cell, leading to Sr2Fe1.5−xMnxMo0.5O6 with x = 0.25 (SFMM0.25), as shown in Fig. 1. Oxygen vacancies were modeled by removing a single neutral oxygen from the unit cell, leading to Sr2Fe1.5−xMnxMo0.5O6−δ with δ = 0.25. The oxygen formation energy was calculated according to
m. A 6 × 6 × 6 Monkhorst–Pack34k-point grid was used to sample the Brillouin zone. For Mn-doped SFM, one Fe atom was substituted by Mn in the optimized cell, leading to Sr2Fe1.5−xMnxMo0.5O6 with x = 0.25 (SFMM0.25), as shown in Fig. 1. Oxygen vacancies were modeled by removing a single neutral oxygen from the unit cell, leading to Sr2Fe1.5−xMnxMo0.5O6−δ with δ = 0.25. The oxygen formation energy was calculated according to
 | (1) |
 is the energy of a free O2 molecule. The projected densities of states (PDOS) were obtained as output of the VASP code. Atomic charges were calculated using the Bader approach. The minimum energy path (MEP) of oxygen migration and the energy of the transition state (TS) were computed using the climbing image nudged elastic band (CINEB) method.35 A total of 5 intermediate images was created with the forces minimized to 0.03 eV Å−1.
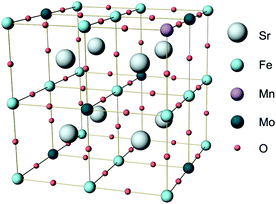 | ||
| Fig. 1 Unit cell of Sr2Fe1.5Mo0.5O6 (SFM) in which one Fe atom is substituted by Mn to produce Sr2Fe1.25Mn0.25Mo0.5O6 (SFMM0.25). | ||
We used eight-layer SFM(001) and SFMM0.25(001) slabs, separated by 15 Å of vacuum, to investigate the interaction between CO2 and their (001) surfaces with different surface terminations. The bottom four layers were fixed at their bulk position, while the top four layers were relaxed. A dipole correction was applied to the direction normal to the surface, while the Brillouin zone center was sampled at the gamma point with a 3 × 3 × 1 k-point grid. The adsorption energy of a single CO2 molecule was computed according to
| Eads = ECO2/(001) − E(001) − E(CO2) | (2) |
Results and discussions
Phase analysis, structural and chemical stability
Fig. S2† shows room temperature X-ray diffraction patterns of samples Sr2Fe1.5−xMnxMo0.5O6−δ (SFMMx, x = 0, 0.1, 0.2, 0.3, 0.4, 0.5). Consistent with previous work SFM (x = 0) is found to adopt a cubic structure (space group Fm![[3 with combining macron]](https://www.rsc.org/images/entities/char_0033_0304.gif) m). The XRD patterns of the Mn-doped samples resemble those of undoped SFM (x = 0), demonstrating that the former compositions adopt a structure similar to that of the parent phase. No shifts in the diffraction peaks are observed upon substitution of Fe by Mn, which may be accounted for by the very similar radii of Fe3+ and Mn3+ ions.36 However, some extra weak reflections are found in the patterns of samples with x = 0.3, 0.4 and 0.5. Their presence is assigned to SrMoO4 impurity phase. Previous research has revealed that SFM forms a solid solution up to composition Sr2Fe1.34Mo0.58O6−δ after annealing in air.37 Higher concentrations of Mo result in second phase formation of SrMoO4. It is argued here that dissolution of additional Mn in the structure lowers the solid solubility of Mo. More research is needed to clarify this. To avoid any phase coexistence, SFMM0.1 was selected for further investigations in this study.
m). The XRD patterns of the Mn-doped samples resemble those of undoped SFM (x = 0), demonstrating that the former compositions adopt a structure similar to that of the parent phase. No shifts in the diffraction peaks are observed upon substitution of Fe by Mn, which may be accounted for by the very similar radii of Fe3+ and Mn3+ ions.36 However, some extra weak reflections are found in the patterns of samples with x = 0.3, 0.4 and 0.5. Their presence is assigned to SrMoO4 impurity phase. Previous research has revealed that SFM forms a solid solution up to composition Sr2Fe1.34Mo0.58O6−δ after annealing in air.37 Higher concentrations of Mo result in second phase formation of SrMoO4. It is argued here that dissolution of additional Mn in the structure lowers the solid solubility of Mo. More research is needed to clarify this. To avoid any phase coexistence, SFMM0.1 was selected for further investigations in this study.
The structural stability of SFMM0.1 was tested by firing in 5% H2/Ar at 850 °C for 12 h. Rietveld refinements of the XRD patterns (Fig. 2) show that the perovskite structure is retained after firing and no extra peaks are observed. Lattice parameters and reliability factors obtained from Rietveld refinements of the patterns obtained after firing in air or 5% H2/Ar are shown in Table S1.† The cubic lattice parameter of as-synthesized SFMM0.1 slightly increases from 7.84176(4) Å to 7.86728(4) Å after firing under reducing conditions. This increase correlates with a lowering in the average oxidation state of the B-site cations (Fe, Mo, Mn) in SFMM0.1 and, hence, with an apparent increase in the concentration of oxygen vacancies.
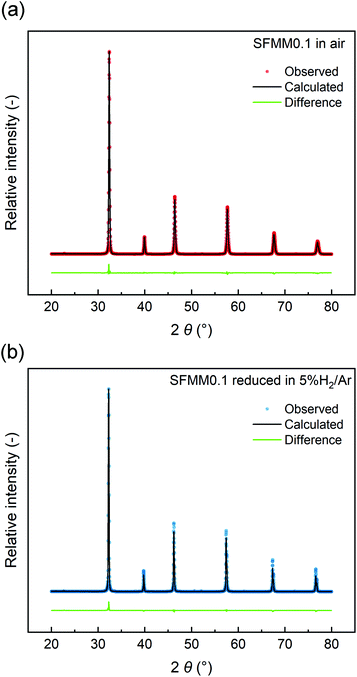 | ||
| Fig. 2 Rietveld refinements of room temperature X-ray powder diffraction patterns of SFMM0.1: (a) as-synthesized in air at 1100 °C, and (b) after firing in 5% H2/Ar at 850 °C. | ||
Fig. 3a shows XPS spectra for the B site elements in as-synthesized SFMM0.1. The Fe 2p3/2 peak can be deconvoluted into three constituents, corresponding to Fe2+, Fe3+ and Fe4+, while the Mo 3d5/2 peak can be deconvoluted into Mo5+ and Mo6+ peaks.38 Compared with pure SFM,13 Mn-doping reduces the average oxidation state of Fe from +3.16 to +3.04, while the value of 6.00 for Mo remains unaffected. The Mn 2p3/2 peak can be deconvoluted into Mn2+, Mn3+ and Mn4+ peaks centered at 641.8 eV, 643.1 eV and 643.5 eV, respectively,38,39 yielding an average oxidation state for Mn of +2.70. The XPS results thus confirm that the average oxidation state of the B site cations in as-synthesized SFM is reduced from +3.87 to +3.76 in SFMM0.1. Upon treatment of SFMM0.1 in 5% H2/Ar (Fig. 3b), the average oxidation states of Mn, Fe and Mo reduce from +2.7 to +2.27, from +3.04 to +2.92 and from +6.0 to +5.9, respectively (see Table S2†), demonstrating the high redox activity of the Mn dopant. The average oxidation state of the B site cations in reduced SFMM0.1 is calculated to be +3.63. Experimental and deconvoluted O 1s XPS spectra for as-synthesized SFMM0.1 at 1100 °C in air and after reduction at 850 °C in 5% H2/Ar are given in Fig. S3.†
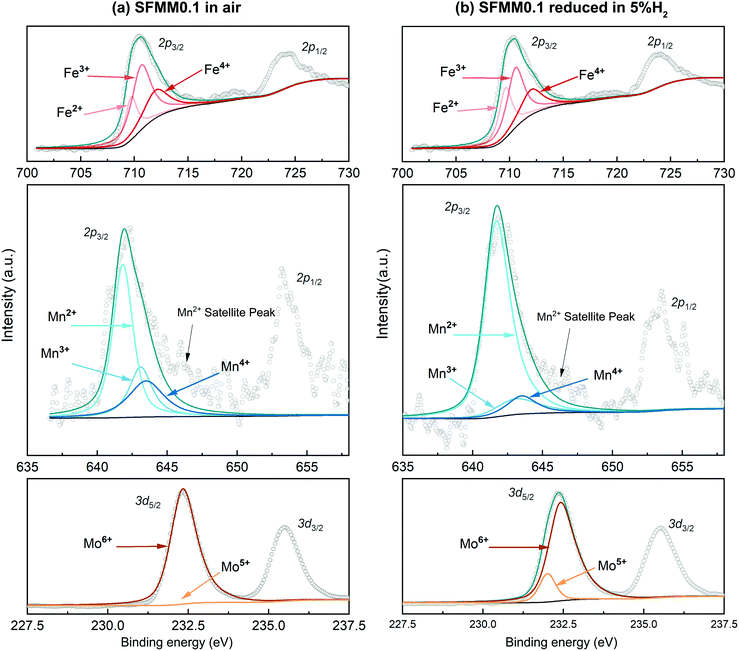 | ||
| Fig. 3 Experimental and deconvoluted Fe 2p2/3, Mn 2p2/3 and Mo 3d5/2 XPS spectra for SFMM0.1 (a) as-synthesized at 1100 °C in air, and (b) after reduction at 850 °C in 5% H2/Ar. | ||
To analyze the influence of vacancy formation on oxidation states, we computed effective Bader charges of the atoms in SFMM0.1 before and after creation of an oxygen vacancy, which gives a semi-quantitative picture of the redistribution of the electron density upon removal of oxygen. Corresponding results are listed in Table S3.† The Bader charges of the redox active ions are +1.69 e for Fe and +1.86 e for Mn, both of which are much lower than the corresponding values derived from data of XPS, suggesting a significant degree of covalency in the Fe–O and Mn–O bonds.40 After removal of neutral oxygen, the redistribution of the electrons leads to Bader charges of +1.62 e for Fe and +1.67 e for Mn. The obtained results demonstrate the high redox ability of the Mn dopant relative to that of atoms of the host lattice.
Finally, the chemical stability of SFMM0.1 powder in CO2 atmosphere was checked. XRD analysis revealed no phase change after exposure to pure CO2 at 850 °C for 12 h.
Electrical conductivity
Electronic transport in SFM occurs by a small polaron hopping mechanism and proceeds via percolation pathways along the Fe–O–Fe bonding network in the crystal. As shown in Fig. S4,† the conductivity of SFM in air reaches a value of about 20 S cm−1 at 800 °C. With the addition of Mn the conductivity at this temperature decreases to 16 S cm−1, suggesting that under oxidizing conditions the concentration of p-type charge carriers is slightly reduced by the doping with Mn. Arrhenius plots of the electrical conductivities of SFM and SFMM0.1 in both 5% H2/Ar and 50% CO/CO2 are shown in Fig. 4, clarifying that under the prospective operating conditions of CO2 electrolysis the conductivity of SFM is enhanced upon doping with Mn. The conductivity found for SFM in 5% H2/Ar, 16 S cm−1 at 800 °C, is in good agreement with previous results,41 increasing to a value of 25 S cm−1 for SFMM0.1. The higher conductivity exhibited by both materials in the more reducing atmosphere, i.e., in 5% H2/Ar relative to that in 50% CO/CO2, occurs on account of the predominant n-type conductivity under reducing conditions. Introducing Mn and/or oxygen non-stoichiometry in SFM may trigger fluctuations in the electronic band structure. Previous PDOS calculations on SFM showed that the Fe 3d and O 2p states are strongly hybridized, accounting for the high electronic conductivity of SFM and other Fe-rich perovskites.40,42 Our calculations show that hybridization around the Fermi level is preserved in perfect (δ = 0) and oxygen-defective (δ = 0.25) SFMM0.25.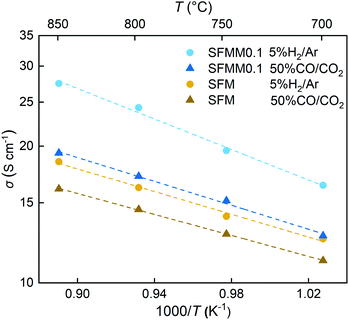 | ||
| Fig. 4 Arrhenius plots of the total electrical conductivity of SFM and SFMM0.1 in 5% H2/Ar and 50% CO/CO2. | ||
Electrical conductivity relaxation
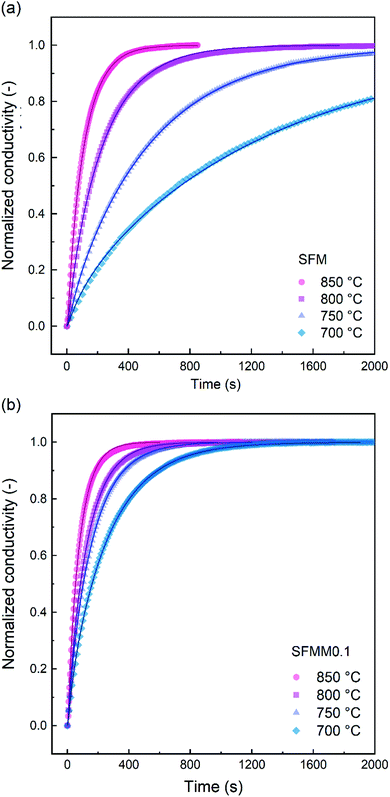
ECR experiments on SFM and SFMM0.1 ceramics were conducted to determine the influence of partial substitution on oxygen diffusion and the material's CO2 reduction ability. Normalized conductivity curves for both samples acquired at different temperatures following switching of the gas stream from 66.7% CO/CO2 to 50% CO/CO2 are shown in Fig. 5. Relative to that for SFM, faster re-equilibration kinetics is found for SFMM0.1. This difference in re-equilibration time scales is more pronounced at lower temperatures. The solid lines in Fig. 5 are from curve fitting of the data to model equations, revealing that under the conditions of the experiments the relaxation behavior of both samples is under mixed control of bulk diffusion and surface exchange. Arrhenius plots of Dchem and kchem are shown in Fig. 6, which makes evident that below about 850 °C partial substitution of Fe with Mn in SFM increases the magnitude of both parameters. At 700 °C, the increase of both parameters relative to the values observed for pure SFM is about 3–4 times. Further note from Fig. 6a and b that substitution leads to a profound decrease in the apparent activation energies of both parameters Dchem and kchem. Secondary electron SEM images of SFM and SFMM0.1 recorded after the ECR experiments are shown in Fig. S5.† Comparison with SEM images taken before the experiments (not shown) indicated no apparent changes in the morphology of both samples.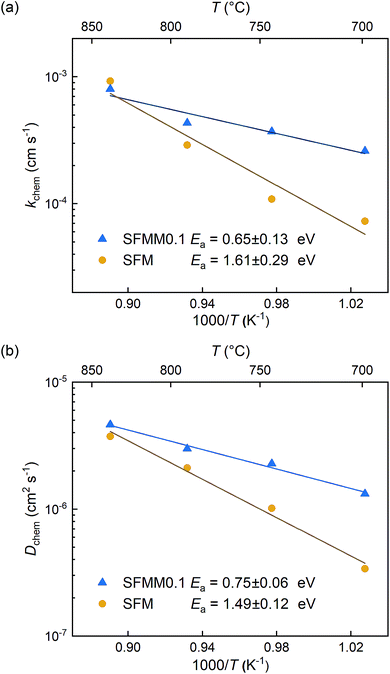 | ||
| Fig. 6 Arrhenius plots of (a) kchem and (b) Dchem for SFM and SFMM0.1. Error bars are within the used symbols. | ||
Oxygen migration
A high concentration of oxygen vacancies in SFM and Mn-doped SFM facilitates transport of O2− ions via a vacancy diffusion mechanism. Another factor that dominates the O2− diffusivity is the migration barrier (Emigr) associated with hopping along the diffusion path to the nearest-neighbor vacancy. Our CINEB calculations predict the formation energy of oxygen vacancies, Ev(Fe–VO–Fe), corresponding with the removal of oxygen in Fe–O–Fe bonds, in both structures to be the lowest compared with values for formation of oxygen vacancies between dissimilar metal atoms. For SFMM0.25 it is found that Ev(Fe–VO–Fe) is 0.17 eV, while Ev(Fe–VO–Mo) and Ev(Fe–VO–Mn) are 1.32 eV and 0.36 eV, respectively. The higher values for the latter two may be expected on the basis of the weaker Fe–O bond compared to Mn–O and Mo–O bonds. The value obtained for Ev(Fe–VO–Fe) in SFM is 0.13 eV, which is notably lower than that for SFMM0.25, indicates that beyond breaking of the two Fe–O bonds the formation of an oxygen vacancy is also affected by the local surroundings. On account of the low values of Ev(Fe–VO–Fe) in SFM and SFMM0.25, we envision that O2− transport in both structures is dominated by hopping between adjacent (Fe–O–Fe) sites and (Fe–VO–Fe) sites such migration involves passage over a saddle point on the potential energy surface and, consequently, the O2− ion will follow a curved path as schematically depicted in Fig. 7a. The MEPs obtained by our CINEB calculations (Fig. 7b) show that Emigr reduces from 0.36 eV in SFM to a value as low as 0.15 eV in SFMM0.25. For the activation energy of oxygen self-diffusion, which is given by the sum of Ev(Fe–VO–Fe) and Emigr, we thus find values of 0.49 eV and 0.32 eV for SFM and SFMM0.25, respectively. The calculations were carried out for δ = 0.25. Though it cannot be excluded that higher migration enthalpies are obtained for lower, probably more realistic oxygen deficiencies, the results clearly indicate that the presence of Mn lowers the migration energy despite the migration path being near the Fe atoms, corroborating with the results from ECR experiments.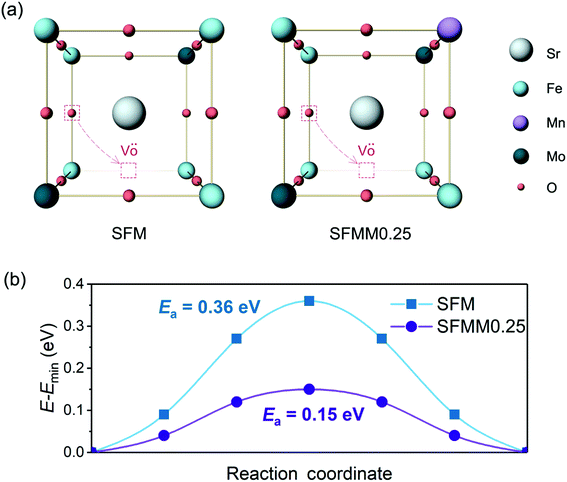 | ||
| Fig. 7 (a) Schematic presentation of oxygen ion migration pathways in SFM and SFMM0.25, and (b) corresponding minimum energy profiles. | ||
CO2 adsorption
Theoretical calculations were carried out to study the interaction of CO2 with the SFM and SFMM0.25 surfaces. Primary calculations on SFM showed the SrO (100) termination to be the most stable surface. To study the influence of Mn-doping on CO2 adsorption, however, we focused our calculations on the (Fe, Mn, Mo) O2-terminated surface. We first calculate the CO2 adsorption energies on the perfect (i.e., non-defective) surfaces, and then proceed with considering the effect of an oxygen vacancy created next to the adsorption site. CO2 adsorption energies, C–O bond lengths and O–C–O angles calculated for different adsorbed CO2 configurations are listed in Table S4.†CO2 chemisorbs atop surface oxygen atoms. Chemisorption involves charge transfer to the adsorbed CO2 molecule (and bending of the initially linear CO2 molecule due to electron transfer to the antibonding π* orbitals of CO2) with as a result more negative adsorption energies compared to physisorption. Different oxygen sites are available on the (100) surfaces of SFM and SFMM0.25. These are the Fe–O–Fe and Fe–O–Mo sites on the (Fe, Mo) O2-terminated (100) surface of SFM, with respective adsorption energies of −0.98 eV and −0.91 eV. On the (Fe, Mn, Mo) O2-terminated (100) surface of SFMM0.25 these are the Fe–O–Mn and Fe–O–Mo sites with respective adsorption energies of −1.00 eV and −1.11 eV. Hence, CO2 adsorbs preferentially atop the oxygen atom with the lowest oxygen vacancy formation energy. The calculations further show that the CO2 molecule adsorbs as a monodentate surface carbonate (CO32−) species as illustrated for adsorption on preferential oxygen sites on both surfaces in Fig. 8a and c. For both SFM and SFMM0.1, it is found that the O–C–O angles are bent to about 131°, and that the C–O bond lengths are elongated to values close to 1.27 Å, relative to the gaseous values of 180° and 1.18 Å, respectively. The ideal carbonate ion has trigonal planar symmetry with C–O bond lengths of about 1.28 Å.12 The surface carbonate ion is considered to be an important intermediate for activation and reduction of CO2.12
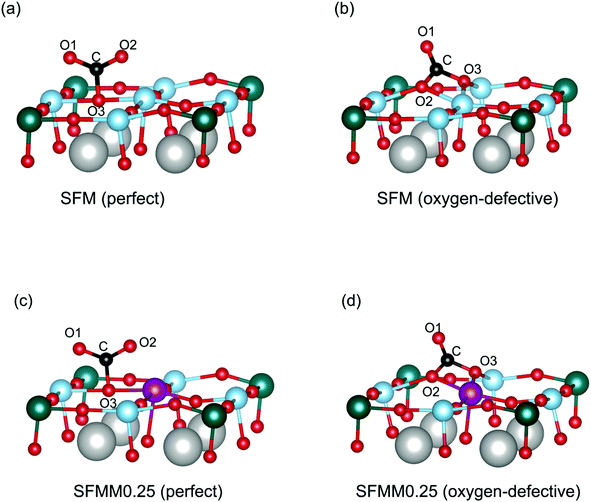 | ||
| Fig. 8 Different adsorption configurations of CO2 on the (a) perfect and (b) oxygen-defective (Fe, Mo)O2-terminated (100) surface of SFM, and the (c) perfect and (d) oxygen-defective (Fe, Mn, Mo) O2-terminated (100) surface of SFMM0.25. Only part of the unit cell (Fig. 1) used in the calculations is shown. Oxygen vacancies are created at the Fe–O–Fe site for SFM, and at the Fe–O–Mn site for SFMM0.25, corresponding with the lowest formation energies (see main text). Iron is blue, manganese is purple, molybdenum is green, oxygen is red, and carbon is black. O1 and O2 are oxygen atoms from the CO2 molecule, and O3 stems from the oxide lattice. Calculated C–O bond lengths, O–C–O angles, and CO2 adsorption energies are listed in Table S4 in the ESI.† | ||
Next, the effect of a nearest-neighbor oxygen vacancies on CO2 adsorption is considered. A different configuration for CO2 emerges compared with that found upon adsorption on the vacancy-free (100) surfaces as the CO2 molecule now forms a bidentate carbonate configuration with one of the C–O bonds strongly elongated to about 1.31 Å (See Table S4†). The bidentate configuration results in a more negative adsorption energy relative to that of the monodentate configuration found on the vacancy-free surface. For SFM the adsorption energy is lowered from −0.98 eV to −1.23 eV, while for SFMM0.1 it is lowered from −1.11 eV to −1.37 eV. Apart from the lower adsorption energies the distorted CO2 molecule is presumed to be highly activated. The more exothermic values of the CO2 adsorption energies found for SFMM0.25 than for SFM substantiated by the theoretical calculations indicate that partial substitution of Fe with Mn enhances CO2 adsorption. This is further corroborated by the results from temperature-programmed desorption measurements on SFM and SFMM0.1 powder samples that have been treated in pure CO2 at 200 °C for 30 min. Fig. S6† shows that much enhanced desorption is found for SFMM0.1 as compared to SFM which extends up to about 900 °C.
Electrochemical performance
Both LSGM electrolyte-supported symmetrical and full electrolysis cells were fabricated. Symmetric cells were employed to measure the polarization resistance (Rp) of single-phase SFMM0.1 and dual-phase SFMM0.1-SDC electrodes under reducing conditions. Fig. 9a shows corresponding impedance spectra recorded at 800 °C in 50% CO/CO2. Also included for comparison is the impedance spectrum for a symmetrical cell with SFM electrodes recorded under identical conditions from our previous study.14 The latter cell was fabricated similarly to the symmetrical cells employed in the present study. Under the specified conditions, Rp for SFM is 1.12 Ω cm2, while 0.60 Ω cm2 is found for the SFMM0.1 electrode. Corresponding values at 700 °C are 8.76 Ω cm2 and 4.36 Ω cm2 for the SFM and SFMM0.1 electrode, respectively, confirming that Rp decreases significantly with partial substitution of Fe by Mn. The electrode performance further improves for the SFMM0.1-SDC composite electrode: 0.5 Ω cm2 at 800 °C, and 0.90 Ω cm2 at 700 °C. The results from symmetrical cells are compiled in Table S5.†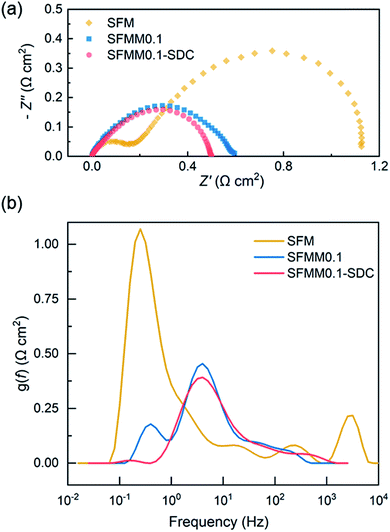 | ||
| Fig. 9 (a) Impedance spectra of electrolyte-supported symmetrical cells SFM|LSGM|SFM, SFMM0.1|LSGM|SFMM0.1 and SFMM0.1-SDC/LSGM/SFMM0.1-SDC recorded under open circuit conditions, at 800 °C, in 50% CO/CO2, and (b) corresponding results from DRT analyses of the spectra. Impedance spectra are shown after subtraction of the apparent electrolyte resistance. Data for SFM in (a) is replotted from ref. 14. | ||
A distribution of relaxation times (DRT) analysis was performed on the impedance spectra recorded at 800 °C. In a DRT plot, the location of a peak reflects a characteristic relaxation time, while the integral peak area is a measure of the polarization loss. In general, low frequency peaks are assigned to gas diffusion and surface processes such as adsorption/desorption, while high frequency peaks are linked to charge transfer and ion migration processes.42 As seen from Fig. 9b multiple peaks can be identified in the DRT curves of the spectra. The high frequency peaks are probably caused by the transformation procedure and have no direct physical meaning. Comparison of the DRT curves shows that doping of SFM with Mn notably lowers the low frequency-peak in the range 0.1–1 Hz, which we tentatively ascribe to lowering of the polarization losses due to enhanced CO2 adsorption and associated reduction kinetics consistent with the results from DFT calculations and ECR (see above sections Oxygen migration and Electrical conductivity relaxation). For the SFMM0.1-SDC composite electrode, the peak at 0.1–1 Hz has virtually vanished. Fig. S7† shows impedance spectra of the symmetrical cells recorded at different operating temperatures and corresponding DRT plots. More measurements are needed (e.g., as a function of gas phase composition, current density and electrode microstructure) to identify unambiguously the physiochemical processes in the impedance spectra and corresponding DRT plots.
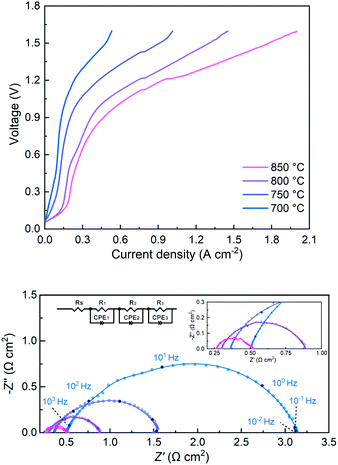
The performance of the SFMM0.1-SDC composite electrode for CO2 electrolysis was further tested in a full electrolyte-supported electrolysis cell using LSCF-SDC as oxygen electrode and LSGM as the electrolyte. Corresponding results are shown in Fig. 10a. Using pure CO2, without addition of reducing gas (e.g., H2) or pre-reduction of the electrode, the current density at an applied voltage of 1.5 V is found to increase from 0.47 A cm−2 at 700 °C to 1.80 A cm−2 at 850 °C. The I–V curves exhibit distinct non-linear behavior. This phenomenon has also been observed in other studies where perovskite-type oxides are used as electrodes for CO2 or H2O electrolysis, without pre-mixing of the feed gases with CO or H2,7,9,10,43–45 and which is in contrast to the linear I–V curves observed when Ni-YSZ based cathodes are used.
Nyquist plots of the single cell measured at OCV at different temperatures are given in Fig. 10b. The spectra can be fitted using the equivalent circuit Rs(R1Q1)(R2Q2)(R3Q3), where Rs is the apparent ohmic resistance of the electrolyte, Ri (i = 1, 2 and 3) is a resistance, and Qi (i = 1, 2 and 3) is a constant phase element. At 800 °C, the total electrode polarization resistance (Rp = R1 + R2 + R3) at OCV is 0.58 Ω cm2, noting that the LSCF-SDC anode minorly contributes to the value of Rp.12 The excellent performance of the SFMM0.1-SDC electrode is immediately apparent from Table 1, which lists current densities achieved in pure CO2 electrolysis using different electrolyte-supported cells operated at 1.5 V at 800 °C from literature. It should be noted that comparison in Table 1 is limited to SOECs incorporating all-ceramic cathodes, thereby excluding mixed metal–metal oxide electrodes such as Ni–YSZ and perovskite electrodes with exsolved metal or alloy particles. For completeness, literature performance data on the latter two types of electrodes are given in Table S6 and S7,† respectively, confirming the excellent performance of the SFMM0.1-SDC electrode for direct CO2 electrolysis. As shown in Fig. S8a,† a short-term test was conducted to test for possible coke formation. The cell was operated in the CO2 electrolysis mode at 750 °C at a current density of 0.6 A cm−2 for 50 h. SEM micrographs taken before and after the experiments are shown in Fig. S9,† confirming good adherence of the SFMM0.1-SDC electrode to the LSGM electrolyte and stability of the electrode. Inspection of the SEM images recorded after operation as well as data from Raman spectroscopy (See Fig. S8b†) confirmed that the SFMM0.1-SDC cathode remains free from coke formation.
| Fuel electrodea | Current density [A cm−2] | Reference |
|---|---|---|
| a SDC and GDC refer to Sm0.2Ce0.8O2−δ and Gd0.2Ce0.8O2−δ, respectively. | ||
| La0.75Sr0.25Cr0.5Mn0.5O3−δ-SDC | 0.075 | 7 |
| (La0.75Sr0.25)0.95(Cr0.5Mn0.5)O3−δ-GDC/YSZ | 0.26 | 8 |
| (La0.75Sr0.25)0.95(Cr0.5Mn0.5)O3−δ-GDC | 0.18 | 8 |
| La0.75Sr0.25Cr0.5Fe0.5O3−δ | 0.09 | 17 |
| La0.75Sr0.25Cr0.4Fe0.5Ti0.1O3−δ | 0.075 | 17 |
| La0.2Sr0.8Ti0.9Mn0.1O3−δ-SDC | 0.15 | 10 |
| La0.2Sr0.8Ti0.9O3−δ-SDC | 0.06 | 10 |
| La0.2Sr0.8TiO3−δ | 0.105 | 11 |
| La0.2Sr0.8Ti0.9Mn0.1O3−δ | 0.26 | 11 |
| (La0.2Sr0.8)0.95Ti0.9Mn0.1O3−δ | 0.22 | 11 |
| (La0.2Sr0.8)0.95Ti0.9Cr0.1O3−δ | 0.24 | 11 |
| (La0.2Sr0.8)0.95Ti0.85Mn0.1Ni0.05O3−δ | 0.45 | 11 |
| (La0.2Sr0.8)0.95Ti0.85Cr0.1Ni0.05O3−δ | 0.36 | 11 |
| Sr0.95Ti0.8Nb0.1Mn0.1O3−δ | 0.17 | 16 |
| Sr0.95Ti0.8Nb0.1Cr0.1O3−δ | 0.17 | 16 |
| Sr0.95Ti0.9Nb0.1O3−δ | 0.12 | 16 |
| La0.3Sr0.7Fe0.7Ti0.3O3−δ | 0.30 | 18 |
| La0.8Sr0.2FeO3−δ | 0.76 | 12 |
| La0.8Sr0.2FeO3−δ-SDC | 1.06 | 12 |
| La0.5Sr0.5FeO3−δ-GDC | 0.36 | 21 |
| La0.5Sr0.5Fe0.95V0.05O3−δ-GDC | 0.57 | 21 |
| La0.5Sr0.5Fe0.9V0.1O3−δ-GDC | 0.43 | 21 |
| La0.5Sr0.5Fe0.85V0.15O3−δ-GDC | 0.35 | 21 |
| SFM-SDC | 1.09 | 13 |
| SFMM0.1-SDC | 1.35 | This work |
Conclusions
In conclusion, an all ceramic cathode has been developed which combines a high stability with a high performance in direct CO2 electrolysis. When SFMM0.1-SDC is incorporated as cathode in an electrolyte-supported SOEC for electrolysis of pure CO2 a current density of 1.35 A cm2 is achieved at 800 °C under an applied bias of 1.5 V, without the addition of a reducing gas such as H2. The enhanced cell performance can be accounted for by data from electrical conductivity relaxation experiments and first-principle calculations, revealing that oxygen transport, CO2 adsorption and reduction kinetics are enhanced upon doping of parent SFM with Mn. The SFMM0.1-SDC composite electrode further exhibits excellent coking resistance. This work shows that SFMM0.1-SDC is a promising alternative to replace metal-based electrodes for direct CO2 electrolysis.Conflicts of interest
There are no conflicts to declare.Acknowledgements
We gratefully acknowledge financial support from the National Nature Science Foundation of China (91645101) and Anhui Estone Materials Technology Co., Ltd. (2016340022003195). H. J. M. Bouwmeester acknowledges financial support from the Dutch Technology Foundation STW in the frame work of project Power-to-Gas (project number 15325). We also acknowledge the Supercomputing Center of University of Science and Technology of China for providing computational resources.References
- Y. Zheng, W. Zhang, Y. Li, J. Chen, B. Yu, J. Wang, L. Zhang and J. Zhang, Nano Energy, 2017, 40, 512 CrossRef CAS.
- Y. Ni, G. S. Eskeland, J. Giske and J.-P. Hansen, Carbon Balance Manage., 2016, 11, 3 CrossRef PubMed.
- S. D. Ebbesen, S. H. Jensen, A. H auch and M. B. Mogensen, Chem. Rev., 2014, 114, 10697 CrossRef CAS PubMed.
- B. Hu, C. Guild and S. L. Suib, J. CO2 Util., 2013, 1, 18 CrossRef CAS.
- J. Yan, Handbook of Clean Energy Systems, 6 Volume Set, John Wiley & Sons, 2015, vol. 5 Search PubMed.
- X. Yue and J. T. S. Irvine, Electrochem. Solid-State Lett., 2012, 15, 31 CrossRef.
- S. Xu, S. Li, W. Yao, D. Dong and K. Xie, J. Power Sources, 2013, 230, 115 CrossRef CAS.
- X. Zhang, Y. Song, F. Guan, Y. Zhou, H. Lv, Q. Liu, G. Wang and X. Bao, J. Power Sources, 2018, 400, 104 CrossRef CAS.
- Y. Li, J. Zhou, D. Dong, Y. Wang, J. Z. Jiang, H. Xiang and K. Xie, Phys. Chem. Chem. Phys., 2012, 14, 15547 RSC.
- W. Qi, Y. Gan, D. Yin, Z. Li, G. Wu, K. Xie and Y. Wu, J. Mater. Chem. A, 2014, 2, 6904 RSC.
- L. Ye, M. Zhang, P. Huang, G. Guo, M. Hong, C. Li, J. T. Irvine and K. Xie, Nat. Commun., 2017, 8, 14785 CrossRef CAS PubMed.
- Y. Yang, Y. Li, Y. Jiang, M. Zheng, T. Hong, X. Wu and C. Xia, Electrochim. Acta, 2018, 284, 159 CrossRef CAS.
- Y. Li, X. Chen, Y. Yang, Y. Jiang and C. Xia, ACS Sustainable Chem. Eng., 2017, 5(12), 11403 CrossRef CAS.
- Y. Li, B. Hu, C. Xia, W. Q. Xu, J. P. Lemmon and F. Chen, J. Mater. Chem. A, 2017, 5, 20833 RSC.
- Y. Li, Z. Zhan and C. Xia, Catal. Sci. Technol., 2018, 8, 980 RSC.
- J. Zhang, K. Xie, H. Wei, Q. Qin, W. Qi, L. Yang, C. Ruan and Y. Wu, Sci. Rep., 2014, 4, 7082 CrossRef PubMed.
- W. Yao, T. Duan, Y. Li, L. Yang and K. Xie, New J. Chem., 2015, 39, 2956 RSC.
- Z. Cao, B. Wei, J. Miao, Z. Wang, Z. Lu, W. Li, Y. Zhang, X. Huang, X. Zhu, Q. Feng and Y. Sui, Electrochem. Commun., 2016, 69, 80 CrossRef CAS.
- Y. Q. Zhang, J. H. Li, Y. F. Sun, B. Hua and J. L. Luo, ACS Appl. Mater. Interfaces, 2016, 8, 6457 CrossRef CAS PubMed.
- M. Zheng, S. Wang, Y. Yang and C. Xia, J. Mater. Chem. A, 2018, 6, 2721 CAS.
- Y. Zhou, Z. Zhou, Y. Song, X. Zhang, F. Guan, H. Lv, Q. Liu, S. Miao, G. Wang and X. Bao, Nano Energy, 2018, 50, 43 CAS.
- S. Wang, H. Tsuruta, M. Asanuma and T. Ishihara, Adv. Energy Mater., 2015, 5, 1401003 CrossRef.
- Y. Tian, H. Zheng, L. Zhang, B. Chi, J. Pu and J. Li, J. Electrochem. Soc., 2018, 165, F17 CrossRef CAS.
- S. Liu, Q. Liu and J.-L. Luo, J. Mater. Chem. A, 2016, 4, 17521 RSC.
- Y. Tian, L. Zhang, Y. Liu, L. Jia, J. Yang, C. Bo, J. Pu and J. Li, J. Mater. Chem. A, 2019, 7, 6395 RSC.
- A. C. Larson and R. B. Von Dreele, Report LAUR, 1994, vol. 86 Search PubMed.
- I. Yasuda and M. Hishinuma, Solid State Ionics, 1995, 80, 141 CrossRef CAS.
- P. E. Blöchl, Phys. Rev. B, 1994, 50, 17953 CrossRef PubMed.
- G. Kresse and J. Furthmüller, Comput. Mater. Sci., 1996, 6, 15 CrossRef CAS.
- J. P. Perdew, K. Burke and M. Ernzerhof, Phys. Rev. Lett., 1996, 77, 3865 CrossRef CAS PubMed.
- A. B. Muñoz-García and M. Pavone, Int. J. Quantum Chem., 2016, 116, 1501 CrossRef.
- E. Walker, S. C. Ammal, S. Suthirakun, F. Chen, G. A. Terejanu and A. Heyden, J. Phys. Chem. C, 2014, 118, 23545 CrossRef CAS.
- S. Suthirakun, S. C. Ammal, A. B. Munoz-Garcia, G. Xiao, F. Chen, H. C. zur Loye, E. A. Carter and A. Heyden, J. Am. Chem. Soc., 2014, 136, 8374 CrossRef CAS PubMed.
- H. J. Monkhorst and J. D. Pack, Phys. Rev. B, 1976, 13, 5188 CrossRef.
- G. Henkelman, B. P. Uberuaga and H. Jónsson, J. Chem. Phys., 2000, 113, 9901 CrossRef CAS.
- R. D. Shannon, Acta Crystallogr., Sect. A: Cryst. Phys., Diffr., Theor. Gen. Crystallogr., 1976, 32, 751 CrossRef.
- J. Rager, M. Zipperle, A. Sharma and J. MacManus-Driscoll, J. Am. Ceram. Soc., 2004, 87, 1330 CrossRef CAS.
- M. C. Biesinger, B. P. Payne, A. P. Grosvenor, L. W. M. Lau, A. R. Gerson and R. S. C. Smart, Appl. Surf. Sci., 2011, 257, 2717 CrossRef CAS.
- E. Beyreuther, S. Grafström, L. M. Eng, C. Thiele and K. Dörr, Phys. Rev. B, 2006, 73, 155425 CrossRef.
- A. B. Munoz-Garcia, M. Pavone, A. M. Ritzmann and E. A. Carter, Phys. Chem. Chem. Phys., 2013, 15, 6250 RSC.
- G. Xiao, Q. Liu, S. Nuansaeng and F. Chen, ECS Trans., 2012, 45, 355 CrossRef CAS.
- A. B. Muñoz-García, D. E. Bugaris, M. Pavone, J. P. Hodges, A. Huq, F. Chen, H.-C. zur Loye and E. A. Carter, J. Am. Chem. Soc., 2012, 134, 6826 CrossRef PubMed.
- Y. Li, K. Xie, S. Chen, H. Li, Y. Zhang and Y. Wu, Electrochim. Acta, 2015, 153, 325 CrossRef CAS.
- H. Li, G. Sun, K. Xie, W. Qi, Q. Qin, H. Wei, S. Chen, Y. Wang, Y. Zhang and Y. Wu, Int. J. Hydrogen Energy, 2014, 39, 20888 CrossRef CAS.
- K. Xie, Y. Zhang, G. Meng and J. T. S. Irvine, Energy Environ. Sci., 2011, 4, 2218 RSC.
Footnote |
| † Electronic supplementary information (ESI) available. See DOI: 10.1039/c9ta07689a |
| This journal is © The Royal Society of Chemistry 2019 |

