 Open Access Article
High performance cation exchange membranes synthesized via in situ emulsion polymerization without organic solvents and corrosive acids†‡
Shanxue
Jiang
 a and
Bradley P.
Ladewig
 *ab
*ab
aBarrer Centre, Department of Chemical Engineering, Imperial College London, London SW7 2AZ, UK. E-mail: b.ladewig@imperial.ac.uk
bInstitute of Micro Process Technology, Karlsruhe Institute of Technology, Hermann-von-Helmholtz-Platz 1, D-76344 Eggenstein-Leopoldshafen, Germany
First published on 26th June 2019
Abstract
The synthesis of cation exchange membranes (CEMs) usually involves using organic solvents and/or a sulfonation process. In this study, green and scalable synthesis of high performance CEMs is achieved without organic solvents and sulfonation. The synthesis is carried out via in situ polymerization of lithium styrene sulfonate in a porous support. Different preparation procedures are developed and optimized. Functional sulfonate groups are successfully loaded onto and into the membrane support, as verified by FTIR. Besides, water plays an important role in membrane synthesis. By reducing the amount of water used, the ratio of functional polymers to the membrane support in the synthesized CEMs is increased. Therefore, the synthesized CEMs show increased ion exchange capacity (IEC). This is significant because it means that high IEC can be achieved without introducing cation exchange resins into the membranes. Finally, the synthesized membranes demonstrate high desalination performance. This new methodology may shed new light on preparing CEMs in an efficient and eco-friendly way.
Introduction
Ion exchange membranes (IEMs) have been undergoing prosperous development in recent years.1–5 A recent statistical study reveals that over 20![[thin space (1/6-em)]](https://www.rsc.org/images/entities/char_2009.gif) 000 research papers relating to IEMs have been published since 2001.6 IEMs are widely used in many applications, including but not limited to fuel cells,7–10 electrodialysis,11–13 and reverse electrodialysis.14–16 Generally, IEMs are classified into two categories: cation exchange membranes (CEMs) and anion exchange membranes (AEMs).17–19 In order to meet the growing requirements for IEMs, many synthesis methods have been developed.20–24 Among these methods, solution casting is a very popular one. This method involves casting a polymer solution onto a film, followed by phase inversion to remove the solvent and get solid membranes.25–28 However, there are several disadvantages of using this method. Firstly, harmful organic solvents such as dimethylformamide (DMF) and dimethylacetamide (DMAc) are often used in this method, and therefore post-disposal of these solvents is inevitable. Secondly, when ion exchange resins are added to the solution, additional procedures such as sonication are usually necessary so as to disperse the resins uniformly and to avoid aggregation of resins. Also, the amount of resins that can be added is usually limited. As a result, the ion exchange capacity (IEC) of the prepared membranes will be affected. Thirdly, the mechanical properties of the membranes are usually not robust and the membranes can be easily broken if bent. Another common method for preparing IEMs with different properties is radiation induced grafting.29–31 However, with this method, high-energy radiation is usually indispensable. In addition, organic solvents are usually required. Furthermore, in some procedures, strong acids are used to introduce functional groups. The sol–gel method is an emerging method to introduce inorganic particles into organic polymers.32,33 However, it is difficult to control the dispersion of inorganic particles, and therefore the membrane performance will be compromised. This method also inherits the issues and challenges of the solution casting method.
000 research papers relating to IEMs have been published since 2001.6 IEMs are widely used in many applications, including but not limited to fuel cells,7–10 electrodialysis,11–13 and reverse electrodialysis.14–16 Generally, IEMs are classified into two categories: cation exchange membranes (CEMs) and anion exchange membranes (AEMs).17–19 In order to meet the growing requirements for IEMs, many synthesis methods have been developed.20–24 Among these methods, solution casting is a very popular one. This method involves casting a polymer solution onto a film, followed by phase inversion to remove the solvent and get solid membranes.25–28 However, there are several disadvantages of using this method. Firstly, harmful organic solvents such as dimethylformamide (DMF) and dimethylacetamide (DMAc) are often used in this method, and therefore post-disposal of these solvents is inevitable. Secondly, when ion exchange resins are added to the solution, additional procedures such as sonication are usually necessary so as to disperse the resins uniformly and to avoid aggregation of resins. Also, the amount of resins that can be added is usually limited. As a result, the ion exchange capacity (IEC) of the prepared membranes will be affected. Thirdly, the mechanical properties of the membranes are usually not robust and the membranes can be easily broken if bent. Another common method for preparing IEMs with different properties is radiation induced grafting.29–31 However, with this method, high-energy radiation is usually indispensable. In addition, organic solvents are usually required. Furthermore, in some procedures, strong acids are used to introduce functional groups. The sol–gel method is an emerging method to introduce inorganic particles into organic polymers.32,33 However, it is difficult to control the dispersion of inorganic particles, and therefore the membrane performance will be compromised. This method also inherits the issues and challenges of the solution casting method.
In our previous work, CEMs with high IEC were synthesized using a porous support.34 Similar to other common polymerization methods for membrane preparation, concentrated sulfuric acid is used to introduce sulfonate groups into the membranes. Since the acid waste is harmful to the environment, sodium hydroxide is needed to neutralize the waste. A similar method which also uses porous supports is pore filling.35,36 However, with this method, organic solvents and/or sulfonation are usually needed, and therefore post-treatment of solvents and acid wastes is necessary.37,38 In addition, in some cases, in order to induce crosslinking, additional procedures such as annealing treatment are necessary.39,40
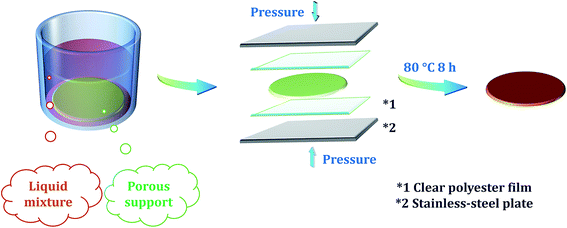
In this work, a new methodology is developed to synthesize high performance CEMs in an effective and environment-friendly way (Scheme 1). This methodology includes avoiding the use of organic solvents and strong acids, reducing the use of unnecessary chemicals, and realizing rapid synthesis via optimizing preparation procedures. To achieve the above goals simultaneously, in situ polymerization, emulsification, functional monomers, and porous supports are combined together for the first time. To be specific, a monomer containing the functional sulfonate group (e.g., lithium p-styrenesulfonate) is used so sulfonation is not needed. Also, water is used to dissolve the monomer so no organic solvents are needed. The detailed process of choosing water as the solvent is provided in Section 1 of the ESI.‡ In order to homogenize the mixture which mainly contains water, the functional monomer, and the crosslinking agent (e.g., divinylbenzene), a small amount of eco-friendly emulsifier is used. The porous support is used to absorb the liquid mixture and also to ensure the mechanical strength of the membranes. The polymerization reaction takes place within and on the porous support. This effective methodology may open up a new world of possibilities for scalable synthesis of IEMs in an eco-friendly way.
Experimental
Chemicals and materials
Lithium p-styrenesulfonate (LiSS) was provided by Tosoh Organic Chemical. Divinylbenzene (DVB), styrene, benzoyl peroxide (BPO, brand Luperox® A75), sodium chloride, phenolphthalein solution, cation exchange resin (CER, brand Amberlyst® 15 hydrogen form) and emulsifier (brand Kolliphor® EL) were supplied by Sigma Aldrich. Sodium hydroxide and hydrochloric acid were supplied by VWR International. As the porous support, non-woven fabric Novatexx 2471 was purchased from Freudenberg Filtration Technologies. As provided by the supplier, Novatexx 2471 is a thermal bonding material with a weight of 85 g m−2, thickness of 0.18 mm, air permeability of 150 L m−2 s−1 at 200 Pa, maximum tensile strength of 270 N/5 cm (machine direction) and 170 N/5 cm (cross direction), and elongation of 25% (machine direction) and 30% (cross direction) at maximum tensile strength. As the spacer for synthesis, clear and flat polyester films (model PMX727 with a thickness of 125 microns) were provided by HiFi Industrial Film.Membrane preparation
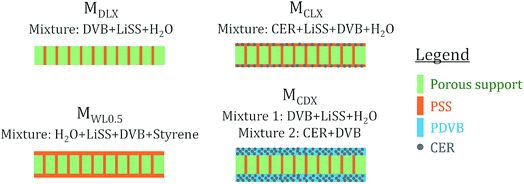
Membrane preparation procedures are demonstrated in Scheme 1. The general procedures are described as follows. Firstly, LiSS was dissolved in water. Next, a certain amount of DVB or styrene was added into the solution. Then, a small amount of emulsifier was added into the mixture to make the mixture uniform. Then, a certain amount of CER was added into the mixture. Next, a small amount of BPO was added into the mixture. Then, the porous support was immersed into the mixture to adequately absorb the mixture. Then, the support was taken out of the mixture and placed between two clear polyester films, and then the films containing the support were placed between two stainless-steel plates. Finally, the stainless-steel plates were fastened and placed in an oven to activate the polymerization process. The reaction temperature and time were set to 80 °C and 8 hours, respectively. After polymerization, the membranes were peeled off from the polyester films. As shown in Scheme 2 and Table 1, four series of membranes were prepared. For the MDLX, the subscript DLX means that the mass ratio of DVB to LiSS is X where X is a number. Different DVB/LiSS ratios (i.e., X) were studied, including 0.2, 0.4, 0.5, 0.6, 0.8, and 1.0. Meanwhile, the mass ratio of water to LiSS was kept the same, namely 1.2. For the MCDX, the subscript CDX means that the mass ratio of CER to DVB is X. Different CER/DVB ratios (i.e., X) were studied, including 0.2, 0.4 and 0.6. Meanwhile, the mass ratio of DVB![[thin space (1/6-em)]](https://www.rsc.org/images/entities/char_2009.gif) :
:![[thin space (1/6-em)]](https://www.rsc.org/images/entities/char_2009.gif) water
water![[thin space (1/6-em)]](https://www.rsc.org/images/entities/char_2009.gif) :
:![[thin space (1/6-em)]](https://www.rsc.org/images/entities/char_2009.gif) LiSS was kept the same, namely 0.6
LiSS was kept the same, namely 0.6![[thin space (1/6-em)]](https://www.rsc.org/images/entities/char_2009.gif) :
:![[thin space (1/6-em)]](https://www.rsc.org/images/entities/char_2009.gif) 1.2
1.2![[thin space (1/6-em)]](https://www.rsc.org/images/entities/char_2009.gif) :
:![[thin space (1/6-em)]](https://www.rsc.org/images/entities/char_2009.gif) 1.0. For the MCLX, the subscript CLX means that the mass ratio of CER to LiSS is X. Different CER/LiSS ratios (i.e., X) were studied, including 0.2, 0.4 and 0.6. Meanwhile, the mass ratio of DVB
1.0. For the MCLX, the subscript CLX means that the mass ratio of CER to LiSS is X. Different CER/LiSS ratios (i.e., X) were studied, including 0.2, 0.4 and 0.6. Meanwhile, the mass ratio of DVB![[thin space (1/6-em)]](https://www.rsc.org/images/entities/char_2009.gif) :
:![[thin space (1/6-em)]](https://www.rsc.org/images/entities/char_2009.gif) water
water![[thin space (1/6-em)]](https://www.rsc.org/images/entities/char_2009.gif) :
:![[thin space (1/6-em)]](https://www.rsc.org/images/entities/char_2009.gif) LiSS was kept the same, namely 0.6
LiSS was kept the same, namely 0.6![[thin space (1/6-em)]](https://www.rsc.org/images/entities/char_2009.gif) :
:![[thin space (1/6-em)]](https://www.rsc.org/images/entities/char_2009.gif) 1.2
1.2![[thin space (1/6-em)]](https://www.rsc.org/images/entities/char_2009.gif) :
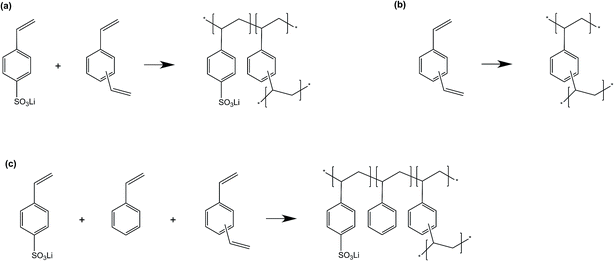
:![[thin space (1/6-em)]](https://www.rsc.org/images/entities/char_2009.gif) 1.0. For the MWLX, the subscript WLX means that the mass ratio of water to LiSS is X. Different water/LiSS ratios (i.e., X) were studied, including 0.5 and 1.2. Meanwhile, the mass ratio of DVB and styrene to LiSS to water was kept the same, namely 0.5. It should be noted that MWL1.2 was replaced with MDL0.5 because they were actually identical. Also, the procedures to prepare the MCDX series were slightly different compared with the other three series. To be specific, for the MCDX series, two different mixtures were used together for synthesis. The first mixture was mainly composed of DVB, water and LiSS. The second mixture was mainly composed of CER and DVB. The main polymerization reactions occurred during membrane synthesis are shown in Scheme 3.
1.0. For the MWLX, the subscript WLX means that the mass ratio of water to LiSS is X. Different water/LiSS ratios (i.e., X) were studied, including 0.5 and 1.2. Meanwhile, the mass ratio of DVB and styrene to LiSS to water was kept the same, namely 0.5. It should be noted that MWL1.2 was replaced with MDL0.5 because they were actually identical. Also, the procedures to prepare the MCDX series were slightly different compared with the other three series. To be specific, for the MCDX series, two different mixtures were used together for synthesis. The first mixture was mainly composed of DVB, water and LiSS. The second mixture was mainly composed of CER and DVB. The main polymerization reactions occurred during membrane synthesis are shown in Scheme 3.
| M series | X meaning | X values | Other parameters |
|---|---|---|---|
| a M is short for the membrane; DVB is short for divinylbenzene; LiSS is short for lithium p-styrenesulfonate; CER is short for cation exchange resin. | |||
| MDLX | DVB/LiSS ratio | 0.2, 0.4, 0.5, 0.6, 0.8, 1.0 | Water/LiSS ratio was 1.2 |
| MCDX | CER/DVB ratio | 0.2, 0.4, 0.6 | DVB![[thin space (1/6-em)]](https://www.rsc.org/images/entities/char_2009.gif) : :![[thin space (1/6-em)]](https://www.rsc.org/images/entities/char_2009.gif) water water![[thin space (1/6-em)]](https://www.rsc.org/images/entities/char_2009.gif) : :![[thin space (1/6-em)]](https://www.rsc.org/images/entities/char_2009.gif) LiSS was 0.6 LiSS was 0.6![[thin space (1/6-em)]](https://www.rsc.org/images/entities/char_2009.gif) : :![[thin space (1/6-em)]](https://www.rsc.org/images/entities/char_2009.gif) 1.2 1.2![[thin space (1/6-em)]](https://www.rsc.org/images/entities/char_2009.gif) : :![[thin space (1/6-em)]](https://www.rsc.org/images/entities/char_2009.gif) 1.0 1.0 |
| MCLX | CER/LiSS ratio | 0.2, 0.4, 0.6 | DVB![[thin space (1/6-em)]](https://www.rsc.org/images/entities/char_2009.gif) : :![[thin space (1/6-em)]](https://www.rsc.org/images/entities/char_2009.gif) water water![[thin space (1/6-em)]](https://www.rsc.org/images/entities/char_2009.gif) : :![[thin space (1/6-em)]](https://www.rsc.org/images/entities/char_2009.gif) LiSS was 0.6 LiSS was 0.6![[thin space (1/6-em)]](https://www.rsc.org/images/entities/char_2009.gif) : :![[thin space (1/6-em)]](https://www.rsc.org/images/entities/char_2009.gif) 1.2 1.2![[thin space (1/6-em)]](https://www.rsc.org/images/entities/char_2009.gif) : :![[thin space (1/6-em)]](https://www.rsc.org/images/entities/char_2009.gif) 1.0 1.0 |
| MWLX | Water/LiSS ratio | 0.5, 1.2 | (DVB + styrene)/LiSS ratio was 0.5 |
Membrane characterization
Thicknesses of the synthesized membranes were measured using a micrometer. Chemical structures of the synthesized membranes and corresponding materials were investigated via a PerkinElmer Spectrum-100 Fourier-transform infrared spectroscopy (FTIR) spectrometer. IEC was determined using the titration method.20 Briefly, membrane samples were firstly immersed in 1 M HCl solution to convert the Li+ form into the H+ form. Next, the samples were washed thoroughly with water and then immersed in 2 M NaCl solution to convert the H+ form into the Na+ form. Next, the membrane samples were taken out from the solution and washed with water, and the water was then added into the solution. Next, the solution was titrated using 0.01 M NaOH solution. IEC was calculated using the following equation: IEC = C × V/W where C is the concentration of NaOH solution, V is the volume of NaOH solution consumed during titration, and W refers to the dry weight of samples. The loading ratio (LR) was one of the most important parameters in this study. As its name implies, the LR was used to evaluate the amount of functional materials loaded onto and into the porous support after polymerization. To calculate the LR, the weight of the synthesized membrane samples (denoted as W1) and the weight of the corresponding porous support (denoted as W2) were recorded. Then, the following equation could be used to calculate the LR: LR = (W1 − W2)/W2. As the porous support contained no functional groups (i.e., sulfonate groups), the loaded functional materials were the only source of sulfonate groups. Obviously, the LR had a direct effect on IEC. To measure the water uptake (or salt solution uptake) of the synthesized membranes, the samples were firstly immersed in 2 M NaCl solution for 24 h, and then excess water on the sample surface was removed, and then the wet weight of the samples was measured using a balance. After that, the samples were dried in an oven at 60 °C. Water uptake was equal to the difference of wet weight and dry weight, divided by the dry weight of the sample. Water contact angles of the synthesized membranes were measured using a standard rame-hart goniometer (model 250-U1). Membrane morphology and sulfur distribution were studied using a Jeol JSM-6400 scanning electron microscope (SEM) in combination with an energy-dispersive X-ray spectrometer (EDS or EDX). Membrane thermal properties were evaluated via thermogravimetric analysis (TGA) and differential scanning calorimetry (DSC). The membrane samples were tested using a Netzsch STA instrument (model 449 F5 Jupiter®). Under a nitrogen flow of 20 cm3 min−1, the samples were firstly heated to 170 °C followed by an isothermal process for 10 min, and then cooled down to 30 °C followed by another isothermal process for 10 min, and then heated to 650 °C. Both the heating rate and cooling rate were kept at 10 °C min−1. The second DSC heating curve was used.Membrane desalination performance
Desalination performance measures the efficiency of membranes in removing the ions from the salt solution. Desalination performance can be quantified using the following equation: | (1) |
Desalination performance was tested using a PCCell ED 64004 electrodialysis cell. Commercial membranes were purchased from PCA GmbH. Five pairs of membranes, including six CEMs and five AEMs, were used each time. In order to compare the performance of synthesized CEMs in this study to that of commercial CEMs, the same AEMs from PCA GmbH were used for all the tests. A BioLogic VSP potentiostat was used to supply power to the cell. Current density was constant during the desalination test. Sodium chloride solution was used in the concentrate compartment and dilute compartment for desalination demonstration. The volume of the concentrate compartment, dilute compartment and electrode compartment was 2.5 L, 2.5 L, and 4.0 L, respectively, and the flow rates were around 0.6 L min−1, 0.6 L min−1 and 2.4 L min−1, respectively. The desalination test lasted for sixty minutes and the samples were collected every ten minutes. The conductivity of the samples was measured using a Cole-Parmer TDS meter (model C100). The concentration was calculated based on the relationship between conductivity and concentration (see Section 4 in the ESI‡ for more details).
Results and discussion
Membrane synthesis and thickness
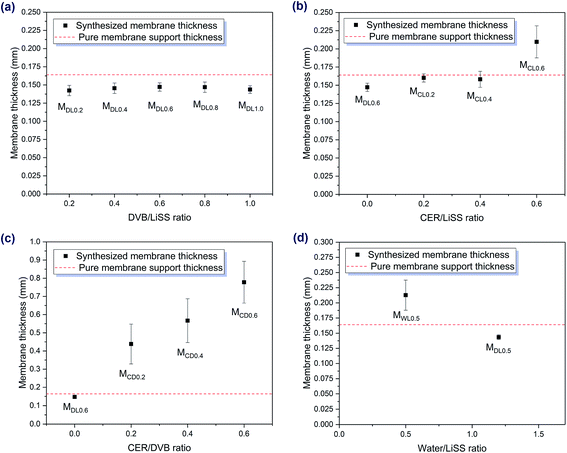
The effect of membrane thickness on membrane properties is complicated. An increase in membrane thickness indicates that more functional materials are loaded into and onto the membrane support. When a membrane contains more functional materials (e.g., sulfonate groups for CEM), the desalination efficiency could be increased because more salt ions can pass through the membrane (e.g., sodium ions for CEM) per unit time. Nevertheless, when the membrane thickness is increased, the membrane resistance will also increase. As a result, the desalination efficiency will be reduced. This contradictory result reveals that membrane thickness has a trade-off relationship with membrane properties. As shown in Fig. 1, the synthesized membranes exhibited different membrane thicknesses under different preparation conditions. When the other conditions were kept the same, DVB/LiSS ratios (i.e., the MDLX series) did not have an obvious effect on membrane thicknesses (Fig. 1a). This was due to the low loading ratios of functional materials in the membranes. When the porous support was immersed in the liquid mixtures, water competed with functional monomers because of the limited space in the support. As the total liquid uptake capacity of the support did not change much, the loading of functional monomers was affected. During polymerization, water was evaporated gradually, which made more space available. At the same time, the monomers underwent polymerization. However, due to the pressure applied onto the support, most of the liquid mixture on the support was removed before the reaction. As a result, very little monomer was available to fill in the space left by water. Therefore, the loading ratio of functional materials was reduced. Furthermore, the pressure applied on the reactor also showed a negative effect on membrane thickness. Although the loaded functional materials had a positive effect on membrane thickness, the negative effect of the pressure was greater than the positive effect of functional materials when the loading ratio was low. As a result, some synthesized membranes showed decreased thicknesses compared to the thickness of the pure membrane support (Fig. 1).When cation exchange resin (CER) was introduced, it had a positive effect on membrane thickness. However, its effect was different in different situations. For example, when the ratios of LiSS, water, and DVB were kept the same, CER/LiSS ratios (i.e., the MCLX series) had a moderate impact on membrane thicknesses, especially when the CER/LiSS ratio was low (Fig. 1b). Nevertheless, when CER was mixed with DVB, the resulting mixture became very viscous. Moreover, the viscosity increased with increasing the CER/DVB ratio. As a result, the mixture had very poor mobility. When the mixture was applied onto the support surface, it could not spread out. Even when pressure was applied, the thickness of the mixture did not reduce much. As a result, the synthesized membranes (i.e., the MCDX series) showed a dramatic increase in thickness compared to the pure support (Fig. S7‡). Moreover, the higher the CER/DVB ratio, the thicker the membranes (Fig. 1c). Besides, it was interesting to point out that when CER was introduced into DVB, its color changed to black, so possibly this was not a simple physical mixture. In other words, it was possible that unwanted chemical reactions happened after the two chemicals were mixed together. Therefore, one interesting future research topic is to investigate the interactions between CER and DVB.
The water/LiSS ratio also showed an effect on membrane thickness. As shown in Fig. 1d, reducing the water/LiSS ratio could increase membrane thickness. The reason was that, as water usage was reduced, more space was occupied by functional monomers, and therefore the loading ratio was increased. At the same time, lowering the water ratio also made the mixture more viscous, and thus the pressure applied on the support was less effective in removing the mixture on the surface. As a result, after polymerization, more functional materials were loaded into and onto the support, and therefore the membrane thickness was increased.
Membrane chemical structure
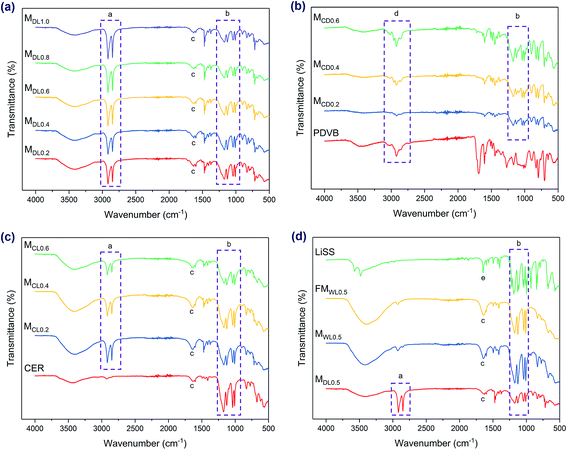
Chemical structures of the membranes were investigated by FTIR. The broad concave shape with the shape center at around 3410 ± 16 cm−1, in combination with another peak at 1632 ± 3 cm−1 (denoted as c in Fig. 2a, c and d), indicated the presence of water in these samples. In contrast, in the spectra of the MCDX series, these two peaks were not prominent, indicating the low amount of water. This corresponded well to the following water uptake analysis, as the MCDX series exhibited much lower water uptake compared to the other membrane series.The peaks at 1173 ± 2 cm−1, 1127 ± 1 cm−1, 1039 ± 2 cm−1, and 1009 ± 1 cm−1 (denoted as b in Fig. 2) were characteristic peaks of the sulfonate group (salt form). As discussed above, the thicknesses of the MCDX series were much higher compared to the thickness of the pure membrane support. As a result, the mass fraction of polydivinylbenzene (PDVB) and the cation exchange resin (CER) in the membranes was much higher than that of the support. That is why these membranes did not show characteristic peaks of the support. Instead, the spectra of these membranes exhibited spectra characteristics of PDVB (denoted as d in Fig. 2b) and CER.
Besides, the two peaks around 2916 cm−1 and 2849 cm−1 (denoted as a in Fig. 2a, c and d) were characteristic peaks of the membrane support. Furthermore, MWL0.5 and FMWL0.5 exhibited very similar FTIR spectra to each other, indicating the high ratio of functional materials in the membranes. This further revealed the high IEC of the membranes, as discussed below. In addition, these spectra agreed well with those of cross-linked sulfonated polystyrene salts, indicating the successful polymerization of LiSS. Besides, the successful polymerization of LiSS could also be verified via the spectrum of LiSS. To be specific, the sharp peak of the LiSS spectrum at 1647 cm−1 (denoted as e in Fig. 2d) revealed the presence of the vinyl group. This sharp peak disappeared after the reaction, which indicated that the vinyl group was involved in the reaction.
Ion exchange capacity and loading ratios
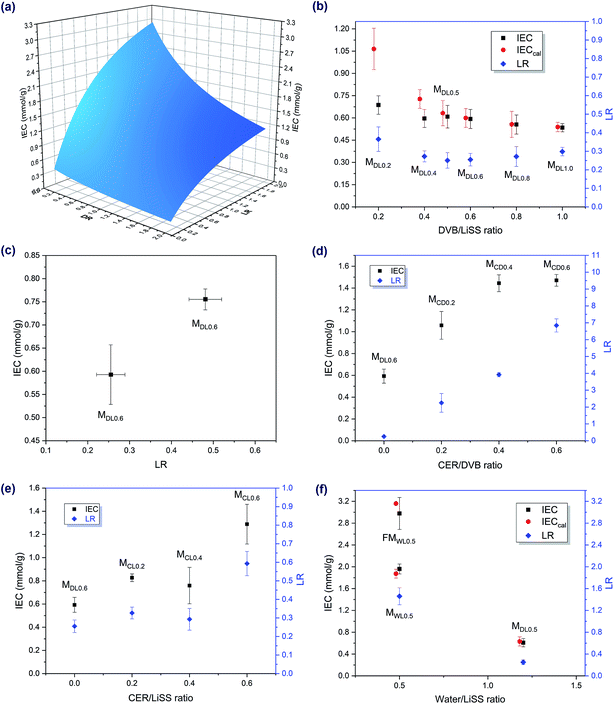
Ion exchange capacity (IEC) is one of the most important properties of IEMs. In this work, preparation conditions demonstrated a great influence on the IEC of the synthesized membranes, mainly by influencing the loading ratio of functional materials (denoted as LR below) and also the IEC of loaded functional materials. To be more specific, the IEC of the synthesized membranes could be increased by increasing the LR and/or IEC of loaded functional materials. Generally, the LR could be controlled by controlling the immersion time of the porous support in the liquid mixture and/or by controlling the compositions of the liquid mixture. For example, the MCDX series demonstrated very high loading ratios compared to the other membrane series. The reason for this was that the mixture of CER and DVB was very viscous. As a result, more CER/DVB mixture was loaded onto the membrane support. Moreover, the IEC of loaded functional materials had a positive relationship with the amount of sulfonate groups in the materials. Therefore, the IEC of loaded functional materials could be increased by increasing the amount of sulfonate groups in it. If assuming all water was removed during membrane preparation and all water-soluble substances were removed during conversion, then the IEC of the synthesized membranes was affected by two parameters, including the LR and mass ratio of DVB and styrene to LiSS in the liquid mixture (denoted as DR below). The following equation was obtained to quantitatively describe the influence of the LR and DR on IEC. Also, Fig. 3a demonstrates this quantitative relationship. Detailed derivation procedures for the following equation are provided in Section 3 of the ESI.‡ | (2) |
As shown in Fig. 3b, under the same preparation conditions, the LR did not seem to be affected by the DVB/LiSS ratio in the mixture. Furthermore, when the LR was about the same, the DVB/LiSS ratio revealed a negative relationship with IEC, though the relationship was not prominent. At high DVB/LiSS ratios, experimental IEC values corresponded well to theoretical IEC values. At low DVB/LiSS ratios, some deviations were observed. This was possibly due to the fact that eqn (2) was obtained based on the assumption that all water was evaporated during the reaction. However, when the DVB/LiSS ratio was low, the amount of water used for synthesis was high, and therefore the above assumption was no longer valid. In other words, the effect of water could not be ignored at low DVB/LiSS ratios. Also, the IEC values of the membrane samples in Fig. 3b are not high, due to the low LRs. One possible way to increase the LR was to increase the amount of liquid mixture in and on the membrane support before the reaction. In addition, as revealed by Fig. 3c, when the other conditions were the same, the LR had a positive relationship with IEC, which agreed well with theoretical predictions (Fig. 3a).
As revealed by Fig. 3d and e, cation exchange resin (CER) had a positive effect on IEC. Moreover, compared to the other membrane series, increasing the CER/DVB ratio could also dramatically increase the LR (Fig. 3d). As a result, IEC was also increased. In addition, the effect of CER/LiSS ratio on the LR and on the IEC showed a similar trend, due to the positive relationship between the LR and IEC (Fig. 3e). Though CER could increase IEC, it was possible to prepare membranes with comparable or even higher IEC without using CER. One strategy to prepare high IEC membranes without CER was to reduce the amount of water used for dissolving LiSS in the mixtures (Fig. 3f). When the water amount was reduced, more functional polystyrene sulfonates could be formed in and on the support, and therefore the LR and IEC also increased. This also agreed well with theoretical calculations.
Water uptake and contact angles
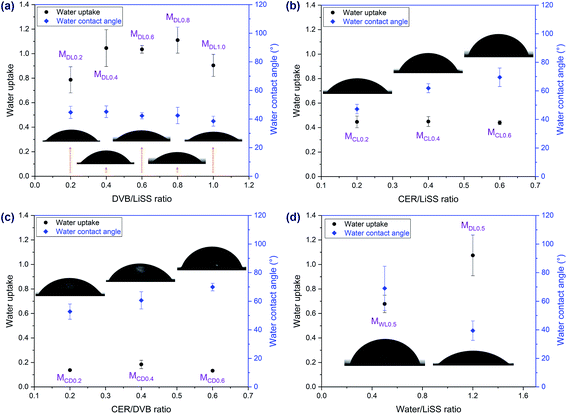
Water uptake and contact angles were another two parameters revealing electrochemical properties of CEMs. As shown in Fig. 4, all the membrane samples exhibited hydrophilicity but varied in degree. The MDLX series demonstrated the highest water uptake and the lowest contact angle compared to the other series. In contrast, due to the thick PDVB layer formed on the support, the MCDX series exhibited the lowest water uptake among all the series.Membrane morphology and sulfur distribution
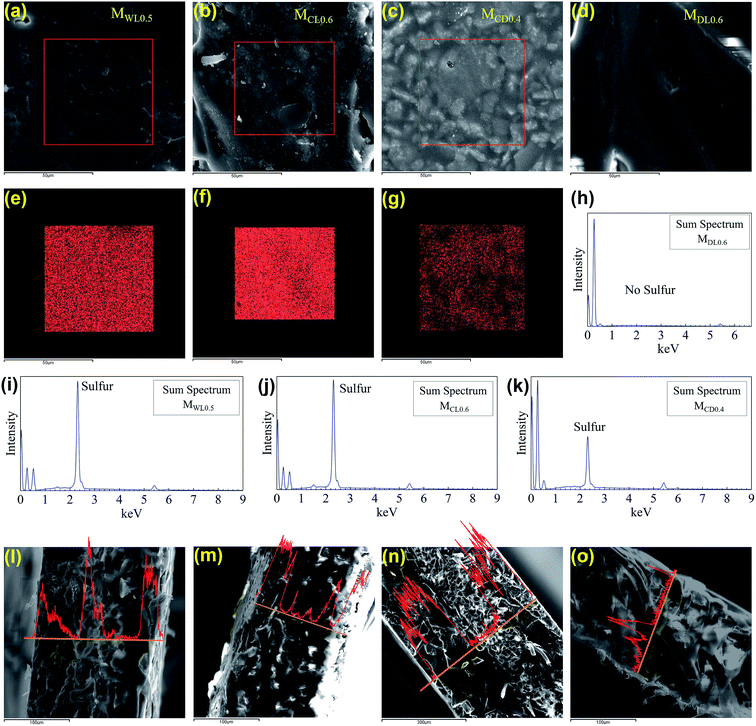
As revealed by Fig. 5a–d, different series of membrane samples exhibited different surface morphologies. As the sulfonate group played an important role in determining IEC and membrane performance, its distribution within the membranes were investigated using the sulfur mapping technique.34 As shown in Fig. 5e, f, i, and j, both MWL0.5 and MCL0.6 showed rich and uniform sulfur distribution on the membrane surface. As shown in Fig. 5c, the surface of MCD0.4 was rough. To some extent, this uneven surface increased the difficulty to detect sulfur. As a result, the sulfur distribution of MCD0.4 was not as uniform as those of MWL0.5 and MCL0.6. In contrast, as shown in Fig. 5h, MDL0.6 did not show sulfur distribution on the surface due to the low loading ratio of functional materials in the membranes compared to those of the other membrane series. To summarize, the surface sulfur distribution of different membranes shown in Fig. 5 agreed well with the above IEC analysis. In addition, as shown in Fig. 5l–o, sulfur distributions of the membrane cross-sections were not uniform, which was due to the porous structure of the membrane support. For example, the cross-section of MCD0.4 clearly showed three layers, due to the high loading ratio. The outer two layers did not contain the membrane support while the inner layer contained both membrane support and functional materials. Besides, it seemed that there were some “pores” in the membranes, as shown in Fig. 5l–o. However, it should be clarified that they were not pores. In fact, they were cross-sections of the membrane support, which had a fiber shape. To conclude, the synthesized membranes were semi-homogenous, where the fibers contained no sulfonate groups while the functional materials had uniform distribution of sulfonate groups.Membrane thermal properties
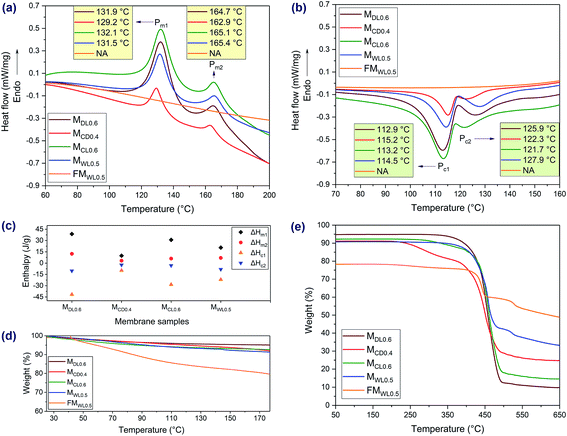
As revealed by Fig. 6a, the membranes showed two melting peaks, which were characteristic peaks of the membrane support. Also, all the peaks were there, only shifting slightly. Furthermore, as revealed by the TGA curve (Fig. 6e), during the second heating process, there was no mass loss below 200 °C. These phenomena indicated that no chemical reactions happened to the porous support during membrane preparation. In addition, the membranes also showed two crystallization peaks (Fig. 6b). In contrast, the functional materials did not show any melting or crystallization peaks at relevant temperatures, indicating their amorphous structure.41 Besides, many factors could cause shift of the melting peaks and crystallization peaks, such as the heating rates and cooling rates.42,43 As revealed by Fig. 6c, MDL0.6 had the highest melting enthalpies and crystallization enthalpies (absolute value, the same as below) while MCD0.4 had the lowest melting enthalpies and crystallization enthalpies. The reason lied in that MDL0.6 had the lowest loading ratio compared to those of the other series, while MCD0.4 had the highest loading ratio (Fig. 3). In other words, the mass ratio of the porous support was highest in MDL0.6 and lowest in MCD0.4. As a result, MDL0.6 had the highest enthalpies while MCD0.4 had the lowest enthalpies. As shown in Fig. 6d, the weight of the samples decreased gradually, which was due to the loss of absorbed water in the membranes. The sulfonate groups in the membranes had a positive role in retaining the water molecules in the membranes, so the release of water molecules was a continuing process.44 The following weight losses in Fig. 6e were due to the decomposition of the sulfonate group and degradation the polymer matrix. In addition, the functional material which had the highest sulfur amount showed the highest residual weight. In contrast, MDL0.6 which had the lowest sulfur amount showed the lowest residual weight. One possible explanation was that during degradation, a highly thermostable sulfur-bridged polymer was formed.45Membrane desalination performance
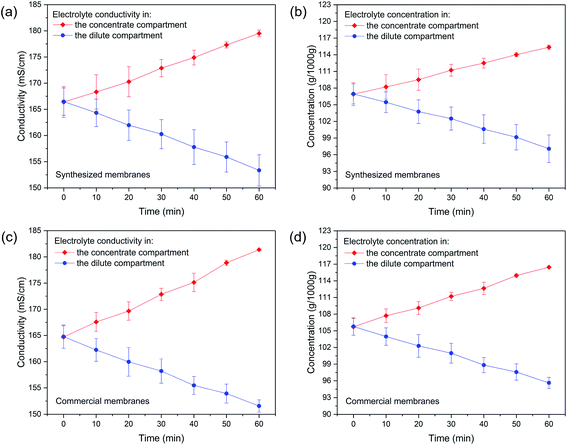
Membrane desalination performance was demonstrated using MWL0.5 due to its advantages over the other membrane series. Firstly, MCDX had high thicknesses compared to the other membrane series, which indicated that the membrane resistance could be very high. As a result, its desalination efficiency was very low. Secondly, MDLX had low IEC compared to the other membrane series, which would also affect its desalination efficiency. Thirdly, although MCLX did not show obvious disadvantages over the other membrane series, CER was used to improve its performance. In addition, it was much easier to get uniform sulfur distribution for MWL0.5 compared to that for MCLX. Therefore, among all of the membrane series, MWL0.5 stands out.The basic properties of the synthesized membranes and commercial membranes used for the desalination test are summarized in Table 2. The membranes have the same square shape with an active area of 64 cm2 (see Section 4 in the ESI‡ for more details). As revealed by Fig. 7, in the desalination process, the conductivity and concentration of electrolyte (i.e., sodium chloride solution) in the concentrate compartment increased while the conductivity and concentration of electrolyte in the dilute compartment decreased. More importantly, the synthesized membranes showed high desalination performance, which was comparable to that of commercial membranes, even given that the synthesized membranes had a higher thickness compared to commercial membranes. Therefore, it is envisioned that when the membrane thickness is reduced while its high IEC is maintained, the desalination performance could be further increased. This is one interesting future research topic. Furthermore, it was possible to realize large-scale production of membranes using this method (see Section 5 in the ESI‡ for more details). Admittedly, as this method is new, there are still many aspects which need further study, such as membrane stability study. Especially, future research should focus on improving the stability of MWLX in dilute solutions. Nevertheless, as green synthesis is the future of membrane synthesis, it is envisioned that this environment-friendly methodology could be widely used to synthesize other kinds of ion exchange membranes, and therefore could open up a new era of membrane synthesis.
| Synthesized membrane | Commercial membrane | |
|---|---|---|
| Supplier | — | PCA GmbH company |
| ID | MWL0.5 | PC SK |
| Type | CEM | CEM |
| Charged group | Sulfonate group | Sulfonate group |
| Width (cm) | 11 | 11 |
| Length (cm) | 11 | 11 |
| Thickness (mm) | 0.21 ± 0.02 | 0.18 ± 0.02 |
Conflicts of interest
There are no conflicts to declare.Conclusions
In summary, a new and effective methodology to prepare high performance cation exchange membranes was proposed and studied. Instead of using conventional organic solvents and concentrated sulfuric acid for sulfonation, water was selected as the solvent and also no sulfonation was needed. A series of membranes were synthesized using this methodology and different preparation conditions were investigated in order to optimize the synthesis parameters. Polymerization successfully took place on and within the membranes, and the support did not take part in the reactions. Also, when cation exchange resin was not used, ion exchange capacity (IEC) was determined by two factors, including the mass ratio of divinylbenzene and styrene to lithium p-styrenesulfonate, and the loading ratio of functional materials. In addition, water played an important role in membrane synthesis. IEC could be greatly increased by reducing the amount of water used for synthesis. More importantly, high IEC could be achieved without cation exchange resin, and therefore the synthesis procedure could be more efficient and the synthesized membranes could be more homogeneous. Finally, the synthesized membranes demonstrated high desalination performance. We envision that this methodology may open up new possibilities for the synthesis of ion exchange membranes in an effective and environment-friendly way. In order to further improve this methodology, more studies on membrane stability should be carried out in future research.Acronyms
The acronyms below are listed in alphabetical order.| AEMs | Anion exchange membranes |
| BPO | Benzoyl peroxide |
| CEMs | Cation exchange membranes |
| CER | Cation exchange resin |
| DMAc | Dimethylacetamide |
| DMF | Dimethylformamide |
| DP | Desalination performance |
| DR | DVB and styrene to LiSS mass ratio |
| DSC | Differential scanning calorimetry |
| DVB | Divinylbenzene |
| EDS or EDX | Energy-dispersive X-ray spectroscopy |
| FM | Functional material |
| FTIR | Fourier-transform infrared spectroscopy |
| IEC | Ion exchange capacity |
| IEMs | Ion exchange membranes |
| LiSS | Lithium p-styrenesulfonate |
| LR | Loading ratio |
| PDVB | Polydivinylbenzene |
| PSS | Polystyrene sulfonate |
| SEM | Scanning electron microscope |
| TGA | Thermogravimetric analysis |
Acknowledgements
Bradley P. Ladewig gratefully acknowledges financial support from Imperial College London. Shanxue Jiang gratefully acknowledges the Department of Chemical Engineering at Imperial College London for providing the PhD scholarship. The authors would like to thank Dr Mahmoud Ardakani for his help with SEM. We thank Patricia Carry and Kaho Cheung for their help with FTIR and STA. We thank Dr Bo Wang and Vatsal Shah for providing support to use the goniometer. We thank David Crawford for building up the electrodialysis system.Notes and references
- J. S. Olsson, T. H. Pham and P. Jannasch, Adv. Funct. Mater., 2018, 28, 1–10 CrossRef.
- L. Xue, Y. Li, X. Liu, Q. Liu, J. Shang, H. Duan, L. Dai and J. Shui, Nat. Commun., 2018, 9, 2–9 CrossRef PubMed.
- T. Zhu, S. Xu, A. Rahman, E. Dogdibegovic, P. Yang, P. Pageni, M. P. Kabir, X. D. Zhou and C. Tang, Angew. Chem., Int. Ed., 2018, 57, 2388–2392 CrossRef CAS PubMed.
- L. Wang, M. Bellini, H. A. Miller and J. R. Varcoe, J. Mater. Chem. A, 2018, 6, 15404–15412 RSC.
- M. A. Aziz and S. Shanmugam, J. Mater. Chem. A, 2018, 6, 17740–17750 RSC.
- S. Jiang, K. F. L. Hagesteijn, J. Ni and B. P. Ladewig, RSC Adv., 2018, 8, 24036–24048 RSC.
- Y. Zhu, Y. He, X. Ge, X. Liang, M. A. Shehzad, M. Hu, Y. Liu, L. Wu and T. Xu, J. Mater. Chem. A, 2018, 6, 527–534 RSC.
- A. Sarapuu, E. Kibena-Põldsepp, M. Borghei and K. Tammeveski, J. Mater. Chem. A, 2018, 6, 776–804 RSC.
- P. D. Tran, A. Morozan, S. Archambault, J. Heidkamp, P. Chenevier, H. Dau, M. Fontecave, A. Martinent, B. Jousselme and V. Artero, Chem. Sci., 2015, 6, 2050–2053 RSC.
- Y. Kim, L. C. H. Moh and T. M. Swager, ACS Appl. Mater. Interfaces, 2017, 9, 42409–42414 CrossRef CAS PubMed.
- X. Tong, B. Zhang, Y. Fan and Y. Chen, ACS Appl. Mater. Interfaces, 2017, 9, 13491–13499 CrossRef CAS PubMed.
- N. D. Pismenskaya, E. V. Pokhidnia, G. Pourcelly and V. V. Nikonenko, J. Membr. Sci., 2018, 566, 54–68 CrossRef CAS.
- C. Fernandez-Gonzalez, A. Dominguez-Ramos, R. Ibañez, Y. Chen and A. Irabien, Desalination, 2017, 406, 16–24 CrossRef CAS.
- S. R. Kwon, S. H. Nam, C. Y. Park, S. Baek, J. Jang, X. Che, S. H. Kwak, Y. R. Choi, N. R. Park, J. Y. Choi, Y. Lee and T. D. Chung, Adv. Funct. Mater., 2018, 28, 1–10 Search PubMed.
- S. Y. Yeon, J. Yun, S. Yoon, D. Lee, W. Jang, S. H. Han, C. M. Kang and T. D. Chung, Chem. Sci., 2018, 9, 8071–8076 RSC.
- D. H. Cho, K. H. Lee, Y. M. Kim, S. H. Park, W. H. Lee, S. M. Lee and Y. M. Lee, Chem. Commun., 2017, 53, 2323–2326 RSC.
- M. Bdiri, L. Dammak, C. Larchet, F. Hellal, M. Porozhnyy, E. Nevakshenova, N. Pismenskaya and V. Nikonenko, Sep. Purif. Technol., 2019, 210, 636–650 CrossRef CAS.
- L. Cseri, J. Baugh, A. Alabi, A. AlHajaj, L. Zou, R. A. W. Dryfe, P. M. Budd and G. Szekely, J. Mater. Chem. A, 2018, 6, 24728–24739 RSC.
- C. Hu, Q. Zhang, C. Lin, Z. Lin, L. Li, F. Soyekwo, A. Zhu and Q. Liu, J. Mater. Chem. A, 2018, 6, 13302–13311 RSC.
- X. Cheng, J. Wang, Y. Liao, C. Li and Z. Wei, ACS Appl. Mater. Interfaces, 2018, 10, 23774–23782 CrossRef CAS PubMed.
- K. Firouz Tadavani, A. Abdolmaleki, M. R. Molavian and M. Zhiani, ACS Appl. Energy Mater., 2018, 1, 2464–2473 CrossRef CAS.
- K. H. Lee, D. H. Cho, Y. M. Kim, S. J. Moon, J. G. Seong, D. W. Shin, J. Y. Sohn, J. F. Kim and Y. M. Lee, Energy Environ. Sci., 2017, 10, 275–285 RSC.
- L. Wang, M. Liu, J. Zhao, Y. Lei and N. Li, J. Mater. Chem. A, 2018, 22940–22950 RSC.
- H. J. Kwon, B. Kim, G. Lim and J. Han, J. Mater. Chem. A, 2018, 6, 7714–7723 RSC.
- A. E. Mofrad, A. Moheb, M. Masigol, M. Sadeghi and F. Radmanesh, J. Colloid Interface Sci., 2018, 532, 546–556 CrossRef CAS PubMed.
- F. Radmanesh, T. Rijnaarts, A. Moheb, M. Sadeghi and W. M. de Vos, J. Colloid Interface Sci., 2019, 533, 658–670 CrossRef CAS PubMed.
- J. Zhao, L. Guo and J. Wang, J. Membr. Sci., 2018, 563, 957–968 CrossRef CAS.
- N. Joseph, J. Thomas, P. Ahmadiannamini, H. Van Gorp, R. Bernstein, S. De Feyter, M. Smet, W. Dehaen, R. Hoogenboom and I. F. J. Vankelecom, Adv. Funct. Mater., 2017, 27, 1–8 CrossRef.
- D. V. Golubenko, G. Pourcelly and A. B. Yaroslavtsev, Sep. Purif. Technol., 2018, 207, 329–335 CrossRef CAS.
- Y. Wang, J. Peng, J. Li and M. Zhai, Radiat. Phys. Chem., 2017, 130, 252–258 CrossRef CAS.
- I. H. Shin, S. Hong, S. J. Lim, Y. S. Son and T. H. Kim, J. Ind. Eng. Chem., 2017, 46, 103–110 CrossRef CAS.
- N. Ataollahi, E. Cappelletto, K. Vezzù, V. Di Noto, G. Cavinato, E. Callone, S. Dirè, P. Scardi and R. Di Maggio, Solid State Ionics, 2018, 322, 85–92 CrossRef CAS.
- J. P. Cosas Fernandes, V. H. Mareau and L. Gonon, Polymer, 2018, 137, 231–244 CrossRef CAS.
- S. Jiang and B. P. Ladewig, ACS Appl. Mater. Interfaces, 2017, 9, 38612–38620 CrossRef CAS PubMed.
- D. H. Kim, Y. E. Choi, J. S. Park and M. S. Kang, Electrochim. Acta, 2019, 295, 164–172 CrossRef CAS.
- J. Choi, S. Yang, N. J. Jeong, H. Kim and W. S. Kim, Langmuir, 2018, 34, 10837–10846 CrossRef CAS PubMed.
- J. Kim, Y. Lee, J. D. Jeon and S. Y. Kwak, J. Power Sources, 2018, 383, 1–9 CrossRef CAS.
- A. Le Mong, S. Yang and D. Kim, J. Membr. Sci., 2017, 543, 133–142 CrossRef.
- Y. Oshiba, J. Tomatsu and T. Yamaguchi, J. Power Sources, 2018, 394, 67–73 CrossRef CAS.
- R. Gloukhovski, V. Freger and Y. Tsur, Rev. Chem. Eng., 2018, 34, 455–479 Search PubMed.
- F. Müller, C. A. Ferreira, L. Franco, J. Puiggalí, C. Alemán and E. Armelin, J. Phys. Chem. B, 2012, 116, 11767–11779 CrossRef PubMed.
- K. Cho, F. Li and J. Choi, Polymer, 1999, 40, 1719–1729 CrossRef CAS.
- J. T. Xu, P. J. Ding, Z. S. Fu and Z. Q. Fan, Polym. Int., 2004, 53, 1314–1320 CrossRef CAS.
- S. Ryu, J. H. Kim, J. Y. Lee and S. H. Moon, J. Mater. Chem. A, 2018, 6, 20836–20843 RSC.
- M. Matsuda, K. Funabashi, H. Yusa and M. Kikuchi, J. Nucl. Sci. Technol., 1987, 24, 124–128 CrossRef CAS.
Footnotes |
| † The raw experimental data and additional images are available from the open repository DOI: 10.5281/zenodo.1622251 |
| ‡ Electronic supplementary information (ESI) available: Solubility study of LiSS in green solvents, membrane thickness increase in the MCDX series, theoretical derivations of ion exchange capacity, ED test details, and large-scale production and yield of membranes. See DOI: 10.1039/c9ta06248c |
| This journal is © The Royal Society of Chemistry 2019 |

