 Open Access Article
Local structure and vibrational dynamics of proton conducting Ba2In2O5(H2O)x†
A.
Perrichon
 a,
M.
Jiménez-Ruiz
b,
L.
Mazzei
 c,
S. M. H.
Rahman
 a and
M.
Karlsson
 *a
*a
aDepartment of Chemistry and Chemical Engineering, Chalmers University of Technology, SE-412 96 Göteborg, Sweden. E-mail: maths.karlsson@chalmers.se
bInstitut Laue-Langevin, 71 avenue des Martyrs, 38000 Grenoble, France
cDepartment of Physics, Chalmers University of Technology, SE-412 96 Göteborg, Sweden
First published on 11th July 2019
Abstract
We study the local structure and vibrational dynamics of the brownmillerite-based proton conductors Ba2In2O5(H2O)x, with x = 0.30, 0.76, and 0.92, using infrared spectroscopy, inelastic neutron scattering and ab initio molecular dynamics simulations. Ba2In2O5(H2O)x is found to exhibit two main types of proton sites, H(1) and H(2). The H(1) site is characterised by the coexistence of two intra-octahedral hydrogen-bond geometries, whereas the H(2) site is characterised by inter-octahedral hydrogen bonding. While the strength of the hydrogen bonding is similar for the majority of protons in the two proton sites, ≈10% of the H(2) protons forms unusually strong hydrogen bonds due to local proton environments characterised by an unusually short oxygen–oxygen separation distance of ≈2.6 Å. These local proton environments are manifested as two O–H stretch bands in the infrared absorbance spectra, at 255 and 290 meV, respectively. These O–H stretch bands are as well observed in the related class of In-doped perovskite-type oxides, BaInyZr1−yO3−y/2 (0.25 ≤ y ≤ 0.75), suggesting that these perovskites may display brownmillerite-like distortions on a local length scale. In effect, these results point towards a clustering of the In atoms in these perovskite materials. Further, the infrared spectra of Ba2In2O5(H2O)x show a minor evolution as a function of x, because the protons tend to segregate into oxygen-rich hydrogen-rich domains upon dehydration. This points towards a highly anisotropic proton conduction mechanism in partially hydrated phases. This insight motivates efforts to identify ways to avoid phase separation, perhaps by suitable cation substitutions, as a route to accommodate high proton conductivity.
1 Introduction
Proton conducting oxides are currently the subject of considerable attention due to their significant potential as efficient proton conducting electrolytes in next-generation solid oxide fuel cells operating in the intermediate temperature range T = 200–500 °C.1–6 Of specific concern in this work is barium indate, Ba2In2O5, which exhibits the so called brownmillerite structure that is characterised by an intergrowth of alternating (perovskite-like) InO6 octahedral layers and InO4 tetrahedral layers,7–9 as illustrated in Fig. 1a. Upon heat treatment in a humid atmosphere, Ba2In2O5 transforms into a hydrogenated “pseudo-cubic” phase with the nominal stoichiometry Ba2In2O5(H2O)x, where x may vary from 0 (dry phase) to 1 (fully hydrogenated phase). During the heat treatment, the water molecules dissociate into hydroxyl groups (OH−) and protons (H+), with the hydroxide groups filling up the former tetrahedral layers, which leads to structurally distorted octahedral layers at high hydration levels, while the protons delocalise into the former, relatively undistorted, octahedral layers. Previously, it has been shown that at least two distinct proton sites, H(1) and H(2), are present in Ba2In2O5(H2O)x,10–13 schematised in Fig. 1b. The H(1) protons form covalent bonds to the oxygen atoms connecting the two layers, O(2), and may be hydrogen bonded to either O(1) in the relatively undistorted octahedral layers, or to O(3) in the distorted octahedral layers. Either way, the donor and acceptor oxygen atoms belong to the same octahedral unit and, thus, the H(1) hydrogen-bond geometry is referred to as intra-octahedral geometry. The H(2) protons form covalent bonds to O(3) and experience a hydrogen bond to a O(3) oxygen atom of a neighbouring octahedra, with the O(3)–H⋯O(3) bond angle being essentially linear. Accordingly, the H(2) hydrogen-bond geometry is referred to as inter-octahedral geometry.The average structure of the hydrated “pseudo-cubic” phase is described based on diffraction data within the P4/mcm space-group,13 in which H(1) partially occupies the (16l) site and H(2) fully occupies the (2c) site (Fig. 1c and d). In order to obtain a more realistic model from the view point of chemical bonding, Martinez et al.,12 showed that the H(2) proton site has to be split from (2c)  to (4h)
  , i.e. from a description where the proton is equidistant between two oxygen atoms, to a classic description involving a shorter covalent bond and a longer hydrogen bond. Note that the resulting (4h) site has a partial occupation of 1/2, yet that two neighbouring (4h) sites, distant of less than 1 Å, are too close to be simultaneously occupied. Regarding the H(1) proton, the (16l) position, (x,y,z), refers to 4 sites around each O(2). However, we here define under that label the position (x,y,z[O(2)]), i.e. we consider that the (16l) positions are in the same planes as the O(2) oxygen atoms. Assuming that the hydrogen bonding may cause a displacement of the proton toward its second neighbour oxygen atom, we also define a (32y) site,12 with position (x,y,z[O(2)] ±ε). While the formal occupation of the (16l) site is 1/8 (and thus 1/16 for (32y)), only one proton can be covalently bonded to each O(2), which corresponds to an average proton occupation of 1/2 around the O(2) atoms. Note that the (32y) notation is based on the hypothesis that the proton environments in which the hydrogen bond of H(1) is accepted by O(1) and O(3) are almost equivalent. Recent results based on density functional theory (DFT) calculations and solid state nuclear magnetic resonance (NMR) however contradict this hypothesis, and instead suggest the coexistence of two configurations of the O(2)–H(1) units, with shorter and longer hydrogen bond lengths and a difference in hydrogen bond angles.14
Recently, we investigated the dehydration from the pseudo-cubic phase, BaInO3H, to the brownmillerite phase, Ba2In2O5, using in situ Raman spectroscopy.10 Crucially, we showed the emergence of an intermediate phase (Ba2In2O5(H2O)x, x ≈ 0.5) containing dynamical signatures of both the brownmillerite and the pseudo-cubic structures.11 The presence of brownmillerite modes in partially hydrated phases reflects the tendency of oxygen vacancies to cluster and form oxygen-depleted domains that are sufficiently spatially extended to produce the (lattice) dynamics observed. It is however difficult to assess the spatial extension of these domains, and their effect on the spatial distribution and dynamics of protons.
Here we report on a detailed characterisation of the spatial distribution and vibrational dynamics of protons in three different compositions of Ba2In2O5(H2O)x (x = 0.30, 0.76, and 0.92), using a combination of infrared (IR) spectroscopy, inelastic neutron scattering (INS), and ab initio molecular dynamics (AIMD) simulations. The INS technique gives access to the hydroxide “wag” modes, δ(O–H), in Ba2In2O5(H2O)x, which are extinct in the Raman and IR spectra, and allows for quantitative analysis of the number of vibrating species thanks to its proportional relationship to the measured INS intensity. The AIMD method is favoured here as it provides, in a few simulations, information on a large number of structures and an estimate of their vibrational dynamics, which can be related to the experimental spectra.
The aim of the study is to evaluate the impact of the hydration level on the number and relative occupation of distinct proton sites, their associated hydrogen bond length and, ultimately, the proton mobility. Because the results are intrinsic to the hydrogenated brownmillerite and perovskite structures, they are expected to be transferable to many other materials of these types.
2 Experimental
2.1 Sample preparation
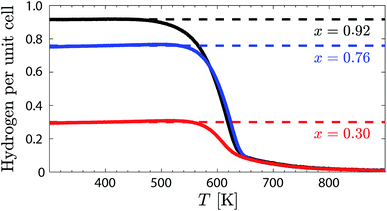
A powder sample, weighting about 28 g, of the chemical composition Ba2In2O5, was prepared by solid state sintering by mixing stoichiometric amounts of the starting reagents BaCO3 and In2O3. The sintering process was divided into three repetitive heat treatments at T = 1273 K for 8 hours, T = 1473 K for 72 hours, and at T = 1598 K for 48 hours, with intermediate cooling, grinding, and compacting of pellets. The phase purity was confirmed by X-ray powder diffraction (Fig. S1†). The as-sintered Ba2In2O5 powder was loaded with protons by letting it cool down over 31 hours from T = 673 K to 473 K in a tube furnace under a flow of N2 saturated with water vapour. A thermogravimetric (TG) measurement was performed using a F1 Iris Netzsch spectrometer on about 20 mg of the protonated (hydrated) sample upon heating from T = 298 K to 1223 K (heating rate of 2 K min−1), in order to determine the nominal degree of hydration and the dehydration profile of the sample. The nominal degree of hydration was found to be 92% (x = 0.92). The remaining powder was split into three batches (3 × 9 g), of which two of them were subjected to partial dehydration by heating to T = 563 K and T = 596 K, respectively. Subsequent TG measurements (heating rate of 5 K min−1) of a small portion of each of these two samples showed that they exhibit hydration levels of 76% (x = 0.76) and 30% (x = 0.30), respectively. The three hydrated Ba2In2O5(H2O)x samples, with x = 0.30 (BIO30), 0.76 (BIO76), and 0.92 (BIO92), were used as is for further measurements (Fig. 2).2.2 Infrared spectroscopy
The IR spectroscopy measurements were performed inside an Ar-atmosphere glovebox at room temperature using a Bruker Alpha DRIFT spectrometer in diffuse reflectance mode. Data was collected between 50 and 870 meV (400 and 7000 cm−1), with a resolution of 0.5 meV (4 cm−1). Absorbance-like spectra were derived by taking the logarithm of the ratio between the spectrum of an almost perfectly diffuse scatterer (here a rough Au mirror), which served as a reference spectrum, and the sample spectra.2.3 Inelastic neutron scattering
The INS measurements were performed on the indirect-geometry spectrometer IN1 Lagrange15 at the Institut Laue-Langevin (ILL, France). We used a combination of focusing monochromators, Si111, Si311 and Cu220, to get access to neutrons with incident energies Ei in the range of 4.5–500 meV. A set of pyrolytic graphite (PG002) crystals were used as analyser to select neutrons with a final energy of Ef = 4.5 meV. The relationship between energy (ħω, meV) and momentum transfer (Q, Å−1), inherently determined by the spectrometer geometry, is illustrated in Fig. S2(a).† The three samples were mounted into standard aluminium hollow cylindrical cells and sealed with indium wire. The measurements were performed at low temperature, T = 10 K, in order to suppress the damping of the INS intensity due to the Debye–Waller factor. A full spectrum, over the energy range ħω = 0–500 meV, was first measured on each of the three samples. Spectra over the δ(O–H) region (ħω = 22–196 meV) were then measured with increased statistics. Reduction and standard corrections of the data, including empty can subtraction and monitor calibration, were performed using the LAMP16 software, and subsequent analyses with in-house scripts.In the incoherent approximation, which is well justified here as the scattering is predominantly due to the large incoherent cross-section of hydrogen, the scattered intensity, S(Q,ħω), is related to the generalised density of states, G(ħω), through the relationship
 | (1) |
| Tp(ħω) = T1(ħω) × Tp−1(ħω), | (2) |
 | (3) |
3 Theoretical
3.1 Ab initio molecular dynamics simulations
The AIMD simulations were performed in the DFT framework, using a plane-wave pseudo-potential approach as implemented in VASP 5.3.18–21 The ionic core–valence interaction is described using the projected augmented wave method.22,23 For the exchange–correlation part we used the semi-local functional by Perdew–Burke–Ernzerhof.24 The Gaussian smearing method was chosen to describe partial occupancy of orbitals, with a smearing width of σ = 0.05 eV. For the MD simulations we used only Γ-point Bloch functions, but for static calculations and structure relaxation the Brillouin zone was sampled using a 1 × 2 × 2 k-point mesh. The AIMD trajectories were obtained using the velocity Verlet algorithm with a time step of dt = 0.5 fs. The temperature was set to T = 300 K and regulated using a canonical ensemble by coupling the system to a Nosé–Hoover thermostat.25–27 The structural models were first geometry optimised, then thermalised by AIMD over a simulation time of 2 ps. Exploitable data consist of 6 independent sets of trajectories per model, with a total length per trajectory of 8 ps.3.2 Structural models
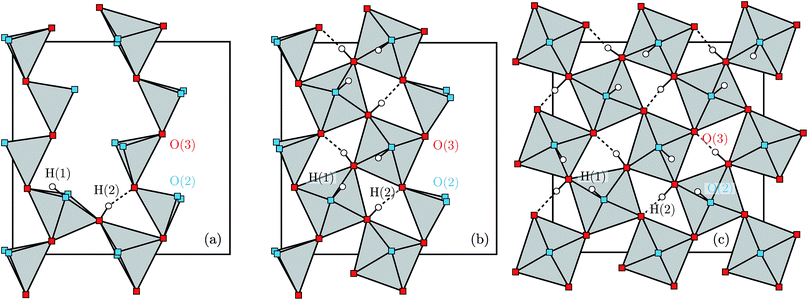
Structural models of the Ba2In2O5(H2O)x phases were built considering 2 × 2 × 1 supercells with respect to the conventional brownmillerite cell. This choice of supercell is motivated both by the limitations of the number of atoms simulated in the DFT framework and by electron diffraction results that suggest that the pseudo-cubic phase may be 4 times larger than the average P4/mbm description.13 The structural model of Ba2In2O5(H2O)x contains a total of 72 + 3 × x atoms representing 8 Ba2In2O5 units and x extra water molecules, giving access to phases with hydration levels every 12.5%. The water molecules were placed in a way to fill adjacent empty sites in the first vacancy chain until the chain is full, then filling the second chain. This procedure was chosen to minimise the amount of energetically unfavourable InO5 polyhedra present at chain termination. As oxygen vacancies and protons repel, we placed the protons in the following way for each added water molecule: a hydrogen is placed to be covalently bonded to the added oxygen atom on a H(2) site, and the second hydrogen is placed on a H(1) site in close vicinity to the added oxygen atom, away from the InO5 and InO4 polyhedra when possible. The pseudo-cubic layer from a random step of the AIMD, for x = 0.125, 0.5, and 1, is shown in Fig. 3.3.3 Vibrational density of states
The vibrational density of states, gd,α(ħω), where d is the atomic index and α the Cartesian directions, was calculated from the velocity autocorrelation function using the MDANSE software,28 and by power spectral density (PSD) analyses using the positional recurrence maps code,29 which was also used for the statistical analyses of the hydrogen bond geometries. The PSD algorithm notably uses a Slepian window function to minimise frequency leakage and the overlapping data segment method to maximise statistics.30G(ħω) is obtained from gd,α(ħω) according to eqn (4). | (4) |
In order to compare directly to the INS data, S(Q,ħω) was calculated from G(ħω) according to eqn (1)–(3). The Debye–Waller functions were estimated from the Q-dependence of the spectrometer [Fig. S2(a)†] according to eqn (5), where 〈uiso2〉 is the isotropic mean-square displacements calculated from the trajectories [Fig. S2(b)†],
| 2W(Q) ≈ 〈uiso2〉Q2. | (5) |
Note that the calculated G(ħω) and S(Q, ħω) functions are convoluted with the instrumental resolution function, which, in the energy range of interest here, ħω = 26–500 meV, is estimated at 2.5% of the incident neutron energy.
4 Results
4.1 Infrared spectroscopy
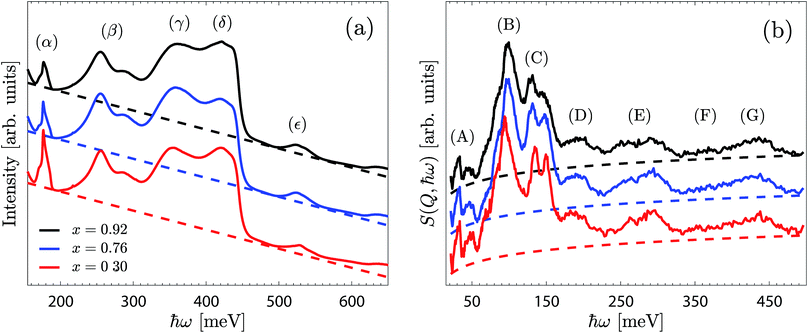
Fig. 4a shows the IR spectra of BIO30, BIO76 and BIO92 over the range 150–650 meV. The spectra are overall similar to each other and are featured by a large, strongly asymmetric, O–H stretch band between approximately 320 and 450 meV, with the two peaks centred at around 355 meV (γ) and 420 meV (δ) assigned as O–H(2) and O–H(1) stretch modes (ν(O–H(2)) and ν(O–H(1)), respectively).10,11 The two peaks at around 255 and 286 meV (β) may be related to O–H stretch modes in strongly hydrogen-bonding configurations, whereas the peak at 526 meV (ε) may be assigned as a combination of modes.31 The sharp feature at 177 meV (α) is originating from a carbonated impurity, likely traces of the reactant BaCO3.32,33 The predominant difference between the three spectra regards the somewhat higher intensity of the γ-band for BIO76 compared to that for BIO92 and BIO30. The energy and intensity of the observed peaks are essentially the same for each material.4.2 Inelastic neutron scattering
The INS spectra measured on the BIO30, BIO76 and BIO92 samples are shown in Fig. 4b. As for the IR spectra, the INS spectra of the three materials are overall very similar to each other, with only small differences amongst them.By comparison with the IR spectra (Fig. 4a) and our previous IR and Raman spectroscopy studies on BaInO3H,10,11 the (F) and (G) peaks, in the range 350–450 meV, are assigned as ν(O–H(2)) and ν(O–H(1)) modes, respectively. The most intense features are the peak at around 97 meV (B), and the two peaks at 130 meV and 145 meV (C), that we tentatively assign to δ(O–H(1)) and δ(O–H(2)) modes, respectively. Consequently, the bands at around 195 meV (D) and 274 meV (E), as found at approximately twice the energy transfer of bands (B) and (C), are tentatively assigned as their respective p = 2 multiphonon term. The low-energy bands, below ca. 75 meV (A), fall in the energy range of the lattice dynamics,10,11 and are identified as riding modes. These latter modes refer to motions that involve the hydroxide group's oxygen atoms, and for which the mode intensity is amplified due to the concurrent displacements of the hydroxide group's hydrogen centre-of-masses.
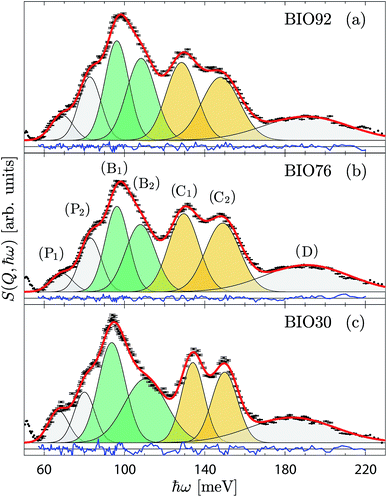
For a more detailed analysis of the INS spectra we have performed a peak fit analysis of the δ(O–H) region between 60 and 220 meV. Testing of several fitting models showed that the baseline, peak width and peak line shapes are strongly correlated to each other. In order to obtain reliable fitting results, we used a model consisting of seven Gaussian functions based on the peak assignment and constraints reported in Section 3 of ESI.† The fitted spectra for the three samples are shown in Fig. 5, and the corresponding fit parameters are summarised in Table 1.
| Label | Assignment | ħω [meV] | Intensity [arb. units] | FWHM [meV] |
|---|---|---|---|---|
| BIO92 | ||||
| P1 | Phonon-related | 68.9(3) | 0.0276(8) | 13.0(4) |
| P2 | Phonon-related | 82.8(4) | 0.0692(34) | 13.0* |
| B1 | δ(O–H(1)) p = 1 | 96.2(3) | 0.1169(29) | 14.0(5) |
| B2 | δ(O–H(1)) p = 1 | 108.3(3) | 0.1169* | 17.0(7) |
| C1 | δ(O–H(2)) p = 1 | 128.4(4) | 0.1181(27) | 18.0(5) |
| C2 | δ(O–H(2)) p = 1 | 148.0(3) | 0.1181* | 22.3(5) |
| D | δ(O–H(1)) p = 2 | 190.6(10) | 0.1010(44) | 50* |
![[thin space (1/6-em)]](https://www.rsc.org/images/entities/char_2009.gif) |
||||
| BIO76 | ||||
| P1 | Phonon-related | 68.8(15) | 0.0199(36) | 12.8(23) |
| P2 | Phonon-related | 83.1(20) | 0.0578(185) | 12.8* |
| B1 | δ(O–H(1)) p = 1 | 96.2(13) | 0.0994(140) | 13.8(29) |
| B2 | δ(O–H(1)) p = 1 | 108.0(14) | 0.0994* | 17.5(41) |
| C1 | δ(O–H(2)) p = 1 | 129.5(13) | 0.1173(114) | 17.8(20) |
| C2 | δ(O–H(2)) p = 1 | 149.0(10) | 0.1173* | 20.2(19) |
| D | δ(O–H(1)) p = 2 | 190.9(44) | 0.1132(193) | 50* |
![[thin space (1/6-em)]](https://www.rsc.org/images/entities/char_2009.gif) |
||||
| BIO30 | ||||
| P1 | Phonon-related | 67.0(8) | 0.0329(34) | 12.2(14) |
| P2 | Phonon-related | 80.1(14) | 0.0524(119) | 12.2* |
| B1 | δ(O–H(1)) p = 1 | 93.7(9) | 0.1340(93) | 15.9(16) |
| B2 | δ(O–H(1)) p = 1 | 110.5(11) | 0.1340* | 24.8(30) |
| C1 | δ(O–H(2)) p = 1 | 134.1(7) | 0.0904(63) | 13.3(9) |
| C2 | δ(O–H(2)) p = 1 | 149.9(6) | 0.0904* | 15.1(11) |
| D | δ(O–H(1)) p = 2 | 183.6(28) | 0.1065(133) | 50* |
A key result emerges by comparing the integrated intensities of the δ(O–H(1)) and δ(O–H(2)) modes, distinguished in Fig. 5 by green and yellow shaded area, respectively. For BIO92 and BIO76, these are (within error) the same, suggesting an almost equal occupation of protons in the H(1) and H(2) sites in these two materials. For BIO30, however, the intensity of the δ(O–H(1)) modes is about 1.5 time larger than for the δ(O–H(2)) modes, suggesting a significantly larger occupation of the H(1) site as compared to H(2) in this material. It follows that there is a preferential loss of protons on the H(2) site as the material dehydrates. Regarding the position of the bands, we observe a minor upward (blue) shift of the δ(O–H(2)) modes, as the material dehydrates, indicating a strengthening of the hydrogen bonds to the H(2) protons. We also observe a minor splitting of the δ(O–H(1)) modes, which reflects a growing asymmetry of the H(1) site. Regarding the width of the bands, we observe a decrease in the width of the δ(O–H(2)) modes, and an increase of the width of the δ(O–H(1)) modes, as the material dehydrates.
4.3 Ab initio molecular dynamics simulations
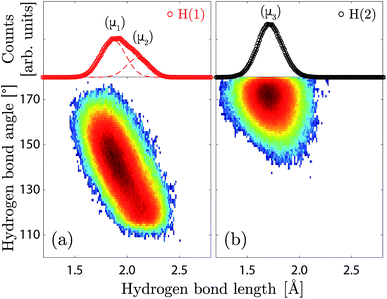
The H(1) protons are characterised by a broad and asymmetric hydrogen bond length distribution, and an extended range of hydrogen bond angles (Fig. 6a). The asymmetry of the hydrogen bond length distribution can be modelled by two Gaussian functions, which would suggest that two distinct hydrogen bonding networks are present over the H(1) site, marked as (μ1) and (μ2) in Fig. 6a, with average hydrogen bond lengths of 1.90(4) Å and 2.13(4) Å, and average hydrogen bond angles of ca. 142° and 120° respectively. Considering that the hydrogen bonds formed by the O(2)–H(1) units are calculated to be predominantly (ca. 74%) accepted by the O(1) oxygen atoms in the octahedral layer, we associate the most populated proton environment (μ1) to the O(2)–H(1)⋯O(1) pattern, and the least populated (μ2) to the O(2)–H(1)⋯O(3) pattern. The proportion of the O(2)–H(1)⋯O(1) pattern is in excellent agreement with our previous work, where we found a value 75%.10 The width and centre of the (μ1) and (μ2) distributions are found to be independent of the hydration level (Table S1†). However, the relative fraction of (μ1) protons over the H(1) site shows a clear decrease with decreasing hydration level, with a crossover to 50% at x = 0.5.
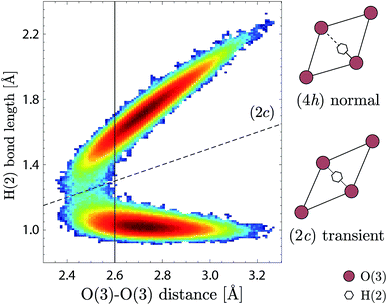
The H(2) protons (Fig. 6b) are characterised by a symmetric hydrogen bond length distribution, which is well described by a normal distribution (μ3), associated to an average hydrogen bond length of 1.71(1) Å and an average hydrogen bond angle of ∠HOH ≈ 172°. This “linear” hydrogen bond geometry is here stabilised due to the close proximity between the acceptor and donor O(3) oxygen atoms, with an average distance of dO–O = 2.713(1) Å. Fig. 7 shows the correlation between the H(2) covalent and hydrogen bond lengths and the distance between acceptor and donor O(3) oxygen atoms, in which we distinguish two regimes with a threshold at dO–O ≈ 2.6 Å. Above dO–O = 2.6 Å, which represents about 90% of the density, we observe a clear separation of the covalent and hydrogen bond lengths, as expected for a normal double-well hydrogen bond of a proton siting in the (4h) site. Below dO–O = 2.6 Å, however, we observe that a fraction of the density extends up to the dashed line marked (2c), in reference to the structural site of Fig. 1c, corresponding to the equidistant position between the acceptor and donor O(3) oxygen atoms. Considering that the (2c) site is the saddle-state of the H(2) proton transfer process, and considering that the timescale of occupation of the (2c) site is found of the order of 5–10 fs, we rationalise the fraction of H(2) in the (2c) site as transient configurations characterised by single-well hydrogen bonds. Due to the low occupation and short-lived nature of these configurations, their contribution to the vibrational dynamics is negligible.
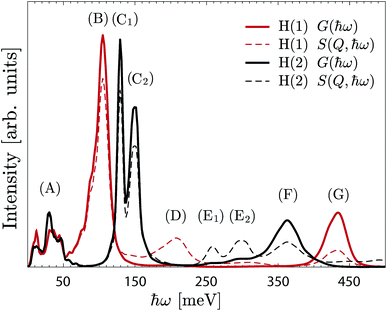 | ||
| Fig. 8 G(ħω) (continuous line) and S(Q,ħω) (dashed line) of the H(1) protons (red) and H(2) protons (black). The spectra are calculated from the AIMD trajectories for x = 1. | ||
Further information about the nature of the H(1) and H(2) protons is obtained by projecting the G(ħω) on the Cartesian coordinates (a, b, c-axes) (Fig. S3†). In particular, while the a/b- and c-components of the δ(O–H) modes, which represent the “in-plane” and “out-of-plane” wag motions, respectively, are overlapping in the case of H(1), they are clearly separated for H(2). The (C1) and (C2) bands are then assigned to the “in-plane” and “out-of-plane” δ(O–H(2)) modes, respectively.
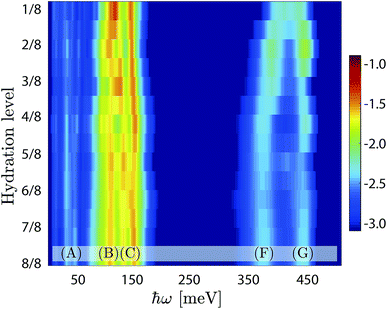
Fig. 9 shows a colour map of the evolution of G(ħω) as a function of hydration level. For the high-hydration phases, x ≥ 0.5, the spectra are overall very similar to each other, and specifically share the same characteristics as of the x = 1 material as described above, whereas for the low-hydration phases, x < 0.5, we observe a strong dependency on the hydration level (x). More specifically, the δ(O–H(2)) modes shift towards lower energy, the ν(O–H(2)) modes shift toward higher energy, whereas the δ(O–H(1)) and ν(O–H(1)) modes remain essentially unchanged, as x decreases. As no significant variations of the hydrogen bond strength of neither H(2) or H(1) protons are observed between x = 1/8 to x = 4/8 (Table S1†), we interpret the observed energy shifts as a change of the hydrogen bond geometry, from linear in the high hydration regime (cf.Fig. 3c), to increasingly bent in the low-hydration regime (cf.Fig. 3a). We emphasise that this lack of direct correlation between the hydrogen bond length and the stretch band frequency is unusual, and is rationalised here by the geometrical change of the hydrogen bonding pattern of H(2).
4.4 Comparison between the experimental and theoretical spectra
Fig. 10a compares the experimental (INS and IR) and calculated spectra of the highly-hydrated phase. As can be seen, the INS and the calculated spectra are overall in good agreement with each other, both in terms of shape and frequency of the bands. The main differences concern the frequency of the δ(O–H(1)) band, which is upward shifted by about 5 meV in the calculated spectra, and the width of the δ(O–H(2)) bands, which is found experimentally larger than the calculated one. Considering that the widths are mainly attributed to inhomogeneous broadening, the latter effect may indicate a broader distribution of H(2) hydrogen bond geometries (from a higher degree of structural variability of the O(3)–H(2) layers) than captured in the simulations. | ||
Fig. 10 (a) Combined plot of the experimental INS (black line and circles) and IR (blue line) spectra, measured on the BIO92 sample, and of the calculated scattering function of the x = 1 model (red line). (b) Close-up of the energy region of the (E) and (β) bands. The INS and IR spectra are baseline corrected, as indicated in Fig. 4. The INS and AIMD S(Q,ħω) are normalised, while the IR spectrum is scaled to comparable intensities and vertically offset for clarity. ( ) The IR spectrum of 50InBZO (green line), reproduced and adapted with permission from ref. 31, is also represented. ) The IR spectrum of 50InBZO (green line), reproduced and adapted with permission from ref. 31, is also represented. | ||
While the IR spectrum further supports the attribution of the features (F) and (G) as ν(O–H(2)) and ν(O–H(1)), respectively, it provides additional information over the 250–300 meV energy range. Since the IR technique is insensitive to the δ(O–H) modes, the IR bands (β1) and (β2), coincidentally at frequencies similar to (E1) and (E2), cannot be simply attributed to multiphonon processes. While a phenomenon such as a Fermi resonance may lead to δ(O–H) overtones to be visible in the IR spectrum, due to anharmonic interaction with the corresponding ν(O–H) modes,34,35 it is unlikely to occur here due to the large gap of 50–80 meV between the highest-energy δ(O–H(2)) p = 2 band, at about 300 meV, and the ν(O–H(2)) band, at about 350–380 meV. Furthermore, the δ(O–H) overtones are found, with a reasonable degree of accuracy, at twice the fundamental mode frequency, while under Fermi resonances the overtone frequency would be blue- or red-shifted. Thus, excluding mode coupling processes, the (β1) and (β2) bands could instead originate from fundamental modes.
In this context, we note that the simulated fundamental ν(O–H(2)) band extends towards lower energies, with weak shoulders at the energies corresponding to the (β1) and (β2) bands (Fig. 10b). This would suggest that the (β1) and (β2) bands are related to fundamental ν(O–H(2)) modes of protons in unusually strong hydrogen bonding configurations, which correlate to local environments with unusually short distances between acceptor and donor O(3) oxygen atoms (Fig. 7). A tentative assignment of all bands is reported in Table 2.
| Label | ħω [meV] | Assignment |
|---|---|---|
| A | 10–55 | Riding modes, lattice dynamics |
| P | 67–83 | Phonon-related excitations |
| B | 93–110 | (p = 1) δ(O–H(1)) |
| C1 | 126–131 | (p = 1) “in-plane” δ(O–H(2)) |
| C2 | 142–150 | (p = 1) “out-of-plane” δ(O–H(2)) |
| D | 183–204 | (p = 2) δ(O–H(1)) |
| E1 | 240–266 | (p = 2) “in-plane” δ(O–H(2)) |
| E2 | 278–308 | (p = 2) “out-of-plane” δ(O–H(2)) |
| F | 356–374 | (p = 1) ν(O–H(2)) |
| G | 418–444 | (p = 1) ν(O–H(1)) |
| β1 | 249–260 | (p = 1) ν(O–H(2)) |
| β2 | 285–297 | (p = 1) ν(O–H(2)) |
5 Discussion
By combining the vibrational spectroscopy with AIMD simulations, we have shown that the main structural and spectroscopic features of the Ba2In2O5(H2O)x phases can be captured with an oxygen-vacancy-free (high-hydration) structural model containing two types of proton sites, H(1) and H(2). The evolution of an almost equal occupation of protons in the H(1) and H(2) sites at high levels of hydration (x > 0.5), to a predominance of protons in the H(1) site at lower levels of hydration point towards a preferential dehydration of protons on the H(2) sites upon dehydration of the material. This result is in full accordance with our previous study of the hydration processes of the same material, using variable temperature Raman spectroscopy.10In further detail, the new finding that the hydrogen bond length distribution of the H(1) protons can be adequately described by two normal distributions (Fig. 6a) can be interpreted as the coexistence of two types of proton environments over the H(1) site, characterised by hydrogen bond lengths of 1.90(4) and 2.13(4) Å, respectively, and associated to hydrogen bonds accepted by O(1) and O(3) oxygen atoms, respectively. This result is in agreement with the findings of Dervişoğlu et al.,14 who observed, using multinuclear solid state NMR spectroscopy, the presence of two types of H(1) protons, with shorter and longer hydrogen bonds, respectively. In particular, they calculated four low-energy configurations corresponding to distinct hydrogen bonding patterns in the O(2)–H(1) layer, and hypothesised that these four configurations may coexist as no clear groundstate was predicted.14
The coexistence of two types of proton environments over the H(1) site can be rationalised when considering the displacement amplitude of the O(1) and O(3) acceptor oxygen atoms, away from their respective planes, under the pull of the hydrogen bonds formed with H(1), as illustrated in Fig. 11a. These displacements are calculated in the range of 0.1–0.3 Å for O(3) and 0.4–0.5 Å and 0.6–0.7 Å for O(1), when pulled by the hydrogen bond of a single proton, or by the two hydrogen bonds of paired protons, respectively. This difference between O(1) and O(3) may originate from the tendency of the O(2)–H(1) covalent bond to align on the edges of the O(1)-layer octahedron rather than of the O(3)-layer (see Fig. 11b). Additionally, the inter-octahedral hydrogen-bond geometries of the H(2) protons may hinder out-of-plane displacements of the O(3) oxygen atoms. Regardless, the larger displacement of O(1) is consistent with the shorter hydrogen bond length observed for the O(2)–H(1)⋯O(1) pattern.
Regarding the effect of dehydration on the local structural properties of BIO, the AIMD calculations show a clear modification of G(ħω) for x < 0.5 (Fig. 9), however this is not seen experimentally. This discrepancy can be rationalised considering the propensity of the oxygen vacancies to segregate and the repulsion between protons and oxygen vacancies, which may induce heterogeneities in the real material. We suggest that, in partially-hydrated phases, the protons segregate in oxygen-rich hydrogen-rich domains that maintain the pseudo-cubic structure characteristic of the fully-hydrated materials. In view of the material's proton transport properties, such as phase-separation points toward complex dynamics featuring a highly anisotropic (non-three-dimensional) proton conduction mechanism in partially hydrated phases. In this context, we note the extension of the H(2) proton distribution from the (4h) site up to the (2c) site (Fig. 7), and the large hydrogen-bond angles associated to its geometry (Fig. 6b), indicate that the H(2) proton has a propensity for proton transfer along its hydrogen bond, with a jump distance estimated at only 0.4–0.5 Å. Conversely, the hydroxide rotation bringing H(2) out of the O(3) layer is expected to be the rate limiting step, as it requires to break the strong hydrogen bond formed by H(2). Concerning the H(1) protons, while the stronger hydrogen bonding of the O(2)–H(1)⋯O(1) pattern suggests a preferential proton transfer toward O(1) rather than O(3), the proton pairing behaviour may hinder this proton transfer process. Indeed, would a proton transfer event occur for one of the paired protons toward O(1) or O(3), as illustrated in Fig. 11c by the arrow from the positions 1 to 1′, the resulting proton–proton distance would shorten from 2.4 Å (distance between positions 1 and 2) to 1.9 Å (between 1′ and 2). A more rational scenario is obtained when considering that the proton pair is first broken by an hydroxide rotation motion (arrow from 2 to 2′), then followed by the proton transfer (1 to 1′), which lead to a proton–proton distance of 2.6–2.8 Å (between 1′ and 2′). Similarly, the proton pairing may also be detrimental to the H(1) hydroxide rotation step. As paired protons are energetically favourable, it results that the four proton sites surrounding O(2) are energetically non-equivalent, which implies that the degeneracy expected from the fourfold symmetry of the (16l) crystallographic description of the H(1) proton site is broken at the local scale. The increased stability of paired protons may then act as an additional energy barrier to overcome for the hydroxide rotation motion to occur. Nevertheless, a few hydroxide rotation events of H(1) are observed in the course of the AIMD at T = 300 K, which suggest that the energy barrier for this motion is fairly low. Overall, considering that reduced crystal symmetry generally leads to reduced proton conducting properties,6,36,37 and considering the apparent complexity of the diffusion mechanism in Ba2In2O5(H2O)x, we expect the proton conducting properties of Ba2In2O5(H2O)x to be inferior of those of related high-symmetry perovskite materials.
The vibrational spectra of the highly-hydrated Ba2In2O5(H2O)x phases is as well useful for the assignment of the vibrational spectra of related acceptor-doped perovskite oxides. In particular, we note that the IR spectrum of BIO92 is similar to that of In-doped barium zirconate materials (BaInyZr1−yO3Hy, y ≥ 0.25).31,38 The spectrum of the 50% In-doped barium zirconate (50In/BZO) is included in Fig. 10 for comparison. A key observation is that the peak shape and relative peak intensity of the (β1) and (β2) bands are strikingly similar between BIO92 and 50In/BZO, and let us wonder if they could originate from similar proton local environments. For Ba2In2O5(H2O)x, these bands are assigned as fundamental O–H(2) stretch modes with extremely short distances between acceptor and donor oxygen atoms, dO–O ≤ 2.6 Å. It should be noted that while the high IR intensity of the (β1) and (β2) bands may be related to a nonlinear increase of the IR cross section with increasing hydrogen bond strength, their presence are puzzling in 50In/BZO, allegedly free from H(2)-type protons.31,39,40 An explanation could be that converse to the scenario of a perfect mixture of Zr and In atoms over the B site, as modelled in ref. 31, the real material contains heterogeneities. For instance, the presence of indium-rich domains, characterised by pronounced tilting of the InO6 octahedra as observed in the pseudo-cubic layer of the brownmillerite, would effectively stabilise H(2)-type protons in 50In/BZO. Note that the presence of distortions resembling the brownmillerite structure on a local level has been indeed reported for 50In/BZO and 75In/BZO, even in the lack of long-range arrangements over the B-site.41
6 Conclusions
In conclusion, we have shown that Ba2In2O5(H2O)x (x = 0.30, 0.76, and 0.92) exhibits two main types of proton sites; H(1), which is characterised by the coexistence of two intra-octahedral hydrogen-bond geometries, and H(2), which is characterised by inter-octahedral hydrogen bonding interactions specific to the symmetry of the hydrated brownmillerite structure. While the strength of the hydrogen bonding is similar for the majority of protons in the two proton sites, a small fraction (≈10%) of the H(2) protons forms unusually strong hydrogen bonds, which is manifested as two very-low-frequency O–H stretch bands in the IR absorbance spectra. The observation of similar features in the IR spectra of indium-doped BaZrO3 materials suggests a propensity of indium atoms to segregate and locally form domains with brownmillerite-like distortions, thus stabilising a fraction of H(2)-type proton sites in these materials. Further, the vibrational spectra of Ba2In2O5(H2O)x, with x = 0.30, 0.76, and 0.92, show a minor evolution as a function of x, which is interpreted as a tendency for the protons to segregate into oxygen-rich hydrogen-rich domains upon dehydration. This points toward a complex, anisotropic (non-three-dimensional) proton conduction mechanism in partially hydrated phases. This insight motivates efforts to identify ways to avoid phase separation, perhaps by suitable cation substitutions, as a route to achieve higher proton conductivity. It also has a direct link to solid oxide fuel cells in actual operations that need to be periodically taken into and out of service (i.e., hydrated and dehydrated).Conflicts of interest
There are no conflicts to declare.Acknowledgements
M. K. thanks the Swedish Research Council for funding (grant No. 2010-3519 and 2011-4887). The Institut Laue-Langevin is thanked for access to neutron beam facilities. Simulations were performed on resources provided by the Swedish National Infrastructure for Computing (SNIC) at PDC Centre for High Performance Computing (PDC-HPC).References
- H. Malerød-Fjeld, D. Clark, I. Yuste-Tirados, R. Zanón, D. Catalán-Martinez, D. Beeaff, S. H. Morejudo, P. K. Vestre, T. Norby, R. Haugsrud, J. M. Serra and C. Kjølseth, Nat. Energy, 2017, 2, 923–931 CrossRef.
- S. H. Morejudo, R. Zanón, S. Escolástico, I. Yuste-Tirados, H. Malerød-Fjeld, P. K. Vestre, W. G. Coors, A. Martínez, T. Norby, J. M. Serra and C. Kjølseth, Science, 2016, 353, 563–566 CrossRef CAS PubMed.
- C. Duan, J. Tong, M. Shang, S. Nikodemski, M. Sanders, S. Ricote, A. Almansoori and R. O'Hayre, Science, 2015, 349, 1321–1326 CrossRef CAS PubMed.
- J. A. Kilner and M. Burriel, Annu. Rev. Mater. Res., 2014, 44, 365–393 CrossRef CAS.
- L. Malavasi, C. A. J. Fisher and M. S. Islam, Chem. Soc. Rev., 2010, 39, 4370–4387 RSC.
- K. Kreuer, Annu. Rev. Mater. Res., 2003, 33, 333–359 CrossRef CAS.
- A. Jayaraman, A. Magrez, M. Caldes, O. Joubert, M. Ganne, Y. Piffard and L. Brohan, Solid State Ionics, 2004, 170, 17–24 CrossRef.
- S. A. Speakman, J. W. Richardson, B. J. Mitchell and S. T. Misture, Solid State Ionics, 2002, 149, 247–259 CrossRef CAS.
- P. Berastegui, S. Hull, F. J. García-García and S.-G. Eriksson, J. Solid State Chem., 2002, 164, 119–130 CrossRef CAS.
- J. Bielecki, S. F. Parker, L. Mazzei, L. Börjesson and M. Karlsson, J. Mater. Chem. A, 2016, 4, 1224–1232 RSC.
- J. Bielecki, S. F. Parker, D. Ekanayake, S. M. H. Rahman, L. Börjesson and M. Karlsson, J. Mater. Chem. A, 2014, 2, 16915–16924 RSC.
- J.-R. Martinez, C. E. Mohn, S. Stølen and N. L. Allan, J. Solid State Chem., 2007, 180, 3388–3392 CrossRef CAS.
- A. Jayaraman, A. Magrez, M. Caldes, O. Joubert, F. Taulelle, J. Rodriguez-Carvajal, Y. Piffard and L. Brohan, Solid State Ionics, 2004, 170, 25–32 CrossRef.
- R. Dervişoğlu, D. S. Middlemiss, F. Blanc, Y.-L. Lee, D. Morgan and C. P. Grey, Chem. Mater., 2015, 27, 3861–3873 CrossRef.
- M. Jiménez-Ruiz, A. Ivanov and S. Fuard, J. Phys.: Conf. Ser., 2014, 549, 012004 CrossRef.
- D. Richard, M. Ferrand and G. J. Kearley, J. Neutron Res., 1996, 4, 33–39 CrossRef.
- H. Schober, J. Neutron Res., 2014, 17, 109–357 CAS.
- G. Kresse and J. Hafner, Phys. Rev. B, 1993, 48, 13115–13118 CrossRef CAS PubMed.
- G. Kresse and J. Hafner, Phys. Rev. B, 1994, 49, 14251–14269 CrossRef CAS PubMed.
- G. Kresse and J. Furthmüller, Comput. Mater. Sci., 1996, 6, 15–50 CrossRef CAS.
- G. Kresse and J. Furthmüller, Phys. Rev. B, 1996, 54, 11169–11186 CrossRef CAS PubMed.
- P. E. Blöchl, Phys. Rev. B, 1994, 50, 17953–17979 CrossRef PubMed.
- G. Kresse and D. Joubert, Phys. Rev. B, 1999, 59, 1758–1775 CrossRef CAS.
- J. P. Perdew, K. Burke and M. Ernzerhof, Phys. Rev. Lett., 1996, 77, 3865–3868 CrossRef CAS PubMed.
- S. Nosé, J. Chem. Phys., 1984, 81, 511–519 CrossRef.
- S. Nosé, Prog. Theor. Phys. Supp., 1991, 103, 1–46 CrossRef.
- D. M. Bylander and L. Kleinman, Phys. Rev. B, 1992, 46, 13756–13761 CrossRef PubMed.
- G. Goret, B. Aoun and E. Pellegrini, J. Chem. Inf. Model., 2017, 57, 1–5 CrossRef CAS PubMed.
- A. Piovano, A. Perrichon, M. Boehm, M. R. Johnson and W. Paulus, Phys. Chem. Chem. Phys., 2016, 18, 17398–17403 RSC.
- M. P. Allen and D. J. Tildesley, Computer simulation of liquids, Claredon Press, Oxford, 1987 Search PubMed.
- L. Mazzei, A. Perrichon, A. Mancini, G. Wahnström, L. Malavasi, S. F. Parker, L. Börjesson and M. Karlsson, J. Mater. Chem. A, 2019, 7, 7360–7372 RSC.
- G. Busca, V. Buscaglia, M. Leoni and P. Nanni, Chem. Mater., 1994, 6, 955–961 CrossRef CAS.
- F. A. Miller and C. H. Wilkins, Anal. Chem., 1952, 24, 1253–1294 CrossRef CAS.
- A. A. Kananenka and J. L. Skinner, J. Chem. Phys., 2018, 148, 244107 CrossRef PubMed.
- J. M. Rodgers, R. M. Abaskharon, B. Ding, J. Chen, W. Zhang and F. Gai, Phys. Chem. Chem. Phys., 2017, 19, 16144–16150 RSC.
- K. Kreuer, S. Adams, W. Münch, A. Fuchs, U. Klock and J. Maier, Solid State Ionics, 2001, 145, 295–306 CrossRef CAS.
- A. S. Nowick, Y. Du and K. C. Liang, Solid State Ionics, 1999, 125, 303–311 CrossRef CAS.
- M. Karlsson, A. Matic, E. Zanghellini and I. Ahmed, J. Phys. Chem. C, 2010, 114, 6177–6181 CrossRef CAS.
- A. Lindman, T. S. Bjørheim and G. Wahnström, J. Mater. Chem. A, 2017, 5, 13421–13429 RSC.
- A. Lindman, E. E. Helgee and G. Wahnström, Chem. Mater., 2017, 29, 7931–7941 CrossRef CAS.
- F. Giannici, A. Longo, A. Balerna, K. D. Kreuer and A. Martorana, Chem. Mater., 2009, 21, 2641–2649 CrossRef CAS.
Footnote |
| † Electronic supplementary information (ESI) available. See DOI: 10.1039/c9ta04056k |
| This journal is © The Royal Society of Chemistry 2019 |


![[c with combining right harpoon above (vector)]](https://www.rsc.org/images/entities/i_char_0063_20d1.gif)
