 Open Access Article
Creative Commons Attribution 3.0 Unported Licence
Water oxidation catalysis on reconstructed NaTaO3 (001) surfaces†
Hassan
Ouhbi
and
Ulrich
Aschauer
 *
*
Department of Chemistry and Biochemistry, University of Bern, Bern, Switzerland. E-mail: ulrich.aschauer@dcb.unibe.ch
First published on 1st July 2019
Abstract
Polar perovskite oxide surfaces are subject to structural reconstruction as a possible stabilisation mechanism, which changes the surface structure and hence the surface chemistry. To investigate this effect, we study the oxygen evolution reaction (OER) on two possible reconstructed (001) surfaces of NaTaO3, by means of density functional theory (DFT) calculations and compare them with the non-polar (113) surface of the same material. For the clean surface the reconstruction has a beneficial effect on the catalytic activity, lowering the minimal overpotential from 0.88 V to 0.70 V while also changing the most active reaction site from Na to Ta. Under photocatalytic conditions, the Ta sites are covered by oxygen adsorbates, rendering lattice oxygen sites on the NaO terrace the most active with a very low overpotential of 0.32 V. An alternative reconstructed surface which is stable in contact with water leads to an oxygen coupling mechanism with an overpotential of 0.52 V. Our results show that terraced surface reconstruction enables novel reaction pathways with low overpotentials which did not exist on previously investigated non-polar NaTaO3 surfaces or on non-polar surfaces of chemically similar materials such as SrTaO2N.
1 Introduction
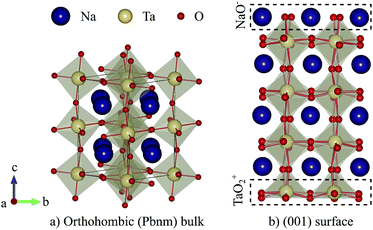
Among perovskite structured tantalates, sodium tantalate NaTaO3 has received much attention for photocatalytic water splitting due to its outstanding quantum and photocatalytic efficiency1,2 as well as suitable band-edge positions.3 In this material the larger A-site cation (Na) is 12-fold coordinated by oxygen and located at the corners of a pseudocubic unit cell, while the center of this cell is occupied by a smaller B-site cation (Ta) that is octahedrally coordinated by oxygen (see Fig. 1a). For NaTaO3, the formal charges of Na, Ta, and O are +1, +5 and −2 respectively. Consequently, the (001) surface is formed by stacking of charged TaO2 and NaO layers, with formal charges of +1 and −1 respectively (see Fig. 1b). The surface is hence of type III in Tasker's classification4 and is polar and unstable due to its diverging electrostatic energy.5 Such an instability can be compensated either by adsorption of charged species or electronic or ionic reconstruction.6,7While the atomic structure of NaTaO3 surfaces has to the best of our knowledge not been investigated experimentally and only sparsely by theory,8,9 a closely related compound KTaO3 has been investigated much more intensively. Secondary ion mass spectrometry revealed a gradual K enrichment of cleaved (001) surfaces which was interpreted as a bulk to surface migration of K atoms.10 A similar evolution of the surface was observed by helium atom diffraction, where an almost equal proportion of TaO2 and KO terminations right after cleaving gradually converted to a pure KO termination.11 Supported by density functional theory (DFT) calculations,12 the authors postulate a terraced surface structure and the migration of K atoms to KO step edges which leads to the disappearance of the TaO2 termination.11,13 An ionic reconstruction with alternating KO and TaO2 rows is also supported by more recent DFT calculations,14 while other calculations reported a purely electronic reconstruction and a transition from a KO to TaO2 terminated surface when changing from oxygen-poor to oxygen-rich conditions.15 The terraced surface structure of KTaO3 is supported by a recent scanning tunneling and atomic force microscopy study combined with DFT calculations.16 While the cleaved surface exposes TaO2 and KO terminated terraces that follow the domain pattern of the incipient ferroelectricity in this material, annealing ultimately converts it into a labyrinth-like structure of alternating TaO2 and KO terminated terraces running along the [110] direction. The surface energy was determined to be minimal for terrace widths of 4–5 unit cells. After exposure to liquid water, the same authors found another type of structure consisting of [001] oriented alternating single unit-cell rows of KO termination that are stabilized by dissociative water adsorption,16 which was confirmed by another theoretical study.9
Given the similarity in the ionic and electronic structure of NaTaO3 and KTaO3 (the compounds are isostructural and isoelectronic, with NaTaO3 having stronger octahedral rotations due to the smaller Na ion), it seems sensible that NaTaO3 will assume a surface reconstruction similar to that of KTaO3 to compensate polarity. Significantly lower surface energies compared to the non-reconstructed terminations were reported for the terraced reconstructed surfaces of both NaTaO3 and KTaO3 with terrace widths of 3 cells.9 However for both materials the so-called cation-exchange reconstruction was reported to be even lower in energy, the formation of which may however be kinetically hindered9 leading to the experimentally reported prevalence of the terraced reconstruction for KTaO3.16 Due to the larger driving force, the appearance of the cation-exchange reconstruction is more likely for NaTaO3 than KTaO3 (ref. 9) but due to a lack of experimental data it is yet unclear if the kinetic barriers also retain the terraced reconstruction for the former material. For this reason we work here under the assumption of a terraced reconstruction for NaTaO3 also.
Surface features such as step edges appearing on this reconstruction are known to affect the surface chemistry of oxides. As such it was recently shown that stepped RuO2 (110) surfaces are less active for the oxygen evolution reaction (OER) compared to flat oxygen-terminated surfaces.17 For hematite Fe2O3 on the other hand, the surface orientation was shown to have a much stronger effect on the OER overpotential than the reaction sites at different positions with respect to step edges.18 It is thus unclear what effect the terraced surface structure of NaTaO3 will have on the photocatalytic OER activity. For this reason, we compare, by means of DFT calculations, the OER activity of the reconstructed terraced (001) surface with the one of the non-polar (113) surfaces already investigated in our previous work.19 For the clean surface, stable at low potentials, we find Ta sites at the center of the terrace on the reconstructed (001) surface to be the most active. At higher potentials relevant for photocatalytic applications, the surfaces are covered with O adsorbates and we find a lattice-oxygen mechanism at the center of the NaO terraces to be the most active with a very low overpotential of 0.32 V. These results show that the reconstructed surface structure enables reaction pathways that are not favorable on alternative non-polar surface orientations or on non-polar surfaces of chemically similar materials such as SrTaO2N.
2 Methods
Density functional theory calculations were performed with the Quantum ESPRESSO package,20 using the Perdew–Burke–Ernzerhof (PBE) exchange correlation functional.21 Ultrasoft pseudopotentials22 with Na(2s, 2p, and 3s), Ta(5s, 5p, 5d, and 6s) and O(2s and 2p) valence states were used to describe electron–nuclear interactions and wave functions were expanded in plane waves up to a kinetic energy cutoff of 40 Ry combined with 320 Ry for the augmented density.Surface slabs were constructed based on an experimental orthorhombic NaTaO3Pbnm perovskite structure23 that was fully relaxed at the PBE level of theory. The reconstructed (001) surface with terraces of width w = 4 running along the [110] direction was modeled with an 8 atomic layer thick slab (4NaO and 4TaO2, see the ESI† Section S1 for convergence of various quantities with respect to the slab thickness) with lateral dimensions 5.49 × 22.20 Å, from which half of the topmost NaO layer has been moved to the bottom surface of the slab. Non-reconstructed surfaces are built as asymmetric stoichiometric slabs with the same number of atomic layers as the reconstructed slab. Periodic images of the slab are separated by a vacuum of 15 Å along the surface normal direction, and the bottom two atomic layers and the moved NaO half layer were fixed at bulk positions. In addition, a dipole correction24 was applied along the z-direction for all slab calculations. Reciprocal-space integration was performed with a 4 × 1 × 1 Monkhorst–Pack mesh.25 The structures were relaxed with a threshold of 10−3 eV Å−1 and 10−6 eV for forces and total energies respectively.
We characterise the stability of a surface by its surface energy, which, for the stoichiometric slabs in this study, is given by
 | (1) |
All reactions energies ΔG(Ub, pH) at given pH and potential (Ubvs. SHE) were calculated using the computational standard hydrogen electrode approach:26
 | (2) |
![[thin space (1/6-em)]](https://www.rsc.org/images/entities/char_2009.gif) ln(10)pH account for the electron and proton reservoirs respectively and ΔZPE and ΔS are the changes in the zero point energy and entropy respectively of the reaction step as given in our previous paper.19 We characterize the OER activity of a given surface by its thermodynamic overpotential η, which is the potential for which all PCET steps have free-energy changes smaller than the equilibrium potential of 1.23 V:
ln(10)pH account for the electron and proton reservoirs respectively and ΔZPE and ΔS are the changes in the zero point energy and entropy respectively of the reaction step as given in our previous paper.19 We characterize the OER activity of a given surface by its thermodynamic overpotential η, which is the potential for which all PCET steps have free-energy changes smaller than the equilibrium potential of 1.23 V: | (3) |
3 Results and discussion
3.1 Surface reconstruction
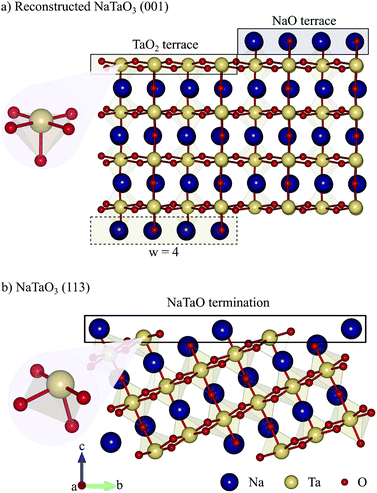
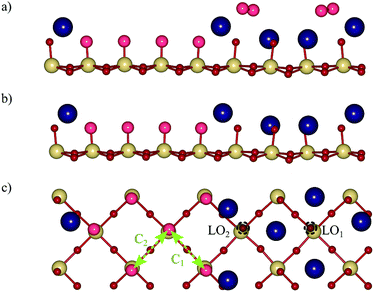
For the reconstructed NaTaO3 (001) surface with a terrace width w = 4 as shown in Fig. 2a, we predict a surface energy of 1.20 J m−2 (see Table 1), which is very similar to the previously reported 1.17 J m−2 for w = 3.9 Comparing this to the surface energies of the non-reconstructed (001) surfaces as well as the alternative cation-exchange reconstruction and higher index non-polar (113) surface,19 we find the NaO-terminated (001) surface to be the least stable followed by the reconstructed (001) and the TaO2-terminated (001) surface and the formally non-polar (113) surface (see Fig. 2b), with the cation-exchange reconstruction being the most stable one (see Table 1). While the high energy of the NaO-terminated surface is not surprising, given the sequence of formally charged layers, the relatively low energy of the TaO2-terminated surface is unexpected. We however believe it to be an artefact of the rather thin slabs used in this study as higher surface energies were reported for thicker slabs.9 The surface energy used here for the cation exchange reconstruction is slightly higher than the previously reported 0.88 J m−2,9 which could be due to differences in the computational setup or the scheme for computing surface energies. While it is still larger than the differences reported for KTaO3,9,14 this smaller surface energy difference will lead to enhanced kinetic stabilization27,28 compared to these previous predictions, thus making the appearance of the terraced reconstruction more likely. In the absence of experimental data for the NaTaO3 (001) surface we thus work under the assumption of kinetic hindering of the cation-exchange reconstruction and consider the kinetically easier terraced reconstruction. The reconstructed (001) surface and the (113) surface both have low surface energies with a difference of only 0.08 J m−2 and could both be exposed. As shown in Fig. 2, these two surfaces differ in the coordination of their exposed Ta sites, which is square pyramidal (Ta5c) coordinated on the reconstructed (001) surface but distorted tetrahedral coordinated (Ta4c) on the (113) surface.| Surface | Surface energy (J m−2) |
|---|---|
| Reconstructed (001) | 1.20 |
| NaO-terminated (001) | 1.77 |
| TaO2-terminated (001) | 1.17 |
| Cation-exchange reconstruction (001) | 0.95 |
| NaTaO-terminated (113) | 1.12 |
3.2 OER on clean surfaces
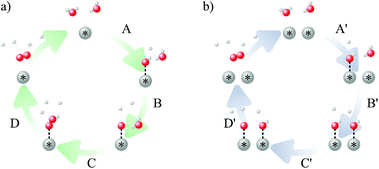
To study the effect of surface reconstruction on the OER activity, we computed free energy differences for the reaction steps on the reconstructed (001) surface. Among the reaction mechanisms reported in the literature, we adopt the conventional one,29 which is a succession of four proton-coupled electron transfer reaction steps as shown schematically in Fig. 3a. In the first step a water molecule is deprotonated and forms an adsorbed hydroxyl *OH, which is then deprotonated to form an adsorbed oxygen *O. When in contact with water, a further deprotonation step leads to an adsorbed hydroperoxyl group *OOH, which is released as O2 after a final deprotonation step as shown in eqn (4)–(7): | (4) |
 | (5) |
 | (6) |
 | (7) |
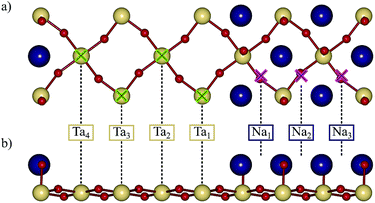 | ||
| Fig. 4 On-top Ta and bridging Na adsorption sites on the reconstructed (001) surface from (a) top and (b) side view. Only the surface layer is shown for clarity. | ||
In Table 2 we report the adsorption energy of the OER adsorbates and the resulting overpotential for all non-equivalent Ta and Na sites on the reconstructed (001) surface. We note that the site-symmetry is broken due to the combination of octahedral rotations and the step edge. The adsorption free energy with respect to water and hydrogen was computed as
 | (8) |
| Site | ΔGOH (eV) | ΔGO (eV) | ΔGOOH (eV) | η (V) |
|---|---|---|---|---|
| Ta1 | 0.11 | 1.45 | 3.54 | 0.80 |
| Ta2 | 0.23 | 1.72 | 3.65 | 0.70 |
| Ta3 | 0.23 | 1.72 | 3.66 | 0.71 |
| Ta4 | 0.07 | 1.46 | 3.47 | 0.78 |
| Na1 | 1.36 | 4.09 | 4.06 | 1.50 |
| Na2 | 1.44 | 4.03 | 4.44 | 1.36 |
| Na3 | 1.38 | 4.08 | 4.44 | 1.47 |
Fig. 5a shows the OER free energy profile at the Ta2 site of the reconstructed (001) surface, comparing it with one for the Ta site on the (113) surface.19 While step C is the ODS for both surfaces, the Ta2 site of the reconstructed surface is more active for the OER (η = 0.70 V) than its counterpart on the (113) surface (η = 1.30 V). This is consistent with the adsorption strength of the O intermediate, which is less positive (stronger) on the (113) surface (ΔGO = 0.86 eV) compared to the reconstructed (001) surface (ΔGO = 1.72 eV). The difference in activity is likely a result of the different coordination of the Ta site. For both surfaces we observe an upward relaxation of the Ta site upon O adsorption, increasing the Ta–O bond length to an oxygen below the surface from 1.83 Å to 2.52 Å (Δl = 0.69 Å) for the reconstructed surface and from 1.90 Å to 2.88 Å (Δl = 0.98 Å) for the (113) surface. The 4-fold coordination on the (113) surface thus results in a higher structural flexibility and thus a stronger adsorption compared to the 5-fold coordinated Ta on the reconstructed (001) surface (see Fig. 2). Recently an overpotential of 1.43 V was reported for the non-reconstructed polar TaO2 terminated (100) surface of NaTaO3 with the ODS being step C,31 which indicates that the reconstruction has a beneficial effect on the OER activity.
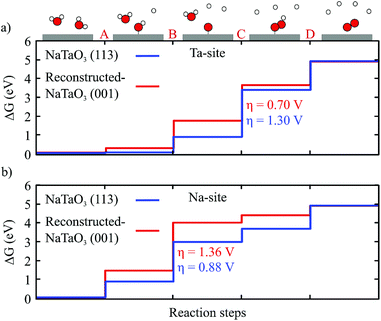 | ||
| Fig. 5 Free energy diagram at pH = 0 and Ub = 0 V of the OER reaction steps at the most active (a) Ta site and (b) Na site of the reconstructed (001) surface. The profiles on the (113) surface19 are shown for comparison. | ||
On the NaO terrace, we find bridge adsorption sites to be the most favoured (see Fig. 4). As shown in Table 2 the difference in adsorption energies of the intermediates is fairly small for the three Na sites and results in a difference in the overpotential of about 0.1 V, with the ODS being the deprotonation of OH (step B) in all cases. The Na2 site at the center of the terrace has a lower overpotential (1.36 V) than Na1 and Na3 sites which are more towards the edge of the terrace. Compared with the (113) surface, which has the same ODS (step B), we find that the most active Na sites on the reconstructed (001) surface have a significantly higher overpotential (1.36 V) than the (113) surface (0.88 V).19
3.3 OER under operating conditions
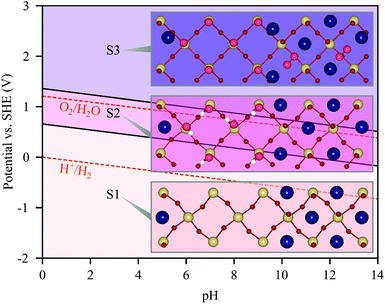
Next, we determine the surface adsorbate coverage on the reconstructed (001) surface as a function of the potential by computing Pourbaix diagrams as shown in Fig. 6. We explored covering the TaO2 and NaO terraces with O and OH adsorbates separately at coverages ranging from 1/4 to 1 monolayer (ML) as well as configurations where both terraces are covered simultaneously. The clean surface is only exposed at potentials below 0.76 V at pH 0, before it becomes OH covered on the TaO2 terrace and ultimately O covered on both terraces for potentials greater than 1.32 V. For the (113) surface,19 we found a similar sequence of transitions, however at slightly lower potentials (0.66 and 0.99 V) and with an intermediate 1 ML O coverage on just the Ta sites. Interestingly, we observe a recombination of adjacent O adsorbed on Na sites for both surfaces (see state S3 in Fig. 6 and 7a).Solar irradiation is expected to yield potentials above 1.32 V and we thus consider state S3 in Fig. 6 as relevant under application conditions. Given that the O2 formed on the NaO terrace is not bound to the surface, we remove it and consider a full O coverage only on the TaO2 terrace as shown in the side and top views in Fig. 7b and c. We compute the OER on Ta sites, initially considering the conventional mechanism (Fig. 3a) starting with the formation of *OOH on a preexisting *O adsorbate (step C). We find an overpotential of 1.11 V at the step sites Ta1 and Ta4, while the terrace sites Ta2 and Ta3 have an overpotential of 1.31 V. These overpotentials are higher than the ones reported above for the clean surface and the ODS changes from step C (OOH formation) on the clean surface to step B (O formation) on the S3 surface (see the ESI† Fig. S4a). These results are in contrast to the usual effect of an increased adsorbate coverage leading to lower overpotentials32 which we also observed for the (113) surface (1.30 V → 0.92 V). A potential explanation for this effect is that the adsorbate coverage partially conceals the structural reconstruction, with the O covered Ta terrace being an intermediate between a TaO2 and a NaO termination.
In addition to the conventional mechanism at Ta sites, we also consider an alternative mechanism that proceeds by direct coupling of O adsorbates at adjacent sites (see Fig. 3b).26,33 While this mechanism was not possible on the (113) surface19 due to a large distance of 5.47 Å between Ta sites, the (001) surface has shorter Ta–Ta distances of ∼3.87 Å. We consider coupling between the sites marked with C1 and C2 arrows in Fig. 7c and find overpotentials of 0.88 V and 0.95 V respectively, with the deprotonation of the first OH (step C′) being the ODS in both cases (see the ESI† Fig. S4b).
On the NaO terrace, we consider both the conventional mechanism and coupling of neighboring O adsorbates and find both mechanisms to have the same overpotential of 1.11 V with the formation of *OH as the ODS. The (113) surface on the other hand had a significantly lower overpotential of 0.79 V for the coupling mechanism.19 In addition, we notice a tendency for OH and O adsorbates on the NaO terrace to migrate away from the bridge site and to bind with lattice oxygen. We observed this neither on the NaTaO3 (113) nor the SrO-terminated SrTaO2N (001) surface,19 indicating a particular behaviour of the reconstructed NaTaO3 (001) surface. For this reason we investigate a lattice oxygen evolution reaction (LOER) mechanism34,35 at sites LO1 and LO2 marked in Fig. 7c. We find overpotentials of 0.32 V and 1.09 V respectively, with step D (recovery of lattice oxygen by deprotonation of OH at the LO site) being the ODS for both sites (see the ESI† Fig. S4c), and the OOH intermediate being unstable, transfering its H to a neighboring oxygen.
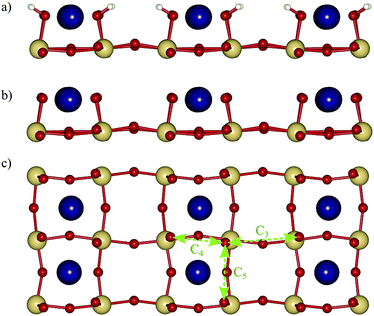
Above, we discussed the OER on the reconstructed surface as observed under ultra-high vacuum (UHV) conditions.16 However in the same study the authors report a second reconstruction with 2 × 1 periodicity that is based on hydroxylated steps running along the [100] direction which is formed after exposing the surface to water and confirmed in a later study.9 We also consider the OER on this reconstruction (shown in Fig. 8a), which experimentally coexists with the one considered in the previous section.16 We however assume that under photocatalytic conditions, the hydroxyls are deprotonated as shown in Fig. 8b and c. While this surface would not appear in the Pourbaix diagram (Fig. 6), its experimentally observed stabilisation is likely due to favorable interactions with explicit water9 that we do not consider here. Given the stepped structure of the surface, the conventional mechanism starting from an O at the step edge, can also be considered equivalent to the above LOER pathway on the NaO terrace. For this mechanism, we compute an overpotential of 0.64 V with step C (OOH formation) being the ODS. Analogous to what was shown above for the UHV reconstruction, the recombination of neighboring oxygen adsorbates represents an alternative pathway. We consider coupling of oxygen adsorbates from adjacent steps (pathway C3), across a step (pathway C4) and along the step edge (pathway C5) as shown in Fig. 8c. We find the lowest overpotential of 0.52 V for pathway C3, which does not involve interactions with Na atoms during coupling, while pathways C4 and C5 both have a higher overpotential of 0.63 V. These coupling pathways may be associated with additional kinetic barriers,29 which for the C3 pathway we evaluate to be 0.31 eV (ESI† Fig. S5), which will still allow for rapid reaction kinetics at room temperature.
4 Conclusion
We have studied the OER activity on terraced reconstructed (001) surfaces of NaTaO3 by DFT calculations. While these terraced reconstructions do not have the lowest surface energy, lower-energy reconstructions could be kinetically hindered. On the clean UHV reconstructed surface we find the most active Ta and Na sites to have overpotentials of 0.70 and 1.36 V respectively. Compared to our previous results for NaTaO3 (113),19 this implies that the Ta site is significantly more reactive on the reconstructed (001) surface, while the Na site is less reactive. Under photocatalytic conditions, the Ta sites are covered by O adsorbates, which leads to high overpotentials of ∼1.1 V. The adsorbate coverage however also results in a change in the OER mechanism on the NaO terrace, where instead of the conventional mechanism, we now find a lattice oxygen evolution mechanism to be the most active with a very small overpotential of 0.32 V. On an alternative reconstructed surface which was reported to be stable upon exposure to water, we find a coupling mechanism between adjacent rows to be the most active with an overpotential of 0.52 V. These results show a high sensitivity of the OER activity on the surface orientation and concomitant reconstructions of the same material. Moreover we show how different reconstructions of the same surface orientation can lead to dramatically different OER mechanisms and very different activities.Conflicts of interest
There are no conflicts to declare.Acknowledgements
This work was funded by the SNF Professorship Grant PP00P2_157615. Calculations were performed on UBELIX (http://www.id.unibe.ch/hpc), the HPC cluster at the University of Bern.Notes and references
- E. Grabowska, Appl. Catal., B, 2016, 186, 97–126 CrossRef CAS.
- B. Modak and S. K. Ghosh, J. Phys. Chem. C, 2016, 120, 6920–6929 CrossRef CAS.
- B. Modak, K. Srinivasu and S. K. Ghosh, Phys. Chem. Chem. Phys., 2014, 16, 17116–17124 RSC.
- P. W. Tasker, J. Phys. C: Solid State Phys., 1979, 12, 4977–4984 CrossRef CAS.
- C. Noguera, J. Phys.: Condens. Matter, 2000, 12, R367–R410 CrossRef CAS.
- C. Noguera and J. Goniakowski, Chem. Rev., 2013, 113, 4073–4105 CrossRef CAS PubMed.
- D. E. E. Deacon-Smith, D. O. Scanlon, C. R. A. Catlow, A. A. Sokol and S. M. Woodley, Adv. Mater., 2014, 26, 7252–7256 CrossRef CAS PubMed.
- X. Liu and K. Sohlberg, Comput. Mater. Sci., 2015, 103, 1–7 CrossRef CAS.
- X. Zhao and A. Selloni, Phys. Rev. Mater., 2019, 3, 015801 CrossRef CAS.
- K. Szot, W. Speier, M. Pawelczyk, J. Kwapuliñski, J. Hulliger, H. Hesse, U. Breuer and W. Quadakkers, J. Phys.: Condens. Matter, 2000, 12, 4687–4697 CrossRef CAS.
- J. A. Li, E. A. Akhadov, J. Baker, L. A. Boatner, D. Bonart, F. A. Flaherty, J. Fritsch, S. A. Safron, U. Schröder, J. G. Skofronick, T. W. Trelenberg and D. H. Van Winkle, Phys. Rev. Lett., 2001, 86, 4867–4870 CrossRef CAS PubMed.
- J. Fritsch and U. Schröder, Phys. Status Solidi B, 1999, 215, 827–831 CrossRef CAS.
- J. A. Li, E. A. Akhadov, J. Baker, L. A. Boatner, D. Bonart, J. Fritsch, S. A. Safron, U. Schröder, J. G. Skofronick and T. W. Trelenberg, Phys. Rev. B, 2003, 68, 045402 CrossRef.
- D. E. E. Deacon-Smith, D. O. Scanlon, C. R. A. Catlow, A. A. Sokol and S. M. Woodley, Adv. Mater., 2014, 26, 7252–7256 CrossRef CAS PubMed.
- Y. Wang, J. Cheng, M. Behtash, W. Tang, J. Luo and K. Yang, Phys. Chem. Chem. Phys., 2018, 20, 18515–18527 RSC.
- M. Setvin, M. Reticcioli, F. Poelzleitner, J. Hulva, M. Schmid, L. A. Boatner, C. Franchini and U. Diebold, Science, 2018, 359, 572–575 CrossRef CAS PubMed.
- C. F. Dickens and J. K. Nørskov, J. Phys. Chem. C, 2017, 121, 18516–18524 CrossRef CAS.
- X. Zhang, P. Klaver, R. Van Santen, M. C. M. Van De Sanden and A. Bieberle-Hütter, J. Phys. Chem. C, 2016, 120, 18201–18208 CrossRef CAS.
- H. Ouhbi and U. Aschauer, Surf. Sci., 2018, 677, 258–263 CrossRef CAS.
- P. Giannozzi, S. Baroni, N. Bonini, M. Calandra, R. Car, C. Cavazzoni, D. Ceresoli, G. L. Chiarotti, M. Cococcioni, I. Dabo, A. Dal Corso, S. De Gironcoli, S. Fabris, G. Fratesi, R. Gebauer, U. Gerstmann, C. Gougoussis, A. Kokalj, M. Lazzeri, L. Martin-Samos, N. Marzari, F. Mauri, R. Mazzarello, S. Paolini, A. Pasquarello, L. Paulatto, C. Sbraccia, S. Scandolo, G. Sclauzero, A. P. Seitsonen, A. Smogunov, P. Umari and R. M. Wentzcovitch, J. Phys.: Condens. Matter, 2009, 21, 395502 CrossRef PubMed.
- J. P. Perdew, K. Burke and M. Ernzerhof, Phys. Rev. Lett., 1996, 77, 3865–3868 CrossRef CAS PubMed.
- D. Vanderbilt, Phys. Rev. B, 1990, 41, 7892–7895 CrossRef PubMed.
- B. J. Kennedy, A. K. Prodjosantoso and C. J. Howard, J. Phys.: Condens. Matter, 2006, 11, 6319–6327 CrossRef.
- L. Bengtsson, Phys. Rev. B, 1999, 59, 12301–12304 CrossRef CAS.
- H. J. Monkhorst and J. D. Pack, Phys. Rev. B, 1976, 13, 5188–5192 CrossRef.
- J. K. Nørskov, J. Rossmeisl, A. Logadottir, L. Lindqvist, J. R. Kitchin, T. Bligaard and H. Jónsson, J. Phys. Chem. B, 2004, 108, 17886–17892 CrossRef.
- R. P. Bell, Proc. R. Soc. A, 1936, 154, 414–429 CrossRef.
- M. G. Evans and M. Polanyi, Trans. Faraday Soc., 1936, 32, 1333–1360 RSC.
- J. Rossmeisl, Z. W. Qu, H. Zhu, G. J. Kroes and J. K. Nørskov, J. Electroanal. Chem., 2007, 607, 83–89 CrossRef CAS.
- I. C. Man, H. Y. Su, F. Calle-Vallejo, H. A. Hansen, J. I. Martínez, N. G. Inoglu, J. Kitchin, T. F. Jaramillo, J. K. Nørskov and J. Rossmeisl, ChemCatChem, 2011, 3, 1159–1165 CrossRef CAS.
- J. H. Montoya, A. D. Doyle, J. K. Nørskov and A. Vojvodic, Phys. Chem. Chem. Phys., 2018, 20, 3813–3818 RSC.
- J. H. Montoya, M. Garcia-Mota, J. K. Nørskov and A. Vojvodic, Phys. Chem. Chem. Phys., 2015, 17, 2634–2640 RSC.
- G. Lodi, E. Sivieri, A. De Battisti and S. Trasatti, J. Appl. Electrochem., 1978, 8, 135–143 CrossRef CAS.
- A. Grimaud, O. Diaz-Morales, B. Han, W. T. Hong, Y.-L. Lee, L. Giordano, K. A. Stoerzinger, M. T. M. Koper and Y. Shao-Horn, Nat. Chem., 2017, 9, 457–465 CrossRef CAS PubMed.
- E. Fabbri and T. J. Schmidt, ACS Catal., 2018, 8, 9765–9774 CrossRef CAS.
Footnote |
| † Electronic supplementary information (ESI) available: Binding geometry of OOH adsorbate and free energy profiles for different mechanisms on the O-covered surface. See DOI: 10.1039/c9ta04001c |
| This journal is © The Royal Society of Chemistry 2019 |

