 Open Access Article
Co-spray printing of LiFePO4 and PEO-Li1.5Al0.5Ge1.5(PO4)3 hybrid electrodes for all-solid-state Li-ion battery applications†
Junfu
Bu
 *ab,
Puiki
Leung
a,
Chun
Huang
 a,
Sang Ho
Lee
 a and
Patrick S.
Grant
*ab
aDepartment of Materials, University of Oxford, Parks Road, Oxford OX1 3PH, UK. E-mail: junfu.bu@materials.ox.ac.uk; patrick.grant@materials.ox.ac.uk
bFaraday Institution, Quad One, Harwell Campus, Didcot OX11 0RA, UK
First published on 1st August 2019
Abstract
LiFePO4 (LFP) electrodes for Li-ion battery applications were prepared by spray printing. By optimising the substrate temperature, solvent ratio and electrode material concentration, a honeycomb pore structure was produced over a large area electrode. In a liquid electrolyte, the honeycomb structured LFP electrode showed improved cycling performance at high C-rate due to shortened pore pathways and improved Li mobility. In a solid-state configuration, a PEO(LITFSI)-Li1.5Al0.5Ge1.5(PO4)3 (PEO-LAGP) based solid electrolyte was either spray printed on top of the LFP and/or interleaved within sub-layers of the LFP electrode, for both non-honeycomb and honeycomb pore morphologies. Cross-sectional scanning electron microscope (SEM) and energy-dispersive X-ray spectroscopy (EDS) mapping combined with electrochemical impedance spectroscopy (EIS) testing showed that the honeycomb electrode with inter-leaved sub-layers of solid-state electrolyte improved interfacial contact between the electrode and electrolyte. When coupled with Li foil in a solid-state Li ion battery configuration, the honeycomb interleaved electrode also showed the best performance in terms of capacity and cycle stability at all testing temperatures, showing capability that exceeded previously reported performance.
Introduction
Greater market penetration of electric vehicles (EVs) and hybrid electric vehicles (HEVs) is required to reduce environmental pollution and the requirement for carbon-intensive fuels. Due to their excellent gravimetric energy density (∼270 W h kg−1), reducing cost (∼US$100 kW h−1) and widespread availability, lithium ion batteries (LIBs) have become the practical technology of choice for EVs and HEVs.1–3 However, LIBs have relatively low power density (∼250–340 W kg−1) and slow charge for pure EV requirements.4,5 Mass-market LIBs also use an organic solvent-based liquid electrolyte that is flammable potentially toxic and has poor chemical stability that, under certain conditions, can pose potential safety issues of leakage, fire or even explosion especially in large-scale energy storage systems.6To promote higher power density, intrinsically higher speed lithium insertion materials (e.g. Li4Ti5O12), porosity engineering (e.g. aligned pore channels through the electrode thickness), thinner electrodes (<50 μm), and many different types of nano-scale active materials have been suggested, but their practical implementation usually involves compromises in gravimetric energy density and/or volumetric energy density, or increased side and other reactions due to increased active material surface area.7–10 Rather than the planar large area foil current collector-based electrodes used commercially, investigations of 3D electrode morphologies at the laboratory scale have also shown that faster ionic and electronic transport can be promoted, which supports faster charging and/or discharging performance.11–18 However, these approaches are difficult to scale-up economically.
With regard to the safety concerns or restricted material choices associated with the relatively reactive liquid organic solvent-based electrolytes used in LIBs, solid-state batteries in which the liquid is replaced by a gel or solid ion conductor offer the possibility to improve safety and may enable the use of alkali metal (Li or Na) negative electrodes with unmatchable energy density.19 Solid-state Li-ion electrolytes can be divided into inorganic (mainly ceramics) and organic (polymer), and great effort is being expended to develop these materials with ionic conductivities that approach those of organic liquid electrolytes (>10 mS cm−1), and this has been extensively reviewed elsewhere.20–25 Conductivity issues aside, for ceramic electrolytes, their lack of flexibility and low mechanical compliance creates significant difficulties in maintaining interfacial contact between the electrolyte and the entire surface of the active material in the electrode during intercalation/de-intercalation swelling and contraction. Their relatively high density can also undermine the overall device gravimetric energy density.26 Polymer electrolytes such as widely studied poly(ethylene oxide) (PEO) provide better mechanical compliance at electrolyte/active material interfaces but have insufficient structural stability to ensure anode–cathode separation while their relatively poor ionic conductivity in the range of 10−8 to 10−4 S cm−1 at ambient temperature also hinders their wider application.20,27 Hybrid solid electrolytes composed of a dispersion of inorganic electrolyte particles in a polymer electrolyte matrix have been shown to offer a potentially attractive balance of ionic conductivity, interfacial compliance to maintain active/electrolyte interfacial contact, and structural rigidity.28–30 However, challenges remain in reliably fabricating large area electrodes in which the hybrid electrolyte remains in intimate contact with all the available active material surface throughout repeated cycling.
This paper investigates a co-spray printing approach that prints thin layers of a LiFePO4 (LFP) cathode material inter-layered with thin layers of a PEO(LITFSI)-Li1.5Al0.5Ge1.5(PO4)3 (PEO-LAGP) hybrid electrolyte. The layer-by-layer assembly of the electrode seeks to ensure the hybrid electrolyte is intimately and continuously dispersed to all parts of the electrode. As part of this aim, the spray printing of the LFP layers uses a bi-solvent drying phenomenon to promote through-layer honeycomb porosity so that the hybrid electrolyte penetrates both within and between layers.31,32 By comparing various spray printed electrodes with identical fractions of active, inactive and electrolyte materials arranged in different geometrical configurations, we identify an optimum arrangement that delivers amongst the best reported performance for similar systems, and is achieved easily over large electrode areas of up to 20 × 20 cm or more. While the LFP cathode and hybrid PEO-LAGP electrolyte materials are used here to exemplify, the approach described is generic and similar benefits of inter-layering in other cathode materials for solid-state batteries may be expected.
Results and discussion
The effects of spray printing parameters on electrode morphology
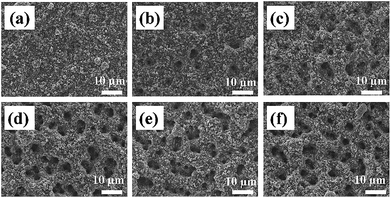
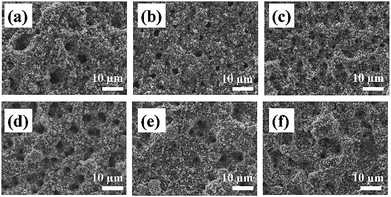
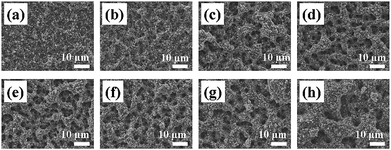
The role of key process parameters on the spray printed electrode microstructure was first investigated, including the effect of substrate temperature, suspension solvent ratio and suspension solid content.Electrochemical characterization
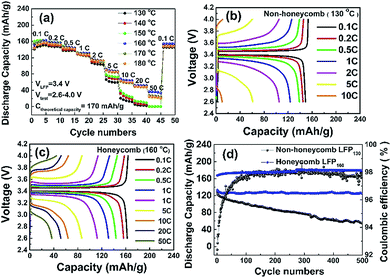
Fig. 4b and c show the charge and discharge profiles of the NH and H electrodes at various C rates. At 0.1 C, both electrodes had a flat potential plateau at ∼3.4 V corresponding to the redox reaction of the Fe3+/Fe2+couple.34 The voltage differences between the charge and discharge curves at 0.1 C for NH and H electrodes were 71 mV and 57 mV, respectively. This voltage difference increased to 223 mV and 132 mV at 1 C, and increased further at higher C rates. Overall, for the same charge and discharge rate conditions, the potential plateau of the H electrode was flatter and longer and the polarization smaller when compared with those of the NH electrode, which suggested that the honeycomb structure had a lower charge transfer resistance, which is characterised further later.
The cycling performance of the LFP-based electrodes was investigated up to 500 cycles at 1 C, as shown in Fig. 4d. The H electrode showed greater cycling stability with a 95% capacity retention compared with 55% for the NH electrode. Coulombic efficiencies were ∼98% for both electrodes. It was likely that the reduced degradation of the H electrode arose because of the greater fraction of through thickness porosity in this electrode, which better facilitated the homogenization of the spatial distribution of Li ion concentration. Under these conditions, the accommodation of any volume change and associated strain during the intercalation/deintercalation process is more uniform, and less damaging to the electrode structure.15,16,18
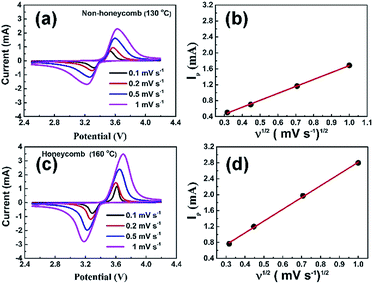
Fig. 5a and c show the cyclic voltammograms of NH and H electrodes at scan rates from 0.1 to 1 mV s−1. The peak profiles of H electrodes were more symmetric and peak currents greater than those for NH electrodes, suggesting a reduced charge transfer resistance. Fig. 5b and d show the corresponding plots of the peak anodic current as a function of the square root of the scan rate. In both cases, the variation of peak current density was a good linear fit to the square root of the scan rate, and implied that the overall charge/discharge behaviour for both electrodes was diffusion-controlled.35 Under these conditions an effective Li-ion diffusion coefficient, which expresses the net effect of the various Li ion transport processes operating in the electrode, can be obtained from the gradient of a best-fit line using the Randles–Sevcik equation:36,37
| Ip = 0.4463n FAC0(nFvDLi/RT)1/2 | (1) |
The Li-ion diffusion coefficients were estimated at 1.5 × 10⁻¹¹ cm2 s−1 and 3 × 10⁻¹¹ cm2 s−1 for NH and H electrodes, respectively. Consistent with their higher pore fraction (and low electrode density), the diffusion coefficients were similar or slightly higher than those of similar materials,38 such as 1.8 × 10⁻¹⁴ cm2 s−1 for a conventional LFP electrode,39 2.52 × 10⁻¹¹ cm2 s−1 for a 3D porous LFP electrode35 and 6.3 × 10⁻¹³ cm2 s−1 for a porous LFP/carbon nanotube composite electrode.40
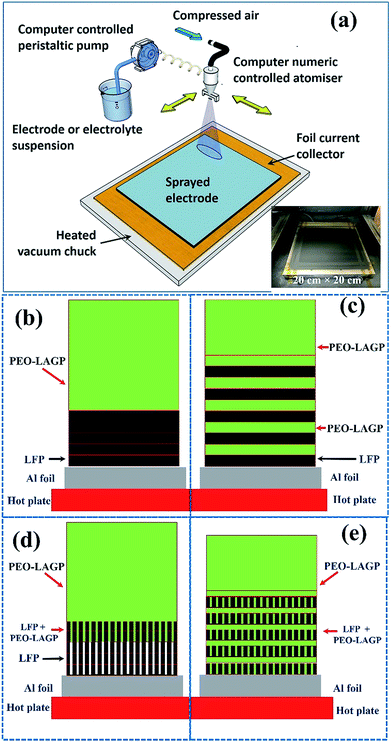
Four different configurations were investigated, which are shown schematically in the Experimental section (Fig. 11):
• NH (non-honeycomb), shown in Fig. 11 (b): five spray printed layers of non-honeycomb LFP (formed at a substrate temperature of 130 °C), immediately followed by ten spray printed layers of PEO-LAGP electrolyte.
• NH-L (non-honeycomb, layered), shown in Fig. 11 (c): one spray printed layer of non-honeycomb LFP, one layer of PEO-LAGP, repeated five times, immediately followed by five layers of PEO-LAGP.
• H (honeycomb), shown in Fig. 11 (d): five layers of honeycomb LFP (formed at a substrate temperature of 160 °C), immediately followed by ten layers of PEO-LAGP.
• H-L (honeycomb, layered), shown in Fig. 11 (e): one spray printed layer of honeycomb LFP, one layer of PEO-LAGP, repeated five times, immediately followed by five layers of PEO-LAGP.
The relatively small diameter of the LAGP particles (∼500 nm) and LFP particles (∼1 μm) facilitated the deposition of relatively thin sub-layers, so that fine-scale inter-leaving of ∼5 μm thick layers was possible. The effectiveness of inter-leaving may be reduced when the layer particle diameter increased, which would increase sub-layer thickness. Comparing NH and NH-L electrodes will show the effect of inter-layering the electrolyte when there were a few or no macro-honeycomb pores in the electrode. Comparing H and H-L electrodes will highlight the effect of inter-layering when the electrode has a greater fraction of honeycomb pores to enable through-layer inter-connectivity.
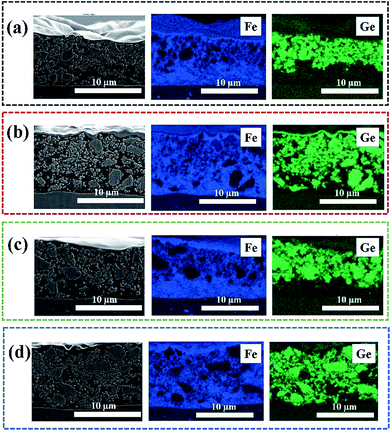
Fig. 6a to d show cross-sectional SEM images of NH, NH-L, H and H-L electrodes with the Al current collector at the bottom of the image and in each case with corresponding EDX maps for elements Fe and Ge that allow discrimination between LiFePO4 and LAGP particulates, respectively. It was not possible to use a similar EDX approach to identify the PEO-based gel electrolyte, but regions that were neither LiFePO4 nor LAGP rich may be assumed to be either the PEO in the hybrid electrolyte or residual pores. Fig. 6a and c show that for both non-inter-layered electrodes there were two distinct layered regions: a ∼10 μm LAGP-rich layer on a ∼5 μm LiFePO4-rich layer. In all cases there was some limited inter-mixing between layers (or possible smearing during polishing). The presence of honeycomb pores (Fig. 6c) had no marked effect on the extent of inter-mixing. When inter-layering was introduced as shown in Fig. 6b and d, the electrodes were again ∼15 μm thick in total, and although there was some evidence for increased LiFePO4-LAGP inter-mixing, again the presence of the honeycomb structure, in Fig. 6d, did not markedly improve inter-layer inter-connectivity from a microstructural perspective.
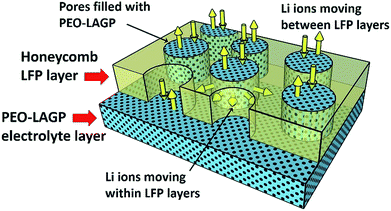
Fig. 7a to d show the discharge capacity of the four electrodes at C rates of 0.1 to 1 C at temperatures of (a) 30 °C, (b) 40 °C, (c) 50 °C and (d) 60 °C. Regardless of the temperature and structure, the discharge capacity decreased with increasing C rate due to sluggish Li ion diffusion and increasing polarization,41 recovering capacity when the C rate was reduced back to 0.1 C. As can be expected, discharge capacities increased with increasing temperature due to faster Li ion diffusion and insertion kinetics.42 The non-layered, non-honeycomb NH electrode had the lowest discharge capacity of ∼45 mA h g−1 at 0.1 C that reduced to ∼7 mA h g−1 at 1 C; in contrast, the inter-layered, honeycomb H-L electrode comprising exactly the same materials but in a different geometrical arrangement delivered ∼150 mA h g−1 at 0.1 C and ∼110 mA h g−1 at 1 C, which was almost the same as the closely similar honeycomb electrode in the conventional liquid electrolyte previously shown in Fig. 4. This shows the limitations to inferring likely electrochemical performance from 2D microstructural sections, and implies the actual electrolyte connectivity in 3D was more extensive in the honeycomb electrodes than suggested by the 2D sections. Fig. 8 shows a schematic of the inter-leaved honeycomb (H-L) electrode in which the hybrid solid-state electrolyte has filled the honeycomb pores that penetrate between the LFP-rich layers. The Li ions can thus move relatively easily both within the plane of the electrode, and through the electrode, between layers. It was this enabling of Li mobility to all parts of the electrode that provided its higher capacity. At 30 °C, the capacity of all electrodes was reduced but the trends in relative performance between the different electrodes were the same, with the best-performing H-L electrode delivering a discharge capacity of ∼45 mA h g−1 at 0.1 C.
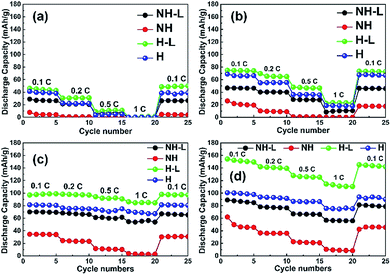 | ||
| Fig. 7 Discharge capacities of the NH, NH-L, H and H-L electrodes with a hybrid solid-state electrolyte at C rates of 0.1 to 1 C at temperatures of (a) 30 °C, (b) 40 °C, (c) 50 °C and (d) 60 °C. | ||
To investigate further the effect of microstructural arrangement on electrode dynamics, Fig. 9 shows Nyquist plots for the four electrode types corresponding to each of the temperatures in the plots in Fig. 7. Each Nyquist plot contained one or two overlapping semi-circles in the high/medium frequency region and inclined lines in the low frequency region. The diameter of a best-fit semi-circle to the data indicates the resistance of the electrode to Li+ ion movement through the solid electrolyte and the charge transfer resistance at the electrode–electrolyte interface, which is the main resistance of all-solid-state batteries. The inclined lines in the low frequency domain represent the Warburg impedance corresponding to Li-ion diffusion behaviour within the electrodes.42 Approximately, the smaller the semi-circle the lower the transport resistance. Taking the non-honeycomb NH electrode at 60 °C for example, the relatively large diameter semi-circle was likely due to the electrode/electrolyte interface resistance (∼600 Ω) and the smaller semi-circle related to Li-ion diffusion resistance within the electrolyte (∼160 Ω). The total resistance of the NH electrode was much larger than that of the NH-L electrode (∼250 Ω). For the honeycomb-based electrodes H and H-L, there was only one semi-circle in the high/medium frequency range, which suggested that interfacial resistance between the electrode and electrolyte dominated, and the total resistances of the H (∼150 Ω) electrode and the H-L (∼110 Ω) electrode were lower than those of the corresponding NH and NH-L electrodes. Thus, the combination of honeycomb morphology and inter-layering improved interfacial contact between the LFP and PEO-LAGP electrolyte. When tested at lower temperature, the phenomenon of two semi-circles in the high frequency reducing to one became more pronounced.
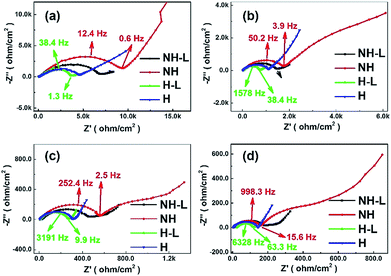 | ||
| Fig. 9 Imaginary versus real impedance for the NH, NH-L, H and H-L LFP-based electrodes with a hybrid solid-state electrolyte from Fig. 7 at (a) 30 °C, (b) 40 °C, (c) 50 °C and (d) 60 °C. | ||
The cycle stability of the NH, NH-L, H and H-L LFP-base electrodes at 60 °C and 0.1 C is shown in Fig. 10, indicating that both the honeycomb electrodes, whether layered or not, had a lower rate of discharge capacity degradation than their non-honeycomb equivalents. For example, the H-L and H electrodes had a capacity of 138 mA h g−1 (97.2% retention) and 81 mA h g−1 (88.9% retention), respectively, after 100 continuous cycles whereas the NH-L and NH equivalents had a capacity of 55 mA h g−1 (66.9% retention) and 31 mA h g−1 (67.3% retention), respectively. Considering the behaviour shown in Fig. 7 and 8, the relatively high capacity retention of the honeycomb electrode, especially the H-L electrode, is most likely related to the compliance provided throughout the electrode by the inter-layered hybrid PEO-LAGP electrolyte, which helped to ensure that electrode/electrolyte contact was maintained during the volume change of the LFP during intercalation/deintercalation cycles.15,18
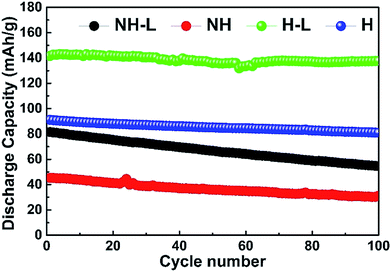 | ||
| Fig. 10 Long-term cycle stability of NH, NH-L, H and H-L LFP-based electrodes with a hybrid PEO-LAGP solid-state electrolyte at 60 °C and 0.1 C. | ||
Overall, the solid-state LFP-based H-L electrode half cell performance was similar or better than previous reports,29,42–56 as summarized in Table 1. In these prior studies, the fabrication of the electrode and fabrication of the electrolyte were separate, and were usually combined with post fabrication heating and drying as well as post-assembly processes to prepare cells. Here, co-spray printing prepared the electrode and electrolyte structures directly with minimized post processing, and allowed both inter-layering and honeycomb pores, both of which promoted improved performance. Spray printing is a general propose approach suitable for many other cathode, anode and electrolyte materials, and for electrode thicknesses up to 100s of μm. Thus, the direct production of full solid-state inter-layered cathode–electrolyte–anode cells can be easily envisaged.32
| Electrode composition (wt%) | Electrolyte composition (wt%) | Discharge capacity (mA h g−1) | Long-time discharge capacity retention | Ref. |
|---|---|---|---|---|
| a CPMEA = cross-linked poly(ethylene glycol) methyl ether acrylate. b LIFTSI = lithium bis(trifluoromethanesulfonyl)imide. c LATP = Li1.3Al0.3Ti1.7(PO4)3. d P(VdF-co-HFP) = poly(vinylidene fluoride-co-hexafluoropropylene). | ||||
| 60LFP + 12SP + 20CPMEAa + 8LiTFSIb | CPMEA/LATPc/CPMEA | 130 (65 °C and 0.2 C) | ∼58% (325 cycles) | 28 |
| 70LFP + 10SP + 20(PEO-LAGP) | 80PEO + 20LAGP-LITFSI | 166 (60 °C and 0.1 C) | ∼90% (50 cycles) | 42 |
| 55LFP + 30.86PEO + 4.14 LiClO4 + 10SP | 30PEO + 70LAGP-LITFSI | 137.6 (55 °C and 0.2 C) | 88% (100 cycles) | 44 |
| 50LFP + 30.86PEO + 4.14 LiClO4 + 5SN + 10SP | 70LAGP + 21PEO-LiClO4 + 9SN | 127.8–136.8 (25 °C and 0.2 C) | 98% (100 cycles) | 47 |
| 85LiNi0.5Co0.2Mn0.3O2 + 7.5PVDF + 7.5SP | 90 LAGP + 10(P(VdF-co-HFP)d) + LiPF6-based liquid electrolyte | 157.6 (25 °C and 0.5 C) | 86.9% (200 cycles) | 48 |
| 80LFP + 10SP + 10PVDF + 30PEO-LITFSI-70LAGP (H-L electrode) | 30PEO-LITFSI-70LAGP | 150 (60 °C and 0.1 C) | 97.2% (100 cycles) | This work |
| 80LFP + 10SP + 10PVDF (H electrode) | 30PEO-LITFSI-70LAGP | 99 (60 °C and 0.1 C) | 88.9% (100 cycles) | This work |
| 80LFP + 10SP + 10PVDF + 30PEO-LITFSI-70LAGP (NH-L electrode) | 30PEO-LITFSI-70LAGP | 85 (60 °C and 0.1 C) | 66.9% (100 cycles) | This work |
| 80LFP + 10SP + 10PVDF (NH electrode) | 30PEO-LITFSI-70LAGP | 45 (60 °C and 0.1 C) | 67.3% (100 cycles) | This work |
Conclusions
Honeycomb LFP electrodes (H) were successfully prepared by spray printing at a substrate temperature ≥160 °C using a 10 vol% NMP/IPA solvent ratio and a 0.25 g/100 ml suspension concentration. For liquid electrolyte batteries, the honeycomb electrodes improved rate cycling performance at 5 C or higher. At 50 C, a honeycomb electrode delivered a capacity of 33 mA h g−1 while non-honeycomb electrodes were effectively useless. After 500 cycles at 1 C, the honeycomb electrode had 95% capacity retention. The lithium-ion mobility in the honeycomb electrode was approximately twice that of the non-honeycomb electrode. For a solid-state half cell using a spray printed PEO-LAGP hybrid electrolyte, inter-leaving the electrolyte inside a honeycomb electrode produced the best rate performance and long-term cycle stability, e.g. 150 mA h g−1 at 0.1 C and 97.2% retention after 100 continuous cycles at 60 °C. Cross-sectional SEM and EDS mapping combined with EIS testing suggested that the honeycomb morphology and inter-leaving improved interfacial contact between the electrode and solid-state electrolyte. The spray printing process is relatively straightforward to scale up and could provide a direct route for the fabrication of practical solid-state batteries.Experimental
Preparation of cathode and electrolyte suspension
Particulate LFP and Super P (SP) carbon black to promote electrical conductivity were obtained from MTI Corporation, USA and polyvinylidene fluoride (PVDF) binder, N-methyl-2-pyrrolidone (NMP) and isopropyl alcohol (IPA) were obtained from Sigma-Aldrich, UK. All powders were dried in an oven for > 24 hours at 60 °C before electrode suspension preparation and used directly without any further treatment. For a typical LFP cathode suspension for spray printing, 0.2 g LFP, 0.025 g SP and 0.025 g PVDF were mixed with 10 ml NMP and the resulting suspension stirred magnetically for 30 min. Then, 90 ml IPA was added and stirred for a further 30 min. The suspension was then ultrasonicated for 30 min after which a dilute stable suspension with no settling of solids over several hours was obtained, suitable for pumping and atomisation during spray printing.For the hybrid electrolyte suspension suitable for spray printing, a 30 wt% PEO-70 wt% LAGP mixture was chosen based on prior work.44 Dried LITFSI (100 °C for 24 h, Sigma-Aldrich) as the Li salt was combined with PEO (Mn = 4![[thin space (1/6-em)]](https://www.rsc.org/images/entities/char_2009.gif) 000
000![[thin space (1/6-em)]](https://www.rsc.org/images/entities/char_2009.gif) 000 and melting point ∼65 °C, Sigma-Aldrich) at a PEO
000 and melting point ∼65 °C, Sigma-Aldrich) at a PEO![[thin space (1/6-em)]](https://www.rsc.org/images/entities/char_2009.gif) :
:![[thin space (1/6-em)]](https://www.rsc.org/images/entities/char_2009.gif) Li+ ratio of 18
Li+ ratio of 18![[thin space (1/6-em)]](https://www.rsc.org/images/entities/char_2009.gif) :
:![[thin space (1/6-em)]](https://www.rsc.org/images/entities/char_2009.gif) 1. LAGP powder with a number mean particle diameter of approximately 500 nm (MTI Corporation, USA) was incorporated into the hybrid electrolyte as follows: 0.3 g PEO, 0.236 g LITFSI and 0.7 g LAGP were placed in a dry beaker, 10 ml anhydrous acetonitrile and 90 ml IPA were added, followed by stirring and ultrasonication as described for the LFP suspension above.
1. LAGP powder with a number mean particle diameter of approximately 500 nm (MTI Corporation, USA) was incorporated into the hybrid electrolyte as follows: 0.3 g PEO, 0.236 g LITFSI and 0.7 g LAGP were placed in a dry beaker, 10 ml anhydrous acetonitrile and 90 ml IPA were added, followed by stirring and ultrasonication as described for the LFP suspension above.
Spray printing
The LFP-based electrode was fabricated using a spray printing technique developed in our group for various electrochemical energy storage applications, described in detail elsewhere31,32,57–64 and shown schematically in Fig. 11a. 80 mm × 80 mm Al current collector foil was attached to a vacuum chuck substrate and secured with polyimide tape. The various suspensions were peristaltically pumped at typically 5 ml min−1 and atomised in an industrial spray nozzle using compressed air at 0.2 bar while simultaneously reciprocating in a pre-programmed pattern over the current collector in the x–y plane at a constant distance of 15 cm. The printed area was 100 mm × 100 mm to ensure that all the foil was coated evenly. As the sprayed suspension droplets deposited on the hot current collector, the NMP and IPA fugitive carriers evaporated almost immediately so that there was no build-up of liquid in the forming electrode and no substantive re-suspension of previously deposited layers. After printing, the coated foils were dried in a vacuum oven at 120 °C overnight for subsequent characterization or coin cell assembly.Two different spray printing strategies shown schematically in Fig. 11 (b) and (c) were investigated. First, the LFP electrode (thickness ∼5 μm) was formed from the LFP-based suspension only, and then a hybrid PEO-LAGP layer (thickness ∼10 μm) was printed on top, as shown in Fig. 11b. Second, much thinner layers (∼1 μm) of LFP and PEO-LAGP were repeatedly inter-leaved to form the multi-layer electrode arrangement shown schematically in Fig. 11c. For a fair comparison between the two arrangements, the total number of sprayed layers of the LFP suspension was fixed at 5 and the PEO-LAGP suspension fixed at 10, regardless of the order in which the layers were deposited. Fig. 11d and e show similar electrode cross-sections but in the case of honeycomb layers. In Fig. 11d, it is anticipated that at least partial infiltration of honeycomb pores by the hybrid electrolyte will occur; in Fig. 11e, the use of inter-layering may allow the filled pores to bridge between the inter-layers of the hybrid electrolyte. Further, the filling of the pores in the thin LFP layers with the PEO-LAGP electrolyte will also likely provide an increase in the overall active material surface area that is relatively easy for the charge carrying ions in the electrolyte to access. Overall, the arrangement in Fig. 11e aims to boost the electrode capacity and dynamic response by a combination of greater continuity and inter-penetration of the electrolyte together with an increase in active/electrolyte area. The total coating weights of the LFP and LFP–PEO–LAGP electrodes were 3.6 mg cm−2 and 6 mg cm−2, respectively.
Electrode characterization
A microbalance (Sartorius, Germany) with 0.1 mg accuracy was used for weighing electrode materials and a screw micrometer (IP65 Coolant Proof, Mitutoyo, Japan) was used to measure the electrode thickness. The electrode surface morphology and cross-sectional microstructure were characterized by scanning electron microscopy (SEM, JEOL 6500F, Japan). For cross-sectional images, a Gatan Precision Etching Coating System (PECS 685) was used for polishing with a 6 keV beam and 2 h milling. Energy-dispersive X-ray spectroscopy (EDS) mapping using a field emission gun SEM (Carl Zeiss Merlin, Germany) was used to distinguish between LFP regions (Fe signal) and PEO-LAGP regions (Ge signal).Battery assembly and electrochemical characterization
2032 coin-type half-cells were assembled in an Ar-filled glove box with water and oxygen levels lower than 1 ppm using 16 mm discs punched from LFP or LFP–PEO(LITFSI)-LAGP coated foils. Lithium chips of 15.5 mm diameter and 0.5 mm thickness were used at the counter/reference electrode. A Li chip was directly placed on the top of the two layers of the LFP-based cathode plus the PEO(LITFSI)-LAGP hybrid electrolyte. For electrodes investigated in a liquid electrolyte, a 25 μm thick trilayer polypropylene–polyethylene–polypropylene membrane separator (Celgard, USA) and a 1 M LiPF6 solution in a mixture of ethylene carbonate (EC) and dimethyl carbonate (DMC) at a volume ratio of 1![[thin space (1/6-em)]](https://www.rsc.org/images/entities/char_2009.gif) :
:![[thin space (1/6-em)]](https://www.rsc.org/images/entities/char_2009.gif) 1 electrolyte was used. All half-cells were investigated during galvanostatic charge/discharge between 4.2 and 2.6 V (versus Li/Li+) at various C rates from 0.1 to 1 C (solid electrolyte) or 50 C (liquid electrolyte) using a battery cycler (Arbin BT-G-25, USA) as a function of temperature, including long-term cycling behaviour. Cyclic voltammetry was performed between 2.5 and 4.2 V at scan rates from 0.1 to 1 mV s−1 using a potentiostat/galvanostat (Gamry Reference 600/EIS300). Electrochemical impedance spectroscopy (EIS) was also conducted in the range 105 to 0.01 Hz with an applied oscillating voltage of 10 mV at open circuit potential.
1 electrolyte was used. All half-cells were investigated during galvanostatic charge/discharge between 4.2 and 2.6 V (versus Li/Li+) at various C rates from 0.1 to 1 C (solid electrolyte) or 50 C (liquid electrolyte) using a battery cycler (Arbin BT-G-25, USA) as a function of temperature, including long-term cycling behaviour. Cyclic voltammetry was performed between 2.5 and 4.2 V at scan rates from 0.1 to 1 mV s−1 using a potentiostat/galvanostat (Gamry Reference 600/EIS300). Electrochemical impedance spectroscopy (EIS) was also conducted in the range 105 to 0.01 Hz with an applied oscillating voltage of 10 mV at open circuit potential.
Conflicts of interest
There are no conflicts to declare.Acknowledgements
This research work was supported by (1) the UK Engineering and Physical Sciences Research Council (EPSRC) [grant number EP/M009521/1]; and (2) Faraday Institution [grant number FIRG007 - SOLBAT]. Thanks are extended to Robin Vincent and Gideon Ring for technical assistance in setting up the experiments.References
- A. F. Burke, Proc. IEEE, 2007, 95, 806–820 Search PubMed.
- A. Khaligh and Z. H. Li, IEEE Trans. Veh. Technol., 2010, 59, 2806–2814 Search PubMed.
- J. Janek and W. G. Zeier, Nat. Energy, 2016, 1, 16141 CrossRef.
- B. Kang and G. Ceder, Nature, 2009, 458, 190–193 CrossRef CAS PubMed.
- S. Choi, T. H. Kim, J. I. Lee, J. Kim, H. K. Song and S. Park, ChemSusChem, 2014, 7, 3483–3490 CrossRef CAS PubMed.
- Y. Hirotoshi, J. Indian Inst. Sci., 2016, 96, 315–324 Search PubMed.
- C. H. Jiang, E. Hosono and H. S. Zhou, Nano Today, 2006, 1, 28–33 CrossRef.
- Y.-G. Guo, J.-S. Hu and L.-J. Wan, Adv. Mater., 2008, 20, 2878–2887 CrossRef CAS.
- H. Li, Z. X. Wang, L. Q. Chen and X. J. Huang, Adv. Mater., 2009, 21, 4593–4607 CrossRef CAS.
- S. Goriparti, E. Miele, F. De Angelis, E. Di Fabrizio, R. P. Zaccaria and C. Capiglia, J. Power Sources, 2014, 257, 421–443 CrossRef CAS.
- Y. Yu, C. H. Chen, J. L. Shui and S. Xie, Angew. Chem., Int. Ed., 2005, 44, 7085–7089 CrossRef CAS PubMed.
- M. Yao, K. Okuno, T. Iwaki, M. Kato, S. Tanase, K. Emura and T. Sakai, J. Power Sources, 2007, 173, 545–549 CrossRef CAS.
- H. Zhang, X. Yu and P. V. Braun, Nat. Nanotechnol., 2011, 6, 277–281 CrossRef CAS PubMed.
- L. Hu, H. Wu, Y. Gao, A. Cao, H. Li, J. McDough, X. Xie, M. Zhou and Y. Cui, Adv. Energy Mater., 2011, 1, 523–527 CrossRef CAS.
- H. Ji, L. Zhang, M. T. Pettes, H. Li, S. Chen, L. Shi, R. Piner and R. S. Ruoff, Nano Lett., 2012, 12, 2446–2451 CrossRef CAS PubMed.
- B. Wang, W. Al Abdulla, D. L. Wang and X. S. Zhao, Energy Environ. Sci., 2015, 8, 869–875 RSC.
- S. Wi, J. Kim, K. Park, S. Lee, J. Kang, K. H. Kim, S. Nam, C. Kim and B. Park, RSC Adv., 2016, 6, 105081–105086 RSC.
- Y. K. Zhou, J. M. Lu, C. J. Deng, H. X. Zhu, G. Z. Chen, S. W. Zhang and X. H. Tian, J. Mater. Chem. A, 2016, 4, 12065–12072 RSC.
- J. G. Kim, B. Son, S. Mukherjee, N. Schuppert, A. Bates, O. Kwon, M. J. Choi, H. Y. Chung and S. Park, J. Power Sources, 2015, 282, 299–322 CrossRef CAS.
- J. W. Fergus, J. Power Sources, 2010, 195, 4554–4569 CrossRef CAS.
- E. Quartarone and P. Mustarelli, Chem. Soc. Rev., 2011, 40, 2525–2540 RSC.
- S. Teng, J. J. Tan and A. Tiwari, Curr. Opin. Solid State Mater. Sci., 2014, 18, 29–38 CrossRef CAS.
- Y. Xiayin, H. Bingxin, Y. Jingyun, P. Gang, H. Zhen, G. Chao, L. Deng and X. Xiaoxiong, Chin. Phys. B, 2016, 25, 018802 CrossRef.
- J. C. Bachman, S. Muy, A. Grimaud, H. H. Chang, N. Pour, S. F. Lux, O. Paschos, F. Maglia, S. Lupart, P. Lamp, L. Giordano and Y. Shao-Horn, Chem. Rev., 2016, 116, 140–162 CrossRef CAS PubMed.
- L. Fan, S. Wei, S. Li, Q. Li and Y. Lu, Adv. Energy Mater., 2018, 8, 1702657 CrossRef.
- S. Ramakumar, C. Deviannapoorani, L. Dhivya, L. S. Shankar and R. Murugan, Prog. Mater. Sci., 2017, 88, 325–411 CrossRef CAS.
- Z. G. Xue, D. He and X. L. Xie, J. Mater. Chem. A, 2015, 3, 19218–19253 RSC.
- W. Zhou, S. Wang, Y. Li, S. Xin, A. Manthiram and J. B. Goodenough, J. Am. Chem. Soc., 2016, 138, 9385–9388 CrossRef CAS PubMed.
- Y. Li, B. Xu, H. Xu, H. Duan, X. Lu, S. Xin, W. Zhou, L. Xue, G. Fu, A. Manthiram and J. B. Goodenough, Angew. Chem., Int. Ed., 2017, 56, 753–756 CrossRef CAS PubMed.
- L. Chen, Y. Li, S.-P. Li, L.-Z. Fan, C.-W. Nan and J. B. Goodenough, Nano Energy, 2018, 46, 176–184 CrossRef CAS.
- S. H. Lee, A. Mahadevegowda, C. Huang, J. D. Evans and P. S. Grant, J. Mater. Chem. A, 2018, 6, 13133–13141 RSC.
- S. H. Lee, C. Huang, C. Johnston and P. S. Grant, Electrochim. Acta, 2018, 292, 546–557 CrossRef CAS.
- N. Nitta, F. X. Wu, J. T. Lee and G. Yushin, Mater. Today, 2015, 18, 252–264 CrossRef CAS.
- L. X. Yuan, Z. H. Wang, W. X. Zhang, X. L. Hu, J. T. Chen, Y. H. Huang and J. B. Goodenough, Energy Environ. Sci., 2011, 4, 269–284 RSC.
- X. F. Tu, Y. K. Zhou and Y. J. Song, Appl. Surf. Sci., 2017, 400, 329–338 CrossRef CAS.
- D. Di Lecce and J. Hassoun, J. Phys. Chem. C, 2015, 119, 20855–20863 CrossRef CAS.
- H. Guo, X. D. Zhang, W. He, X. N. Yang, Q. Z. Liu, M. Li and J. C. Wang, RSC Adv., 2016, 6, 16933–16940 RSC.
- M. Park, X. C. Zhang, M. D. Chung, G. B. Less and A. M. Sastry, J. Power Sources, 2010, 195, 7904–7929 CrossRef CAS.
- P. P. Prosini, M. Lisi, D. Zane and M. Pasquali, Solid State Ionics, 2002, 148, 45–51 CrossRef CAS.
- Y. Zhou, J. Wang, Y. Hu, R. O'Hayre and Z. Shao, Chem. Commun., 2010, 46, 7151–7153 RSC.
- M. Broussely, P. Biensan, F. Bonhomme, P. Blanchard, S. Herreyre, K. Nechev and R. J. Staniewicz, J. Power Sources, 2005, 146, 90–96 CrossRef CAS.
- Y. R. Zhao, Z. Huang, S. J. Chen, B. Chen, J. Yang, Q. Zhang, F. Ding, Y. H. Chen and X. X. Xu, Solid State Ionics, 2016, 295, 65–71 CrossRef CAS.
- H. Zhou, Y. Wang, H. Li and P. He, ChemSusChem, 2010, 3, 1009–1019 CrossRef CAS PubMed.
- Y. C. Jung, S. M. Lee, J. H. Choi, S. S. Jang and D. W. Kim, J. Electrochem. Soc., 2015, 162, A704–A710 CrossRef CAS.
- M. R. Busche, T. Drossel, T. Leichtweiss, D. A. Weber, M. Falk, M. Schneider, M. L. Reich, H. Sommer, P. Adelhelm and J. Janek, Nat. Chem., 2016, 8, 426–434 CrossRef CAS PubMed.
- P. He, T. Zhang, J. Jiang and H. Zhou, J. Phys. Chem. Lett., 2016, 7, 1267–1280 CrossRef CAS PubMed.
- Y. C. Jung, M. S. Park, C. H. Doh and D. W. Kim, Electrochim. Acta, 2016, 218, 271–277 CrossRef CAS.
- S. K. Kim, Y. C. Jung, D. H. Kim, W. C. Shin, M. Ue and D. W. Kim, J. Electrochem. Soc., 2016, 163, A974–A980 CrossRef CAS.
- S. Gu, X. Huang, Q. Wang, J. Jin, Q. S. Wang, Z. Y. Wen and R. Qian, J. Mater. Chem. A, 2017, 5, 13971–13975 RSC.
- M. Keller, G. B. Appetecchi, G.-T. Kim, V. Sharova, M. Schneider, J. Schuhmacher, A. Roters and S. Passerini, J. Power Sources, 2017, 353, 287–297 CrossRef CAS.
- Q. Pan, D. Barbash, D. M. Smith, H. Qi, S. E. Gleeson and C. Y. Li, Adv. Energy Mater., 2017, 7, 1701231 CrossRef.
- M. Cheng, Y. Jiang, W. Yao, Y. Yuan, R. Deivanayagam, T. Foroozan, Z. Huang, B. Song, R. Rojaee, T. Shokuhfar, Y. Pan, J. Lu and R. Shahbazian-Yassar, Adv. Mater., 2018, 30, e1800615 CrossRef.
- M. Keller, A. Varzi and S. Passerini, J. Power Sources, 2018, 392, 206–225 CrossRef CAS.
- M. S. Park, Y. C. Jung and D. W. Kim, Solid State Ionics, 2018, 315, 65–70 CrossRef CAS.
- W. Q. Zhang, J. H. Nie, F. Li, Z. L. Wang and C. Q. Sun, Nano Energy, 2018, 45, 413–419 CrossRef CAS.
- Y. W. Zheng, Q. W. Pan, M. Clites, B. W. Byles, E. Pomerantseva and C. Y. Li, Adv. Energy Mater., 2018, 8, 1801885 CrossRef.
- X. Zhao, B. T. Chu, B. Ballesteros, W. Wang, C. Johnston, J. M. Sykes and P. S. Grant, Nanotechnology, 2009, 20, 065605 CrossRef PubMed.
- C. Huang, N. Grobert, A. A. R. Watt, C. Johnston, A. A. R. Watt, C. Johnston, A. Crossley, N. P. Young and P. S. Grant, Carbon, 2013, 61, 525–536 CrossRef CAS.
- C. Huang and P. S. Grant, Sci. Rep., 2013, 3, 2393 CrossRef PubMed.
- C. Huang, N. P. Young and P. S. Grant, J. Mater. Chem. A, 2014, 2, 11022–11028 RSC.
- C. Huang, J. Zhang, H. J. Snaith and P. S. Grant, ACS Appl. Mater. Interfaces, 2016, 8, 20756–20765 CrossRef CAS PubMed.
- C. Huang, J. Zhang, N. P. Young, H. J. Snaith and P. S. Grant, Sci. Rep., 2016, 6, 25684 CrossRef CAS.
- C. Huang, N. P. Young, J. Zhang, H. J. Snaith and P. S. Grant, Nano Energy, 2017, 31, 377–385 CrossRef CAS.
- C. Huang and P. S. Grant, J. Mater. Chem. A, 2018, 6, 14689–14699 RSC.
Footnote |
| † Electronic supplementary information (ESI) available. See DOI: 10.1039/c9ta03824h |
| This journal is © The Royal Society of Chemistry 2019 |

