Microwave-assisted synthesis of black phosphorus quantum dots: efficient electrocatalyst for oxygen evolution reaction†
Munkhbayar
Batmunkh
 *a,
Munkhshur
Myekhlai
b,
Abdulaziz S. R.
Bati
 a,
Susanne
Sahlos
c,
Ashley D.
Slattery
d,
Tania M.
Benedetti
b,
Vinicius R.
Gonçales
b,
Christopher T.
Gibson
 ce,
J. Justin
Gooding
 b,
Richard D.
Tilley
 b and
Joseph G.
Shapter
 *ac
*ac
aAustralian Institute for Bioengineering and Nanotechnology, The University of Queensland, Brisbane, Queensland 4072, Australia. E-mail: m.batmunkh@uq.edu.au; j.shapter@uq.edu.au
bSchool of Chemistry, The University of New South Wales, Sydney, New South Wales 2052, Australia
cFlinders Institute for NanoScale Science and Technology, College of Science and Engineering, Flinders University, Adelaide, South Australia 5042, Australia
dAdelaide Microscopy, The University of Adelaide, Adelaide, South Australia 5005, Australia
eFlinders Microscopy and Microanalysis, College of Science and Engineering, Flinders University, Adelaide, South Australia 5042, Australia
First published on 10th May 2019
Abstract
A simple and efficient approach to produce high quality black phosphorus quantum dots (BPQDs) in a common organic solvent using a microwave technique is developed in this work. This novel approach produces a stable dispersion of crystalline BPQDs with an average lateral size of 2.95 nm and thickness of 3.59 nm. We demonstrated that the as-prepared BPQDs can be an efficient electrocatalyst for the oxygen evolution reaction (OER). Our BPQDs without any supporting catalyst exhibited an impressive electrocatalytic activity for OER with an overpotential of 450 mV at 10 mA cm−2, whilst the traditional CoOx electrocatalyst showed an overpotential of 480 mV. By integrating our BPQDs with CoOx, we achieved an outstanding electrocatalytic OER performance with an overpotential of 360 mV at 10 mA cm−2, a low Tafel slope of 58.5 mV dec−1 and excellent stability, which was even comparable to the commercial IrO2 and RuO2 systems. This work introduces a promising protocol to prepare scalable BPQDs for real-world applications including electrocatalysis.
Phosphorus is one of the most earth-abundant elements. It has been extensively used in many applications (i.e. matchsticks, fireworks and fertilisers) and plays an important biological role in a human body.1 Phosphorus has three major allotropes; namely white phosphorus (WP), red phosphorus (RP) and black phosphorus (BP). In particular, BP is a layered semiconductor with a tunable bandgap.2 The discovery of BP dates back more than a century ago (first reported in 1914).3 However, it had not attracted any significant attention until recently. The successful exfoliation of BP by two independent research groups in early 2014 ignited a surge of activities in many research fields.4,5 The novel properties of BP are fundamentally rooted in its unique structure and make it a promising candidate for a broad range of applications.6–8
Zero-dimensional (0D) black phosphorus quantum dots (BPQDs) are a new form of BP nanostructures that have attracted much attention over the past half-decade. To date, many exciting applications of BPQDs have been explored9 including a wide range of fields such as solar cells,10 electronics,11 batteries,12 sensing,13 cancer imaging14 and catalysis.15 Widespread interest in BPQDs results from their unique structure and fascinating properties, which include a broadband absorption, tunable bandgap and high carrier mobility.16,17 Recent studies have shown that the BPQDs possess high conductivity and abundant electrocatalytic active sites for the oxygen evolution reaction (OER).15,18,19 The OER is a fundamental process for many clean energy systems like water splitting and rechargeable metal–air batteries.20,21 Currently, precious metal-based materials (e.g. IrO2, RuO2) are the most efficient electrocatalysts for the OER,22,23 but their high cost and scarcity limit the large-scale production of these technologies. Therefore, developing efficient and low-cost electrocatalysts for the OER has been the subject of intense investigation.
Although previously reported BPQDs show some promise as electrocatalytic materials, the lack of an established (efficient and facile) synthetic approach to produce BPQDs still remains a challenge. Ultrasonication is the most widely used technique to prepare BPQDs in common solvents.16,24,25 However, this method suffers from long processing times (several hours) and yields some structural defects in the product. Recently, researchers have reported some alternative methods such as solvothermal, milling, blending and electrochemical exfoliation to prepare solution processed BPQDs.13,18,26,27 However, these currently available synthetic methods are still time-consuming, costly and complicated. Therefore, there is still an urgent demand for the development of facile, efficient and controllable methods to prepare high quality BPQDs.
In this communication, we introduce a novel, facile and efficient method to produce solution processed BPQDs using microwave (MW)-assisted exfoliation method. The as-prepared BPQDs show interesting features including strong photoabsorption, uniform size distribution, high crystallinity and excellent yields. More importantly, our BPQDs showed impressive electrocatalytic activity toward the OER.
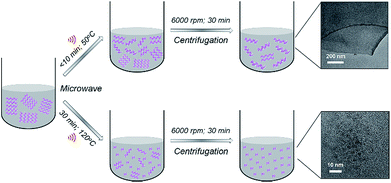
BPQDs were prepared in N-methyl-2-pyrrolidone (NMP) using a facile MW-assisted technique. Recently, we reported the synthesis of solution processed few-layer BP (FL-BP) nanosheets using a novel MW-assisted liquid-phase exfoliation (LPE).28 The as-produced FL-BP nanosheets showed great features and are promising for many applications.29–31 Our MW-assisted LPE requires very short processing times (10 min) (at 50 °C temperature) to produce a highly stable dispersion of FL-BP nanosheets (Fig. 1). During the exfoliation over 10 min, the van der Waals interaction between the BP flakes weakens facilitating layer by layer exfoliation. In this work, we show that by further increasing the processing time (to 30 min) and temperature (to 120 °C), ultrasmall BPQDs can be prepared in NMP via the MW-assisted method (Fig. 1). By applying longer time at higher temperature, as compared to the conditions used to produce FL-BP nanosheets, the BP flakes gradually becomes smaller and producing BPQDs.
 | ||
| Fig. 1 Schematic illustration of controllable synthesis of 2D few-layer BP (FL-BP) nanosheets and 0D BPQDs in NMP using a MW-assisted technique. | ||
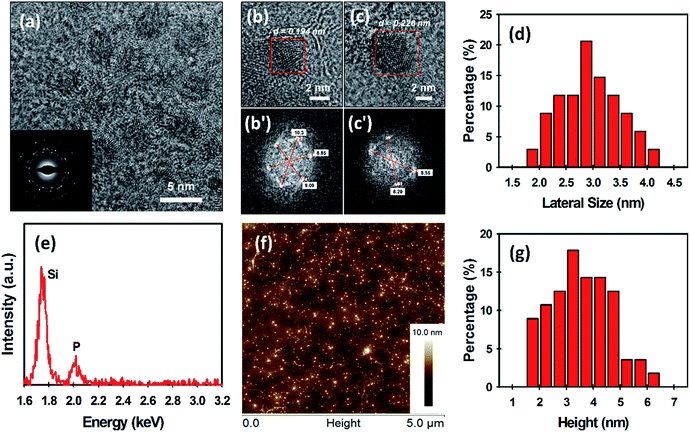
The morphology of the as-prepared BPQDs was examined by transmission electron microscopy (TEM) and atomic force microscopy (AFM) (Fig. 2). The TEM image in Fig. 2a reveals that ultrasmall BPQDs with a lateral size of no more than 5 nm are produced using our MW-assisted method. As shown in the inset of Fig. 2a, selected area electron diffraction (SAED) suggests that our BPQDs are highly crystalline, which is consistent with previous reports of BP crystal structure.18,32 Furthermore, high-resolution TEM (HRTEM) images of the BPQDs are depicted in Fig. 2b and c. Fast Fourier transform (FFT) of these two images in regions with suspected BPQDs can be done to measure the lattice spacing (see Fig. 2b′ and c′). FFT is a more accurate way to measure lattice spacing than directly measuring from the HRTEM image. Lattice spacing is given by full width between bright dots, divided by two, then inversed (units are inverse nanometres (nm−1)); spacing (d) = 1/(radial distance from centre) (Fig. 2b′ and c′). Two lattice spacings, particularly d1 = 0.194 nm (Fig. 2b′) and d2 = 0.226 nm (Fig. 2c′), were obtained from the FFT. The calculated values in this work agree very well with previous reports of the lattice spacing of BPQDs (1.86 Å and 2.26 Å).11,18 We further measured the lateral size of our BPQDs from TEM images containing 34 individual QDs. The measured average lateral size was 2.95 ± 0.59 nm (see Fig. 2d), confirming uniform production of ultrasmall BPQDs. An elemental analysis of BPQDs on a silicon substrate was also carried out using Energy-dispersive X-ray (EDX) spectroscopy (Fig. 2e). We further used X-ray diffraction (XRD) to confirm the crystal structure of our BPQDs. The XRD pattern depicted in Fig. S1a† is in excellent agreement with previously reported BPQDs and bulk BP,33 indicating that our BPQDs are highly crystalline.
Fig. 2f shows a representative AFM image of the BPQDs. It can be seen from Fig. 2f that a large number of ultrasmall BPQDs are uniformly distributed in the sample. In order to accurately measure the height of the BPQDs, we used two sections in the X-axis and Y-axis (see Fig. S2†). Four height measurements (X1, X2, Y1 and Y2) on single BPQD were made and averaged to obtain an average height. Statistical analysis of the height of 58 BPQDs measured from AFM images has been summarised in Table S1.† The measured average thickness of our BPQDs was 3.59 ± 1.12 nm (Fig. 2g), suggesting 3 to 6 layers of BP (considering a monolayer BP is 0.85 nm thick).5
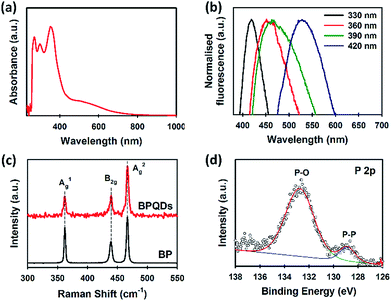
UV-vis spectroscopy is an effective tool to characterise solution processed BP. Our BPQDs dispersion was further characterised using UV-vis spectroscopy (Fig. 3a). Three main absorption peaks at 269, 297 and 352 nm were observed and are in excellent agreement with recent theoretical34 and experimental reports.35 More importantly, these peaks of our BPQDs were very strong and sharp as compared to the peaks observed in previous studies,11,35 indicating that MW-assisted LPE method produces high quality BPQDs. In addition to these three characteristic peaks, our BPQDs solution showed a broad absorption from 430 nm to 740 nm, which is consistent with recent experimental finding by Tang et al.11 Density-functional theory (DFT) calculations reported in Niu et al.34 also showed similar absorption spectra for pure BPQDs due to the electron excitation transitions from the optimised ground state to the first excited singlet state. Fluorescence spectroscopy was further used to analyse our BPQD dispersion. The fluorescence spectra of our BPQDs were measured at different excitation wavelengths varying from 330 to 420 nm (Fig. 3b). It can be seen from Fig. 3b that the emission peak is red-shifted from 419 to 529 nm along with the increase of the excitation wavelength from 330 to 420 nm, respectively. This excitation wavelength-dependent fluorescence of BPQDs is well documented in the literature and can be attributed to the polydispersity of BP QDs.36,37
 | ||
| Fig. 3 (a) UV-vis spectrum and (b) normalised fluorescence spectra of BPQDs in NMP. (c) Raman spectra of bulk BP and BPQDs. (d) High-resolution XPS spectrum of P 2p of the BPQDs. | ||
Fig. 3c shows the Raman spectra of bulk BP and BPQDs. The three prominent peaks at 361.5, 440.1 and 466.9 cm−1,24 which can be assigned to the characteristic A1g, B2g, and A2g phonon modes, respectively were observed for our BPQDs. However, no noticeable shift in the Raman spectra of the bulk BP and BPQDs was observed, which is not surprising since our TEM and AFM analysis indicates that the BPQDs are 3–6 layers.38 We further used X-ray photoelectron spectroscopy (XPS) to characterise our BPQDs (Fig. S1b†). The high-resolution P 2p spectrum (Fig. 3d) shows a peak at around 128.7 eV which can be assigned to the P–P binding peak. However, our BPQDs also show a peak in the high-energy region at around 132.9 eV due to the highly oxidised state (P–O). It is well known that BP derivatives are very sensitive to oxygen.8 In particular, the surface oxidation occurs much more readily on BPQDs as compared to the few-layer BP.16,35
As a proof of concept, we used our BPQDs as an electrocatalyst material for OER. For comparison, traditional CoOx nanoparticles were also synthesised and used as catalyst for OER. The successful synthesis of the CoOx nanoparticles was corroborated by the XPS survey and high-resolution Co 2p spectra (Fig. S3†). TEM images in Fig. S4† revealed that the average particle size of the CoOx was around 3.4 nm. It should be noted that based on our XPS (Fig. S3†) and XRD analysis (Fig. S5†) analysis, we found that the as-prepared cobalt oxide contains both Co3O4 and CoO. As such, the sample is termed “CoOx”.
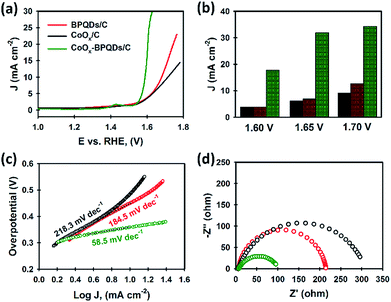
All electrocatalysts (BPQDs, CoOx and CoOx–BPQDs) were immobilised on carbon powder as support (electrocatalytically inactive) for the catalytic study. Three electrodes using BPQDs/C, CoOx/C and CoOx–BPQDs/C were fabricated and their electrocatalytic activities were tested toward OER in 1.0 M KOH solution as the electrolyte. For the preparation of CoOx–BPQDs/C, the BPQD dispersion was added into the CoOx/C, followed by sonication. The presence of both BPQDs and CoOx in the composite was confirmed by XRD (Fig. S5†). Their linear sweep voltammetry (LSV) curves are presented in Fig. 4a. Our BPQDs without any supporting electrocatalyst exhibited an overpotential of 450 mV, to reach a current density of 10 mA cm−2, a value commonly used to evaluate the electrocatalytic activity. Here, we note that the overpotential was calculated with 10 Ω iR correction. Promisingly, this overpotential (450 mV) obtained using our BPQDs was smaller than the values reported in literature on BP nanosheets and BPQDs, and comparable to functionalised BP derivatives (see Table S2†). Moreover, the electrocatalytic performance of our BPQDs was even slightly better than the traditional CoOx electrocatalyst (480 mV overpotential), despite the fact 10 times lower mass percentage of BPQDs was used for the OER test as compared to the CoOx. This impressive electrocatalytic activity of our BPQDs can be ascribed to their excellent quality and high electronic conductivity.39–41
The CoOx–BPQDs present a much lower overpotential (360 mV) than both individual CoOx and BPQDs. Importantly, the outstanding electrocatalytic performance (360 mV) obtained using our CoOx–BPQDs was comparable to recently reported state-of-the-art electrocatalysts and also commercial catalysts such as IrO2 and RuO2 (see Table S2†). As shown in the bar charts (Fig. 4b), the current density of the CoOx–BPQDs catalysts was significantly higher than sum of the current densities of individual CoOx and BPQDs. For instance, at 1.70 V potential, the CoOx–BPQDs exhibited 34.29 mA cm−2, whilst the BPQDs and CoOx showed 12.72 and 9.10 mA cm−2, respectively. This suggests that the BPQDs are not only electrocatalytically active catalyst, but also show excellent synergistic effect when mixed with another catalyst. It should be noted the masses of BPQDs and CoOx used in the CoOx–BPQDs were kept same as they were used individually for OER test (see Table S3†). We calculated the mass percentage of each component using an Inductively Coupled Plasma-Optical Emission Spectrometry (ICP-MS) and the results have been summarised in Table S3.† The catalytic kinetics for OER on both BPQDs, CoOx and CoOx–BPQDs were also examined from the linear fitting of the Tafel plots of electrocatalysts (see Fig. 4c). The Tafel slope of the CoOx–BPQDs electrocatalyst was measured to be 58.5 mV dec−1, which was significantly lower than that of the individual BPQDs and CoOx.
In order to gain further insight on the internal kinetics of our electrocatalysts for the OER, electrochemical impedance spectroscopy (EIS) was used to measure the charge transfer resistance (Rct) (Fig. 4d). As expected, the BPQDs showed lower Rct than the CoOx-only sample, whilst the Rct was significantly decreased for the CoOx–BPQDs catalyst. The enhanced oxygen evolution using BPQDs originates not only from the high carrier mobility of this material (evidenced by EIS), but also from the excellent quality of our BPQDs which provides abundant electrocatalytic active sites for the OER. Therefore, coupling BPQDs with traditional CoOx provides advanced catalytic activity for the OER.
We further tested the stability of the CoOx/C and CoOx–BPQDs/C electrocatalysts using a chronopotentiometry at a constant current density of 10 mA cm−2 (Fig. S6†). The changes in the overpotential after 120 min for the CoOx and CoOx–BPQDs were about 38 mV and 16 mV, respectively. It is surprising that the BPQDs based electrocatalyst showed better stability than the CoOx-only since exfoliated BP is known to be an unstable material in air, water and light. The excellent stability of CoOx–BPQDs can be elucidated by recent finding by Lee et al.,42 who reported that the exfoliated BP can be stable when it is in a hybrid form.
In summary, we have reported, for the first time, an efficient, facile and controllable procedure for the synthesis of highly crystalline BPQDs using a MW-assisted exfoliation method. We further demonstrated that the as-prepared BPQDs can be an efficient electrocatalyst material for OER. Our BPQDs integrated CoOx electrocatalyst shows advanced electrocatalytic performances for the OER, with an overpotential of 360 mV at 10 mA cm−2, a low Tafel slope of 58.5 mV dec−1 and excellent stability. This work will pave the way to a large variety of unique hybrid electrocatalysts by integrating ultrasmall BPQDs with different catalytic materials, opening up new avenues in the emerging field of electrocatalysis.
Conflicts of interest
There are no conflicts to declare.Acknowledgements
We acknowledge the use of South Australian node of Microscopy Australia (formerly AMMRF) and Australian National Fabrication Facility (ANFF) at Flinders University. The support of the Australian Research Council Discovery Program (Grant No. DP150101354, DP160101301, DP190102659 and FL150100060) is gratefully acknowledged. We also thank Dr Paul E. Shaw of the Centre for Organic Photonics & Electronics in the University of Queensland for the Fluorescence measurements.Notes and references
- H. Liu, Y. Du, Y. Deng and P. D. Ye, Chem. Soc. Rev., 2015, 44, 2732–2743 RSC.
- R. Gusmão, Z. Sofer and M. Pumera, Angew. Chem., Int. Ed., 2017, 56, 8052–8072 CrossRef PubMed.
- P. W. Bridgman, J. Am. Chem. Soc., 1914, 36, 1344–1363 CrossRef CAS.
- L. Li, Y. Yu, G. J. Ye, Q. Ge, X. Ou, H. Wu, D. Feng, X. H. Chen and Y. Zhang, Nat. Nanotechnol., 2014, 9, 372 CrossRef CAS PubMed.
- H. Liu, A. T. Neal, Z. Zhu, Z. Luo, X. Xu, D. Tománek and P. D. Ye, ACS Nano, 2014, 8, 4033–4041 CrossRef CAS PubMed.
- P. C. Debnath, K. Park and Y.-W. Song, Small Methods, 2018, 2, 1700315 CrossRef.
- H. Liu, K. Hu, D. Yan, R. Chen, Y. Zou, H. Liu and S. Wang, Adv. Mater., 2018, 30, 1800295 CrossRef.
- M. Batmunkh, M. Bat-Erdene and J. G. Shapter, Adv. Mater., 2016, 28, 8586–8617 CrossRef CAS PubMed.
- R. Gui, H. Jin, Z. Wang and J. Li, Chem. Soc. Rev., 2018, 47, 6795–6823 RSC.
- M. Batmunkh, M. Bat-Erdene and J. G. Shapter, Adv. Energy Mater., 2018, 8, 1701832 CrossRef.
- X. Tang, H. Chen, J. S. Ponraj, S. C. Dhanabalan, Q. Xiao, D. Fan and H. Zhang, Adv. Sci., 2018, 5, 1800420 CrossRef PubMed.
- Z.-L. Xu, S. Lin, N. Onofrio, L. Zhou, F. Shi, W. Lu, K. Kang, Q. Zhang and S. P. Lau, Nat. Commun., 2018, 9, 4164 CrossRef PubMed.
- C. Zhu, F. Xu, L. Zhang, M. Li, J. Chen, S. Xu, G. Huang, W. Chen and L. Sun, Chem.–Eur. J., 2016, 22, 7357–7362 CrossRef CAS PubMed.
- Z. Sun, Y. Zhao, Z. Li, H. Cui, Y. Zhou, W. Li, W. Tao, H. Zhang, H. Wang, P. K. Chu and X.-F. Yu, Small, 2017, 13, 1602896 CrossRef PubMed.
- X.-D. Zhu, Y. Xie and Y.-T. Liu, J. Mater. Chem. A, 2018, 6, 21255–21260 RSC.
- Z. Sun, H. Xie, S. Tang, X.-F. Yu, Z. Guo, J. Shao, H. Zhang, H. Huang, H. Wang and P. K. Chu, Angew. Chem., Int. Ed., 2015, 54, 11526–11530 CrossRef CAS PubMed.
- N. Fu, C. Huang, P. Lin, M. Zhu, T. Li, M. Ye, S. Lin, G. Zhang, J. Du, C. Liu, B. Xu, D. Wang and S. Ke, J. Mater. Chem. A, 2018, 6, 8886–8894 RSC.
- R. Prasannachandran, T. V. Vineesh, A. Anil, B. M. Krishna and M. M. Shaijumon, ACS Nano, 2018, 12, 11511–11519 CrossRef CAS PubMed.
- X. Ren, J. Zhou, X. Qi, Y. Liu, Z. Huang, Z. Li, Y. Ge, S. C. Dhanabalan, J. S. Ponraj, S. Wang, J. Zhong and H. Zhang, Adv. Energy Mater., 2017, 7, 1700396 CrossRef.
- J. Zhang, Z. Zhao, Z. Xia and L. Dai, Nat. Nanotechnol., 2015, 10, 444 CrossRef CAS PubMed.
- B. Wang, C. Tang, H.-F. Wang, B.-Q. Li, X. Cui and Q. Zhang, Small Methods, 2018, 2, 1800055 CrossRef.
- Y. Hou, X. Zhuang and X. Feng, Small Methods, 2017, 1, 1700090 CrossRef.
- T. Y. Ma, J. L. Cao, M. Jaroniec and S. Z. Qiao, Angew. Chem., Int. Ed., 2016, 55, 1138–1142 CrossRef CAS PubMed.
- X. Zhang, H. Xie, Z. Liu, C. Tan, Z. Luo, H. Li, J. Lin, L. Sun, W. Chen, Z. Xu, L. Xie, W. Huang and H. Zhang, Angew. Chem., Int. Ed., 2015, 54, 3653–3657 CrossRef CAS PubMed.
- S.-T. Han, L. Hu, X. Wang, Y. Zhou, Y.-J. Zeng, S. Ruan, C. Pan and Z. Peng, Adv. Sci., 2017, 4, 1600435 CrossRef PubMed.
- Y. Xu, Z. Wang, Z. Guo, H. Huang, Q. Xiao, H. Zhang and X.-F. Yu, Adv. Opt. Mater., 2016, 4, 1223–1229 CrossRef CAS.
- Z. Sofer, D. Bouša, J. Luxa, V. Mazanek and M. Pumera, Chem. Commun., 2016, 52, 1563–1566 RSC.
- M. Bat-Erdene, M. Batmunkh, C. J. Shearer, S. A. Tawfik, M. J. Ford, L. Yu, A. J. Sibley, A. D. Slattery, J. S. Quinton, C. T. Gibson and J. G. Shapter, Small Methods, 2017, 1, 1700260 CrossRef.
- M. Bat-Erdene, M. Batmunkh, S. A. Tawfik, M. Fronzi, M. J. Ford, C. J. Shearer, L. Yu, M. Dadkhah, J. R. Gascooke, C. T. Gibson and J. G. Shapter, Adv. Funct. Mater., 2017, 27, 1704488 CrossRef.
- M. Batmunkh, A. Shrestha, M. Bat-Erdene, M. J. Nine, C. J. Shearer, C. T. Gibson, A. D. Slattery, S. A. Tawfik, M. J. Ford, S. Dai, S. Qiao and J. G. Shapter, Angew. Chem., Int. Ed., 2018, 57, 2644–2647 CrossRef CAS PubMed.
- M. Z. Rahman, M. Batmunkh, M. Bat-Erdene, J. G. Shapter and C. B. Mullins, J. Mater. Chem. A, 2018, 6, 18403–18408 RSC.
- Z. Guo, H. Zhang, S. Lu, Z. Wang, S. Tang, J. Shao, Z. Sun, H. Xie, H. Wang, X.-F. Yu and P. K. Chu, Adv. Funct. Mater., 2015, 25, 6996–7002 CrossRef CAS.
- S. Seo, B. Park, Y. Kim, H. U. Lee, H. Kim, S. Y. Lee, Y. Kim, J. Won, Y. J. Kim and J. Lee, Appl. Surf. Sci., 2018, 448, 576–582 CrossRef CAS.
- X. Niu, Y. Li, H. Shu and J. Wang, J. Phys. Chem. Lett., 2016, 7, 370–375 CrossRef CAS PubMed.
- M. Lee, Y. H. Park, E. B. Kang, A. Chae, Y. Choi, S. Jo, Y. J. Kim, S.-J. Park, B. Min, T. K. An, J. Lee, S.-I. In, S. Y. Kim, S. Y. Park and I. In, ACS Omega, 2017, 2, 7096–7105 CrossRef CAS PubMed.
- W. Gu, Y. Yan, X. Pei, C. Zhang, C. Ding and Y. Xian, Sens. Actuators, B, 2017, 250, 601–607 CrossRef CAS.
- P. Vishnoi, M. Mazumder, M. Barua, S. K. Pati and C. N. R. Rao, Chem. Phys. Lett., 2018, 699, 223–228 CrossRef CAS.
- A. Favron, E. Gaufrès, F. Fossard, A.-L. Phaneuf-L'Heureux, N. Y. W. Tang, P. L. Lévesque, A. Loiseau, R. Leonelli, S. Francoeur and R. Martel, Nat. Mater., 2015, 14, 826 CrossRef CAS PubMed.
- Q. Jiang, L. Xu, N. Chen, H. Zhang, L. Dai and S. Wang, Angew. Chem., Int. Ed., 2016, 55, 13849–13853 CrossRef CAS PubMed.
- F. Shi, Z. Geng, K. Huang, Q. Liang, Y. Zhang, Y. Sun, J. Cao and S. Feng, Adv. Sci., 2018, 5, 1800575 CrossRef PubMed.
- J. Wang, D. Liu, H. Huang, N. Yang, B. Yu, M. Wen, X. Wang, P. K. Chu and X.-F. Yu, Angew. Chem., Int. Ed., 2018, 57, 2600–2604 CrossRef CAS PubMed.
- H. Uk Lee, S. C. Lee, J. Won, B.-C. Son, S. Choi, Y. Kim, S. Y. Park, H.-S. Kim, Y.-C. Lee and J. Lee, Sci. Rep., 2015, 5, 8691 CrossRef PubMed.
Footnote |
| † Electronic supplementary information (ESI) available: Experimental section and supplemental figures. See DOI: 10.1039/c9ta02513h |
| This journal is © The Royal Society of Chemistry 2019 |


