
Room temperature production of graphene oxide with thermally labile oxygen functional groups for improved lithium ion battery fabrication and performance†
Jiadong
Qin‡
,
Yubai
Zhang‡
,
Sean E.
Lowe
,
Lixue
Jiang
,
Han Yeu
Ling
,
Ge
Shi
,
Porun
Liu
 ,
Shanqing
Zhang
,
Yu Lin
Zhong
* and
Huijun
Zhao
*
,
Shanqing
Zhang
,
Yu Lin
Zhong
* and
Huijun
Zhao
*
Centre for Clean Environment and Energy, School of Environment and Science, Griffith University, Gold Coast Campus, Queensland 4222, Australia. E-mail: y.zhong@griffith.edu.au; h.zhao@griffith.edu.au
First published on 23rd March 2019
Abstract
Graphene oxide (GO) has drawn intense research interest over the past decade, contributing to remarkable progress in its relevant applications. The chemical production of GO, however, is challenged by destructive and slowly propagating oxidation, especially for large flake graphite. Herein, we report a simple but effective method to produce well-oxidized and less defective GO by chemically oxidizing commercially available expandable graphite at room temperature (25 °C). Compared to natural graphite with similar flake sizes, expandable graphite afforded faster complete oxidation under the same oxidizing conditions. In addition, chemical oxidation at room temperature, relative to that at higher temperatures (35 and 45 °C), resulted in a reduced defect concentration in GO. Furthermore, the GO derived from the oxidation of expandable graphite at room temperature exhibited superior electrical conductivity after mild thermal treatment at 150 °C. Considering the energy-saving in both GO synthesis and reduction, the low temperature GO conversion process can be easily integrated into many other electroconductive applications. As a proof of concept, we achieved a good LiFePO4 (without carbon-coating) cathode formulation with our GO, which contributed as a 2D binder (before annealing), and obtained a conductive cathode with improved capacity and high rate performance after mild thermal annealing at 150 °C.
Introduction
Graphene and graphene-based materials are appealing for a myriad of applications, such as energy storage devices,1 electrocatalysis,2 and sensors.3 As one of the most important precursors to graphene materials, graphene oxide (GO) has been widely adopted in both lab-scale research and industrial production due to its excellent chemical processability and production scalability.4–6 Currently, the exfoliation of chemically oxidized graphite, produced via the modified Hummers method, to GO is the most popular GO synthesis method owing to its rich oxygen functional groups and quantitative yield of single-layer GO.7–15 However, the harsh conditions in the strong chemical oxidation will incur permanent defects, uncontrollable functionality and even fragmentation in the resultant GO.16–19 In addition, it is limited by the slow diffusion of oxidizing agents.20 Particularly for large flake graphite, oxidants will have difficulty reaching the core region of the graphite, resulting in non-uniform oxidation and cracking in the GO sheets.18 Therefore, much effort has been put into optimizing the chemical oxidation method, mainly focusing on the starting materials and oxidation conditions.To facilitate oxidation and exfoliation, one strategy is to pre-intercalate graphite to form a graphite intercalation compound (GIC) with increased interlayer spacing and weakened Van der Waals interactions between graphite layers.21 In 1999, Kovtyukhova et al. demonstrated a two-step oxidation method in which natural graphite was pre-intercalated in concentrated H2SO4, K2S2O8 and P2O5, followed by the Hummers method.22 It was later found that the pre-treated graphite was more susceptible to oxidation and exfoliation into monolayer GO sheets and hence the protocol has been adopted in many more recent studies.9,23 This two-step oxidation route, however, presents challenges for the mass production of GO due to the time-consuming pre-treatment, which involves the wetting and drying of graphite. Another strategy is to employ expanded graphite, which features a worm-like structure, as the starting material to produce GO. The expanded graphite is typically achieved by the thermal expansion of graphite bisulfate, a type of graphite intercalation compound (GIC), also known as expandable graphite. In 2009, Luo et al. synthesized high-quality GO sheets using microwave-expanded graphite, where the interlayer galleries were dramatically expanded, as the starting material.24 Since then, several research groups have shown that expanded graphite is a more suitable graphite source for preparing large-area GO sheets than natural graphite.25–27 Recently, Lu et al. proposed a new type of chemically expandable graphite in which the expansion was initiated by oxygen evolution from the chemical reaction of a CrO3 graphite intercalant with H2O2.28 Though the expanded graphite was very readily oxidized even under mild agitation-free conditions, this novel method is challenged by complicated procedures and the introduction of toxic Cr6+ ions.28
With regard to oxidation conditions, Eigler et al. kept the oxidation temperature below 10 °C to yield highly intact GO with preserved structural integrity.29,30 However, this low-temperature method has its limitations, namely time-consuming procedures and low GO yield. Apart from lowering the reaction temperature, it has been reported that the addition of a small amount of water to the chemical oxidation system not only promoted oxidation but also reduced the defects in GO.31,32
Typically, reduction of GO, by which its electrical conductivity can be restored, is required for the majority of applications such as lithium ion batteries (LIBs) and supercapacitors.9,33 The common reduction methods involve chemical reduction (such as with hydrazine and hydroiodic acid)34,35 and thermal treatment at high temperatures.19,36 Zhu and co-workers reduced a GO dispersion in an anhydrous organic solvent, propylene carbonate, by heating at only 150 °C, but for 12 hours.37 The mild thermal reduction, without the need for a reducing agent or high temperature treatment, will be very useful for the incorporation of reduced GO (rGO) into a wide range of electroconductive applications. For example, it has been shown that rGO worked well as the conductive additive in lithium ion battery (LIB) electrodes, effectively improving charge transport due to its good conductivity, high surface area and flexible two dimensional structure.6,36,38 The low temperature thermal treatment could help to simplify the fabrication of LIBs by allowing GO to be blended with electrode materials and then reduced in situ. Due to its good dispersibility in multiple solvents, unreduced GO can be homogeneously mixed with LiFePO4 particles. This can enable the uniform coating/wrapping of GO around the particles, minimizing unwanted polarization in LIBs.39
In this work, we report a mild GO production approach from large-sized expandable graphite (graphite bisulfate, a type of GIC) flakes via the modified Hummers method, resulting in more thorough oxidation than that with natural graphite under the same conditions. We optimized the oxidation temperature and time for this GIC-based GO synthesis and found that well-oxidized GO was obtained at an oxidation temperature of 25 °C for 8 h (denoted as GOGIC-25-8h). This GO, synthesized at room temperature, was found to be less defective and more prone to deoxygenation during low temperature annealing (150 °C). After the 150 °C thermal reduction in air, GOGIC-25-8h restored more sp2 carbon atoms and was also more conductive than other GO oxidized at higher temperatures, which indicates the facile removal of oxygenated functional groups. Our work also demonstrates that the GOGIC-25-8h was able to blend well with a typical LiFePO4 (without carbon-coating) cathode formulation and helped to deliver a pronounced improvement in the capacity and high rate performance of LIBs after the mild thermal annealing process.
Experimental
Materials
The expandable graphite used in the experiments was received from Asbury Graphite Mills (Grade 1721). The natural flake graphite was obtained from Sigma-Aldrich (Product no. 332461). Both graphite sources were carefully sieved to control the flake sizes between 200 and 300 μm for the GO synthesis reactions. KMnO4 (99.0%), concentrated H2SO4 (98%), H2O2 aqueous solution (30% w/w) and hydrochloric acid (32 wt%) were purchased from Chem-Supply. Deionized water was used in all experimental procedures, including the synthesis reaction and purification.Synthesis of graphene oxide from expandable graphite (GIC) and natural graphite (NG) under different conditions
The GO synthesis procedures were based on a modified Hummers method as illustrated in Fig. 1.14,40 Flake graphite (1 g) was mixed with concentrated H2SO4 (50 mL) in a 500 mL three-neck flask which was placed in an ice bath with mechanical stirring at 120 rpm. After cooling to below 10 °C, KMnO4 (3 g) was slowly added to the mixture and the mixture was kept in the ice bath for 1 h. Then, after removing from the ice bath, the temperature was elevated to the designated temperature (25, 35 and 45 °C) at which point the mixture was stirred for a specified period (4, 6 and 8 h.). After this stage, the water bath was replaced by an ice bath to minimize the temperature rise in the following steps. 150 mL of chilled water was slowly dropped into the mixture via a peristaltic pump over a period of 90 min and then the reaction system was kept in the ice bath for another 30 min. At the end of the reaction, H2O2 was added to the mixture dropwise to react away the residual KMnO4 until the color of the resulting product no longer changed. To remove metal ions, 300 mL of a diluted aqueous HCl solution (1![[thin space (1/6-em)]](https://www.rsc.org/images/entities/char_2009.gif) :9) was added to the product. The product was allowed to settle overnight. The resulting sediment was washed with water and centrifuged at 13000 rpm for 15 min repeatedly until the pH of the supernatant stabilized at ∼4. Finally, the resultant sediment was resuspended in deionized water to a total volume of 200 mL. The GO products made from expandable graphite and natural graphite are denoted as GOGIC and GONG, respectively, and the oxidation temperatures and reaction times are abbreviated as, for example, GOGIC-25-4h (the product derived from the GIC at 25 °C, with a 4 h reaction time).
:9) was added to the product. The product was allowed to settle overnight. The resulting sediment was washed with water and centrifuged at 13000 rpm for 15 min repeatedly until the pH of the supernatant stabilized at ∼4. Finally, the resultant sediment was resuspended in deionized water to a total volume of 200 mL. The GO products made from expandable graphite and natural graphite are denoted as GOGIC and GONG, respectively, and the oxidation temperatures and reaction times are abbreviated as, for example, GOGIC-25-4h (the product derived from the GIC at 25 °C, with a 4 h reaction time).
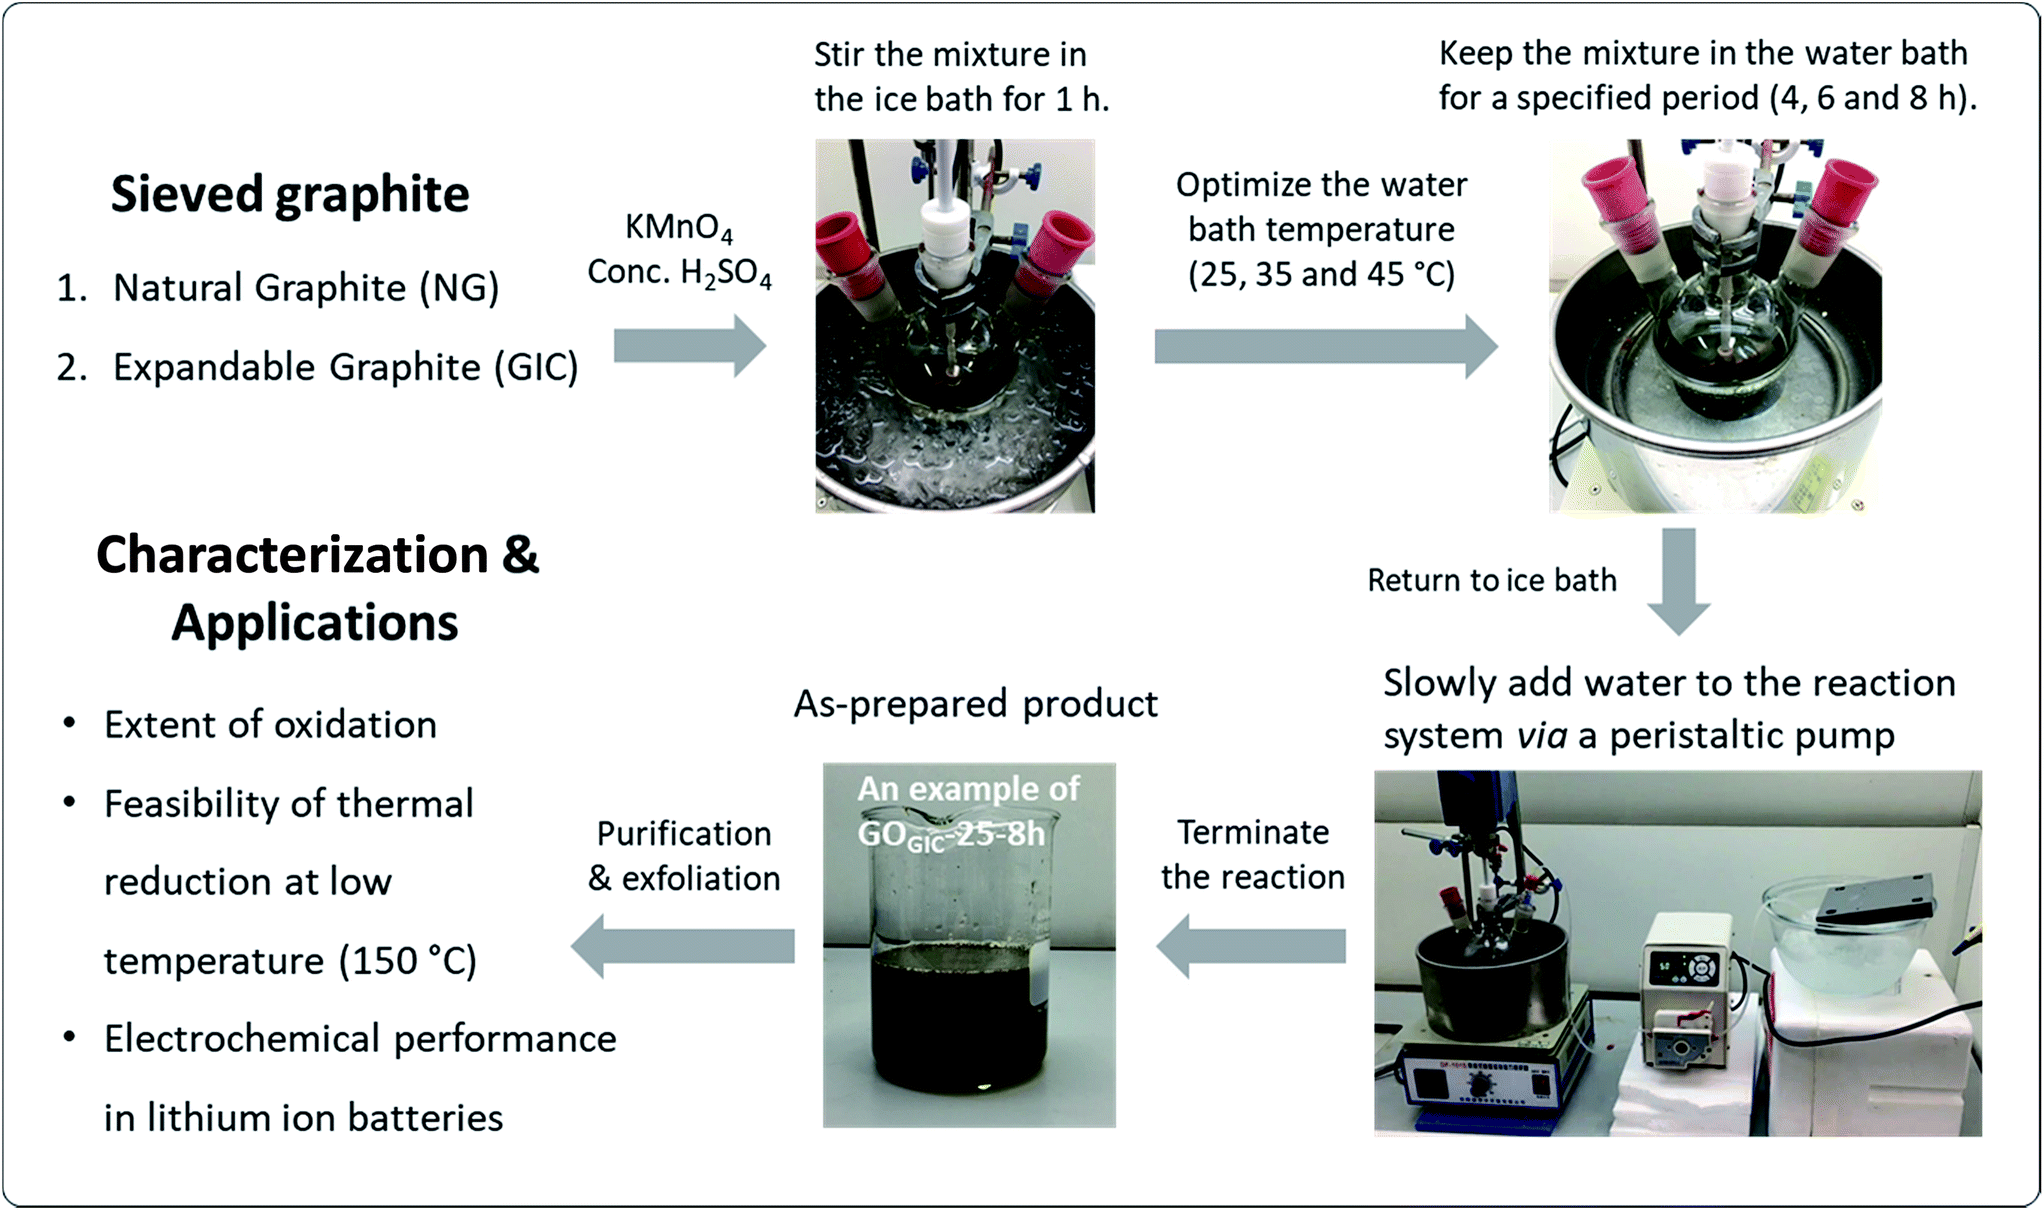 | ||
| Fig. 1 Schematic overview of the experimental design, including GO synthesis routes under different conditions, with different characterization and application tests. | ||
Yield calculation
5 mL of the purified GO aqueous dispersion was cast into a dense film on a nylon membrane via vacuum filtration and then dried in a 60 °C oven overnight. The polymer membrane was then gently peeled off and the weight of the freestanding GO film was used to calculate the concentration of GO (CGO, mg mL−1). The yield of GO was calculated using the equation YGO = CGO × VGO/mGr where VGO is the total volume of the GO solution after purification (200 mL) and mGr is the mass of the starting graphite. In particular, in the case of GOGIC, mGr only refers to the graphite component, excluding the intercalating compounds.Characterization
X-ray diffraction (XRD) patterns were measured on a Bruker D8 ADVANCE diffractometer with Cu Kα radiation (λ = 1.5418 Å). The chemical compositions of GO samples were analyzed by X-ray photoelectron spectroscopy (XPS, Kratos Axis ULTRA incorporating a 165 mm hemispherical electron energy analyzer). Scanning electron microscopy (SEM) was conducted on a JEOL JSM-7500FA microscope with an accelerating voltage of 15.0 kV. Atomic force microscopy (AFM) images were collected using a Bruker Dimension Icon AFM using peak force tapping mode. The statistical analysis of flake thickness was based on the line profiles of ∼80 pieces of GO sheets from AFM images. Raman spectroscopy was carried out on individual GO sheets using a Renishaw inVia Raman microscope with a 532 nm laser. The samples were prepared by spin-coating a diluted GO dispersion (∼0.1 mg mL−1) onto a conductive silicon wafer (for SEM and AFM) or thermal oxide silicon wafer (for Raman analysis). Attenuated-total-reflectance Fourier transform infrared (ATR-FTIR) spectra were acquired on a Bruker Alpha spectrometer equipped with a platinum ATR single-reflection diamond module. TGA of GO film samples was performed on a Netzsch STA 449F3 analyzer in 100% argon or 20% oxygen/80% argon. For the argon atmosphere experiment, GO samples were heated from 50 to 700 °C at a rate of 5 K min−1. For the oxygen atmosphere experiment, the GO samples were rapidly heated from 50 °C to 150, 175 or 200 °C (heating rate: 30 K min−1), and the samples were maintained at the high temperature for 6 h. To measure the graphite content in the expandable graphite (GIC), it was heated from 50 to 1000 °C at a rate of 5 K min−1 under an argon atmosphere. As a contrast, the same TGA test was performed on natural graphite. Electrical conductivity measurements for the rGO films of similar weight (∼100 μg) were conducted on a Jandel RM3000 four-point probe system with a linear array head (probe spacing of 1 mm).LIB testing
To prepare the control LIB cathodes, 10 wt% polyvinylidene difluoride (PVDF), 10 wt% carbon black, and 80 wt% LiFePO4 (LFP) were mixed with N-methyl-2-pyrrolidone (NMP) by magnetic stirring for 24 h. The homogeneous slurry was cast onto aluminium foil and was then dried in an 80 °C vacuum oven for 12 h. The assembly of coin cells (2032) was conducted in an argon-filled glove box. Lithium foil was used as the anode, and 1 M LiPF6 dissolved in ethylene carbonate (EC) and diethyl carbonate (DEC) with a volume ratio of 1:1 served as the electrolyte. The testing voltage in constant current mode ranged from 2.5 to 3.8 V, and the cells were charged in constant voltage mode at 3.8 V until the current reached 10% of the current rate. To show the effect of different reduced GOGIC in LIBs, half of the carbon black was replaced with GOGIC-25-8h and GOGIC-45-4h, respectively, in the cathode compounds. The GO samples in the aqueous dispersions were freeze-dried for the preparation of electrodes. The freeze-dried GOGIC was dispersed into NMP, forming an 8 mg mL−1 dispersion and then LFP, carbon black and PVDF were added. Prior to battery assembly, GOGIC/LFP cathodes were annealed in a 150 °C oven for 5 h in air. The charge and discharge performance tests were carried out using a Neware battery tester (Shenzhen, China) with a potential range between 2.5 and 3.8 V. The cyclic voltammetry (CV) measurement was performed on a CHI 660D electrochemical workstation with a scan rate of 0.1 mV s−1.
Results and discussion
The effects of graphite sources
GO samples were prepared by oxidizing expandable graphite (GIC) and natural graphite (NG), respectively, at different temperatures (25, 35 and 45 °C) for varying duration (4, 6 and 8 h) with the modified Hummers method and the products were examined via X-ray diffraction (XRD). The XRD patterns of the two starting materials (Fig. S1†) showed that GIC had greater interlayer spacing between the graphene layers (3.41 Å vs. 3.36 Å) and lower crystallinity (broader graphitic peak) than NG. This suggests that GIC, with a less compact structure, can provide more accessible paths for the diffusion of oxidizing agents than NG. Experimentally, this advantage of GIC can be demonstrated with the XRD results of GONG and GOGIC (Fig. 2a–c). As displayed in Fig. 2a, despite subjecting it to a prolonged oxidation time (8 h) and sufficiently high temperature (45 °C), GONG still shows a pronounced broad graphitic peak at about 26° (corresponding to the interlayer spacing d ≈ 3.4 Å), which is related to unoxidized graphite.41,42 In addition, for GONG-25-4h and GONG-25-8h, the position of the sharp low-angle peak, also known as the GO peak, did not change and was at about 10.9° (d = 8.1 Å). This suggests that the interlayer distance between GO sheets did not change with the oxidation time at 25 °C.41 In contrast, there was a shift in the GO peak to the left (from 10.6° to 10.1°) when the oxidation time was doubled at 45 °C, which is associated with the interlayer expansion and the oxidation degree of GO.15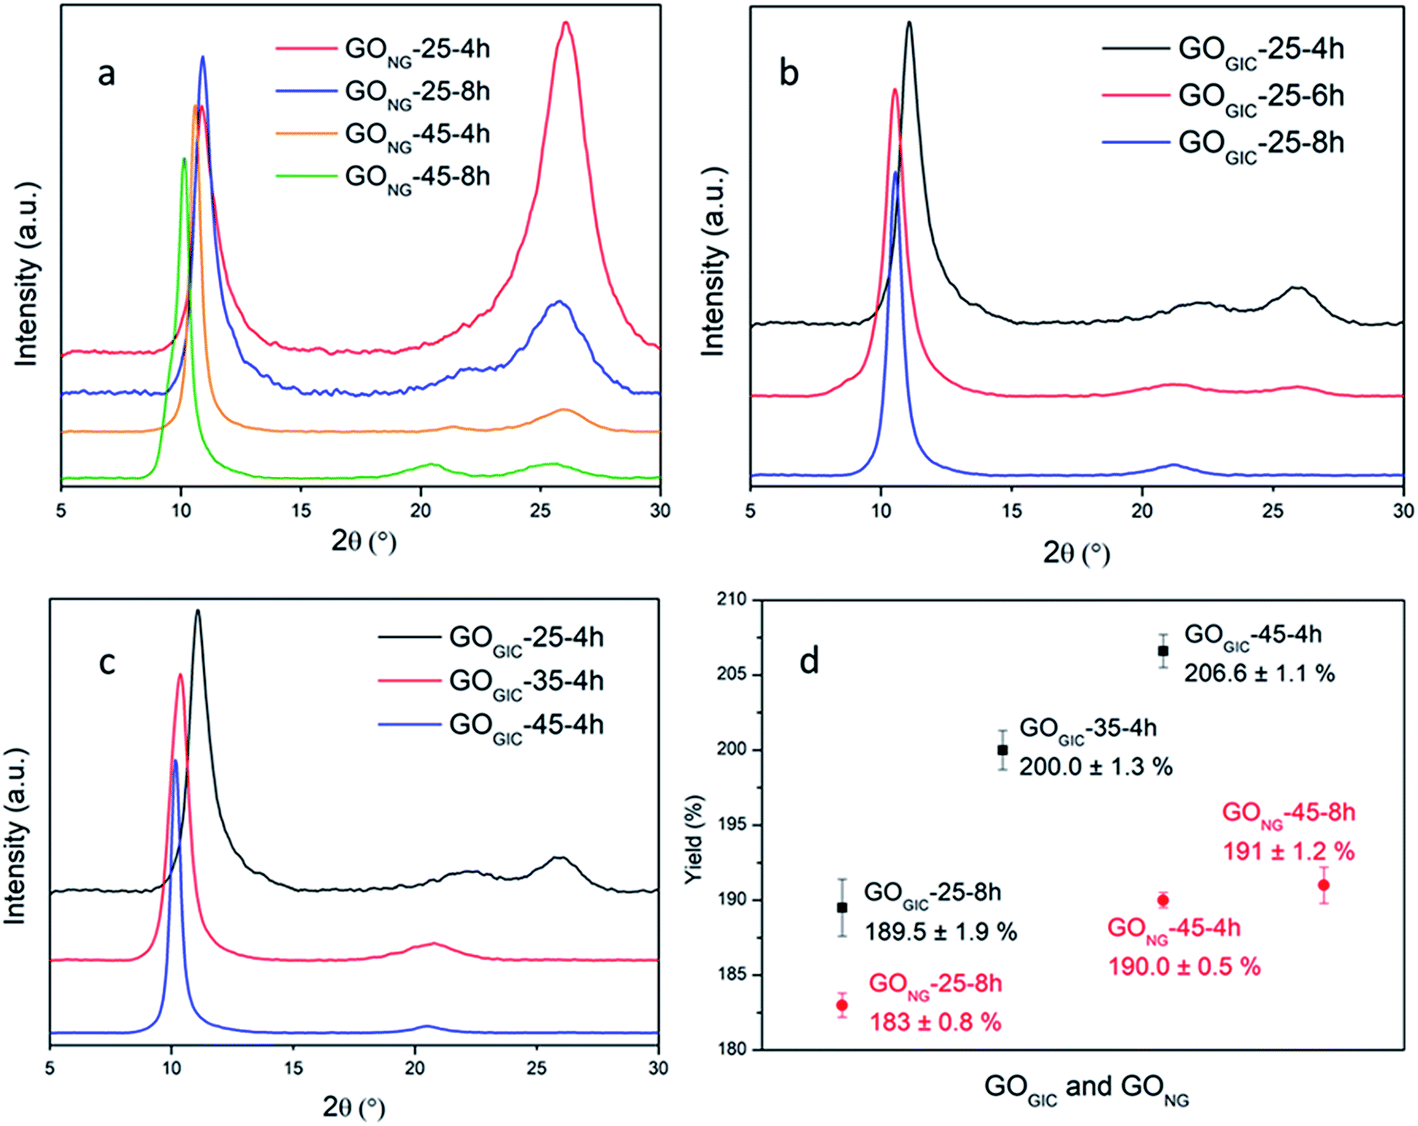 | ||
| Fig. 2 XRD patterns of (a) GONG under different oxidation conditions, (b) GOGIC oxidized at 25 °C for different time periods, and (c) GOGIC oxidized at different temperatures for 4 h. (d) Yield comparison between GONG and GOGIC. | ||
As is evident in Fig. 2b, it is easier to oxidize GIC at 25 °C. The graphitic peak was much weaker in GOGIC-25-4h (relative to that in the product derived from NG under the same oxidation conditions), and the graphitic peak disappeared after prolonging the oxidation time to 8 h. Meanwhile, the left shift in the GO peak (from 11.1° to 10.5°) reflected the expansion in interlayer spacing (from 8.0 Å to 8.4 Å) and hence the slight increase in the degree of oxidation with reaction time at 25 °C. The GIC can also be completely transformed into GO after 4 h of oxidation at higher temperatures of 35 °C and 45 °C, evidenced by the absence of the graphitic peaks in Fig. 2c. Therefore, using GIC as the starting material allows for milder reaction conditions and more effective oxidation. Note that the small and broad peaks at around 21° in the XRD patterns can be attributed to the randomly packed single graphene layers.43
To measure the graphite content in GIC, the material was heated to 1000 °C under an argon atmosphere in order to gasify the intercalants and water and remove any oxygen functionalities.24,44 TGA curves (Fig. S2†) showed that 76 wt% of material remained in GIC, attributed to the graphite component of GIC,45 while NG did not lose any mass after heating to 1000 °C. Therefore, the yield of GOGIC can be calculated with respect to the starting graphitic material and compared with that of GONG, as illustrated in Fig. 2d. In general, the GOGIC had higher yield than GONG under the same reaction conditions and the gap became even wider at higher temperatures due to the greater extent of oxidation in GIC. In comparison to other reported room or low temperature syntheses, our yield of 190% for GOGIC-25-8h is one of the highest so far.29,32,46
Morphological characterization of fully oxidized GOGIC
In the subsequent work, only the fully oxidized samples (GOGIC-25-8h, GOGIC-35-4h and GOGIC-45-4h) were further characterized and compared. The lateral size distributions of GO sheets were obtained statistically from SEM images (Fig. 3a, c and e). For GOGIC-25-8h, GOGIC-35-4h and GOGIC-45-4h, the average sizes were 20.1 ± 17.9, 27.3 ± 18.6 and 24.5 ± 22.0 (mean ± standard deviation) μm, respectively. It is noteworthy that GOGIC-25-8h had the smallest average lateral size as well as the highest content of <20 μm flakes. Although the oxidation proceeded at a lower temperature, GOGIC-25-8h was also subjected to 8 h of mechanical stirring which likely led to the mechanical cleavage of the GO sheets.18,47 Examining the thickness distributions of GOGIC sheets from AFM images (Fig. 3b, d and f), the majority of GOGIC sheets were successfully exfoliated down to a single layer. The single-layer sheets were between 1.0 and 1.5 nm thick, consistent with previous literature reports.15,48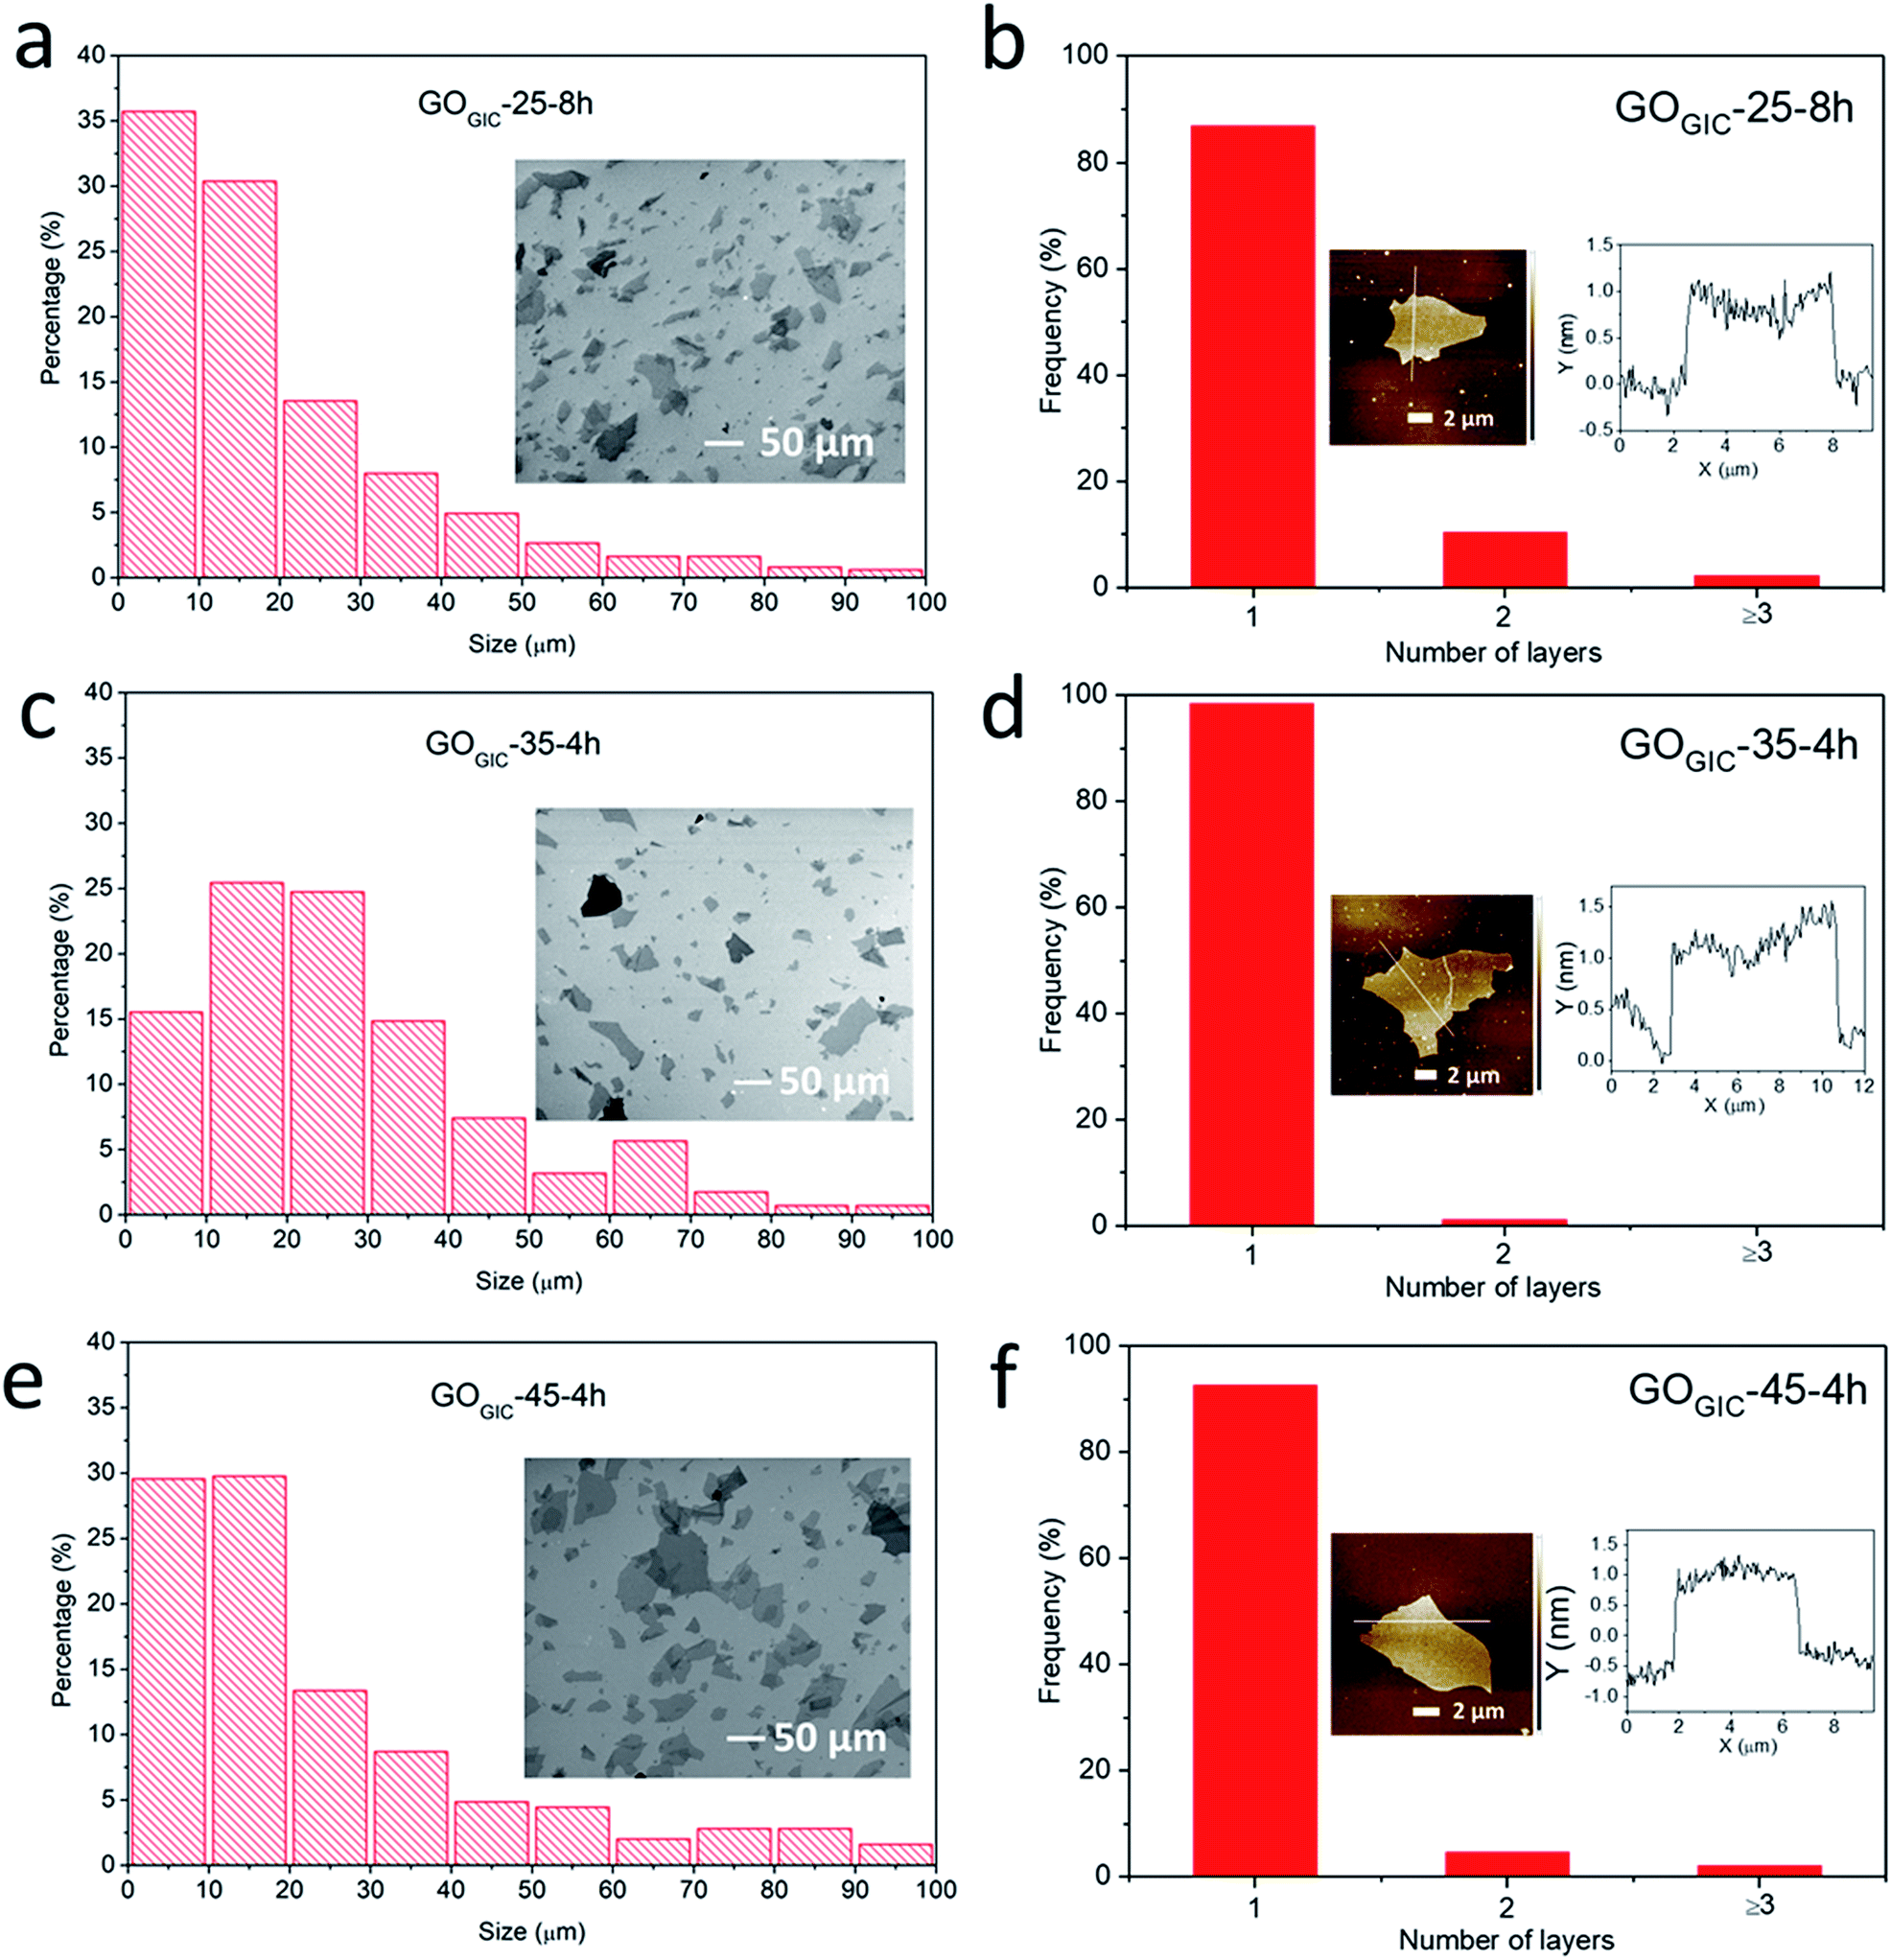 | ||
| Fig. 3 Morphological characterization of fully oxidized GOGIC samples. (a), (c) and (e) SEM images of GOGIC sheets coated onto the Si wafers and the corresponding flake size distributions. (b), (d) and (f) Frequency distributions of the number of layers in the GO samples (statistics were based on more than 80 GO flakes). The insets are the AFM images of the individual GO sheets and their corresponding height profiles. | ||
Chemical characterization of fully oxidized GOGIC before and after thermal reduction
To further investigate the effect of different oxidation conditions, Raman spectroscopy (Fig. S3†) was used to discriminate different carbon atoms, typically featuring D (∼1350 cm−1), G (∼1585 cm−1) and 2D (∼2700 cm−1) peaks. The D peak is attributed to the breathing modes of six-atom carbon rings in proximity to defect areas. The 2D peak is the overtone of the D peak, while the G peak is related to the motion of sp2 carbon atoms.49 The ratio of the defect-activated D peak to G peak is an important parameter to reveal the defect density in GO. According to Ferrari and Robertson,50 for graphene materials, ID/IG initially increases with defect density at a low defect concentration (stage 1) and subsequently decreases after reaching a certain defect concentration (stage 2). From the Raman spectra of various GOGIC in Fig. S3,† it can be seen that the value of ID/IG tends to decrease with a longer oxidation time or higher temperature. Therefore, all GOGIC samples were likely to be in the stage 2 state because more defects will be introduced into the honeycomb lattice in graphene layers as the chemical oxidation proceeds or the temperature increases.18,29 Comparing the fully oxidized GOGIC samples (Fig. 4a), the defect density increased in the following sequence: GOGIC-25-8h < GOGIC-35-4h < GOGIC-45-4h.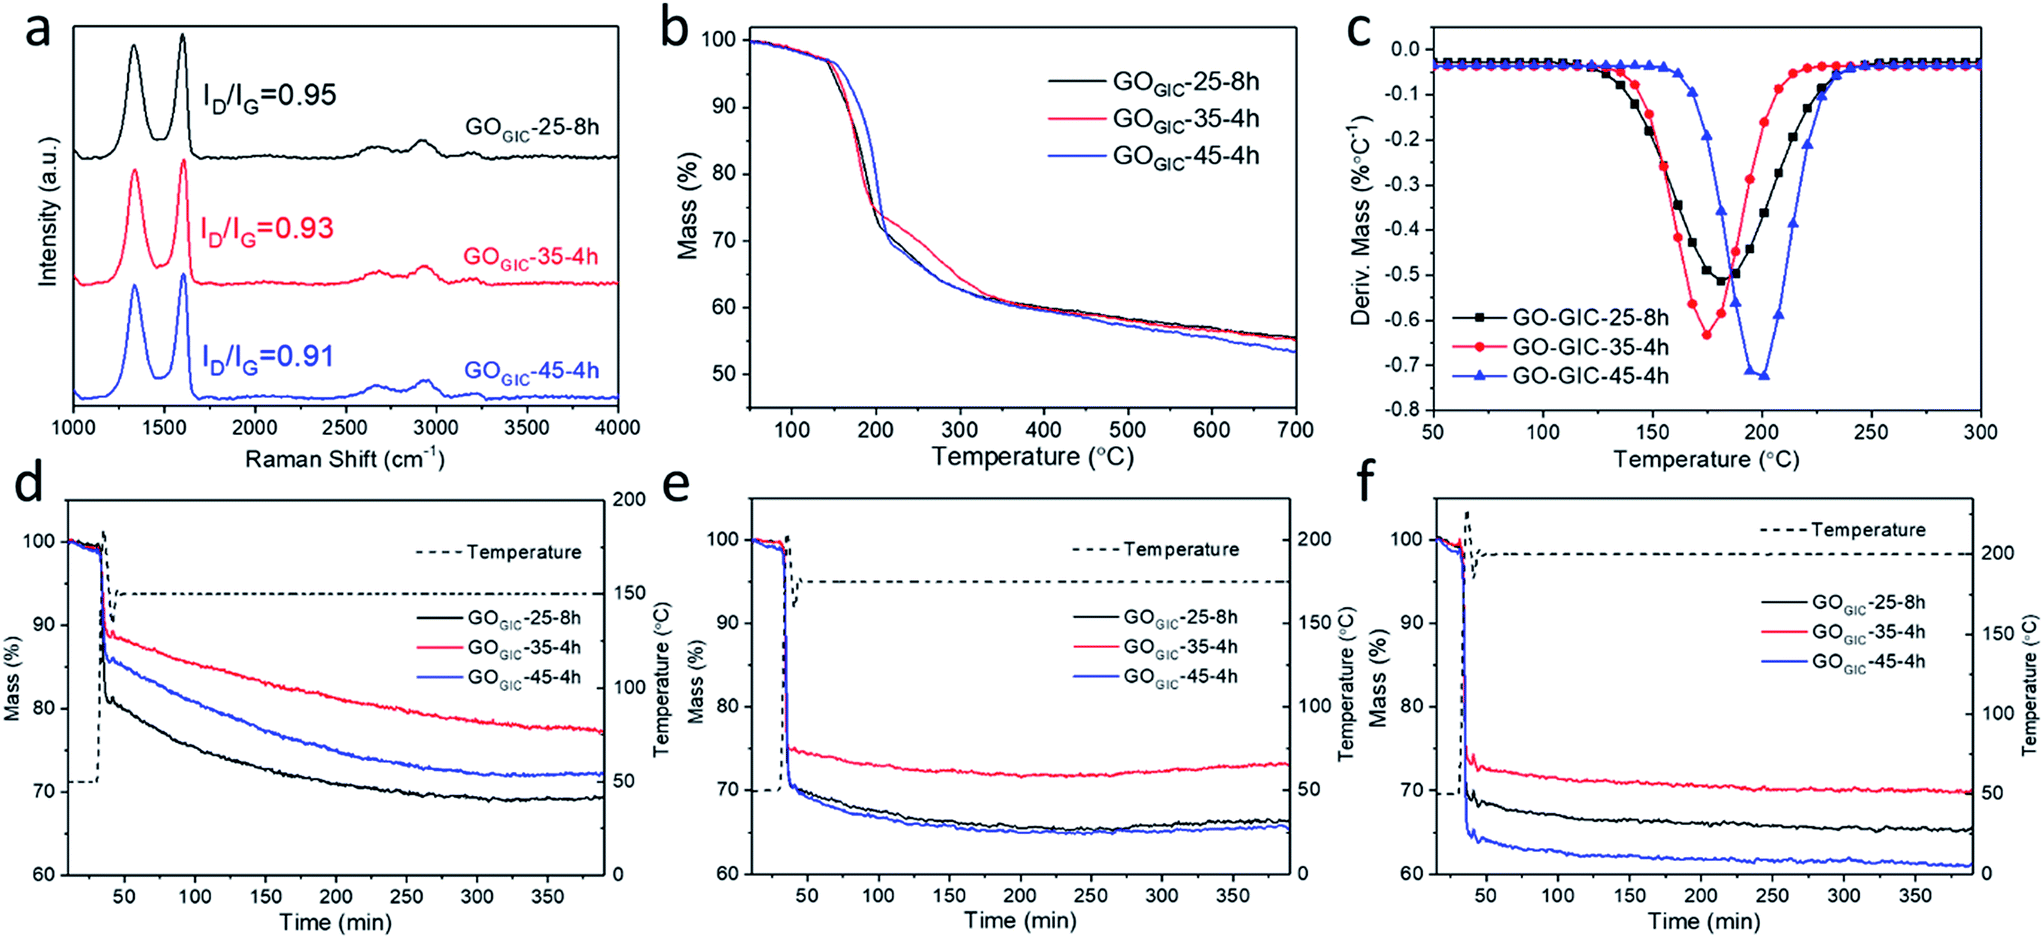 | ||
| Fig. 4 Chemical properties of different GOGIC samples. (a) Raman spectra of GOGIC flakes. (b) TGA curves for heating GO in argon at a 5 K min−1 heating rate. (c) The corresponding first derivative of the TGA curves in the temperature range 50–300 °C. (d–f) TGA curves for thermal annealing of GOGIC at 150, 175 and 200 °C under a 20% oxygen/80% argon atmosphere. | ||
The weight change in GOGIC with increasing temperature was tracked using thermogravimetric analysis (TGA, Fig. 4b), and it was found that the greatest weight loss was observed for GOGIC-45-4h. Only 53.6% of the material remained after heating to 700 °C, which suggests that it had the highest content of thermally labile oxygenated functional groups. Moreover, the corresponding first derivative TGA curves (Fig. 4c) were plotted to give insight into the peak decomposition temperature (Td) where GO samples underwent the greatest rate of change in the weight.31,32 It was obvious that GOGIC-45-4h had a higher Td (198 °C) than GOGIC-25-8h (181 °C) and GOGIC-35-4h (175 °C). In fact, the removal of oxygenated functional groups from GO basal planes is always accompanied by the formation of various gases, including CO2, CO and H2O.51 Because the gasification process must overcome the interlayer interactions, it can be inferred that GOGIC-45-4h with the highest Td had the greatest amount of carboxyl groups with strong hydrogen bonding ability.31
Mild thermal annealing in ambient air is a simple and effective method to deoxygenate GO.52 On comparing the weight changes of GOGIC annealed at different constant temperatures (Fig. 4d–f), it was seen that GOGIC-25-8h exhibited the most weight loss at 150 °C, relative to other conditions, while GOGIC-45-4h lost more weight at 175 and 200 °C, implying that deoxygenation of GOGIC-25-8h occurred more readily at lower temperatures than that of GOGIC-45-4h. As shown in Table S1,† the percentage of residual mass changed from 69% to 65% in GOGIC-25-8h as the annealing temperature was raised from 150 to 200 °C. This change was much smaller than that in GOGIC-35-4h or GOGIC-45-4h, also indicative of the easier deoxygenation of GOGIC-25-8h at 150 °C. In addition, GOGIC-35-4h always experienced the lowest mass reduction, regardless of the annealing temperature, suggesting that GOGIC-35-4h was less oxidized than GOGIC-25-8h and GOGIC-45-4h. This was consistent with the XPS survey scan which showed that GOGIC-35-4h had the highest C/O ratio (Fig. S4†). In addition, during the 150 °C thermal treatment, the residual weights of GOGIC-25-8h and GOGIC-45-4h became stable after 5 h (Fig. 4d), corresponding to the completion of thermal reduction.
The XPS C 1s peak (Fig. 5) can be deconvoluted into five components, including C![[double bond, length as m-dash]](https://www.rsc.org/images/entities/char_e001.gif) C/C–C in aromatic rings (284.6 eV), C–O (286.1 eV), CO (287.5 eV), COOH (289.0 eV) and π–π* satellite (290.6 eV),53 and the fractions of these components in each sample are summarized in Tables S2 and S3.† Among the GOGIC samples (Fig. 5a, c, and e and Table S2†), the highest fraction of CC/C–C was found in GOGIC-35-4h (56.6%) and the lowest was in GOGIC-45-4h (45.1%), which indicated that GOGIC-35-4h retained the most intact sp2 graphitic carbon while GOGIC-45-4h was the most oxygen-functionalized. GOGIC-25-8h had the least amount of CO and COOH (7.33%) compared to GOGIC-35-4h (7.62%) and GOGIC-45-4h (9.53%). Due to the fact that carbonyl and carboxyl groups preferentially form at the edge of GO flakes or vacancy defects,31,53,54 GOGIC-25-8h was the least defective among all fully oxidized GOGIC samples, consistent with results from the Raman spectra (Fig. 4a) and the previous reports for GO produced at room temperature.32 Hence, room-temperature oxidation can more effectively maintain the structural integrity of GO. Comparing the ATR-FTIR spectra of GOGIC (Fig. S5†), GOGIC-35-4h had a weaker peak at ∼1722 cm−1 which suggested a lower concentration of carbonyl groups, and this is also in agreement with the XPS results.
C/C–C in aromatic rings (284.6 eV), C–O (286.1 eV), CO (287.5 eV), COOH (289.0 eV) and π–π* satellite (290.6 eV),53 and the fractions of these components in each sample are summarized in Tables S2 and S3.† Among the GOGIC samples (Fig. 5a, c, and e and Table S2†), the highest fraction of CC/C–C was found in GOGIC-35-4h (56.6%) and the lowest was in GOGIC-45-4h (45.1%), which indicated that GOGIC-35-4h retained the most intact sp2 graphitic carbon while GOGIC-45-4h was the most oxygen-functionalized. GOGIC-25-8h had the least amount of CO and COOH (7.33%) compared to GOGIC-35-4h (7.62%) and GOGIC-45-4h (9.53%). Due to the fact that carbonyl and carboxyl groups preferentially form at the edge of GO flakes or vacancy defects,31,53,54 GOGIC-25-8h was the least defective among all fully oxidized GOGIC samples, consistent with results from the Raman spectra (Fig. 4a) and the previous reports for GO produced at room temperature.32 Hence, room-temperature oxidation can more effectively maintain the structural integrity of GO. Comparing the ATR-FTIR spectra of GOGIC (Fig. S5†), GOGIC-35-4h had a weaker peak at ∼1722 cm−1 which suggested a lower concentration of carbonyl groups, and this is also in agreement with the XPS results.
 | ||
| Fig. 5 XPS C 1s spectra for the fully oxidized GOGIC samples (a, c and e), and the thermally reduced GOGIC samples which were annealed at 150 °C for 5 h (b, d and f). | ||
To investigate the changes in the functionalities after thermal reduction, the three reduced GOGIC samples, annealed at 150 °C for 5 h, were examined by XPS (Fig. 5b, d and f). As shown in Table S3,† rGOGIC-25-8h had the largest increase in the content of sp2 carbon with thermal treatment (from 48.18% to 72.56%). This is indicative of its considerably easier deoxygenation and restoration of sp2 domains by the 150 °C thermal treatment, consistent with the isothermal TGA result (Fig. 4d). Comparing the sheet resistances of the ultrathin rGOGIC films (all annealed at 150 °C for 5 h) measured using the four-point probe, rGOGIC-25-8h (0.81 ± 0.34 MΩ □−1, mean ± standard deviation) was more conductive than rGOGIC-35-4h (1.13 ± 0.14 MΩ □−1) and rGOGIC-45-4h (8.48 ± 0.73 MΩ □−1), which is related to the higher fraction of graphitic carbon in rGOGIC-25-8h. The π–π* satellite peak became more pronounced after thermal reduction of all GOGIC samples, due to the formation of π conjugation in graphene.55
Application of GOGIC and mild annealing condition for LIBs
Because of its facile thermal recovery of conductivity, we employed the GOGIC as a 2D binder and conductive (after thermal annealing) additive in LiFePO4 (LFP) cathodes for LIBs. Carbon black was used as a control conductive additive. Under the experimental conditions, 50% of the carbon black was replaced with either GOGIC-25-8h or GOGIC-45-4h. As mentioned before, the residual weights of GOGIC-25-8h and GOGIC-45-4h stabilized after 5 h of thermal treatment at 150 °C, as shown in Fig. 4d. As such, the blended cathode materials were annealed at 150 °C in air for 5 h prior to the assembly of LIB coin cells. SEM images (Fig. S6†) show that the LFP particles are homogeneously wrapped by GO sheets, which facilitates the formation of a conducting network after mild thermal annealing. As shown in Fig. 6a, cyclic voltammetry (CV) curves of the control and the two experimental cathodes display a pair of redox peaks during the anodic/cathodic scan, associated with the reversible Fe2+/Fe3+ redox reaction in LFP cathodes. LFP–carbon black had greater separation between the two redox peaks than rGO modified LFP, indicating that rGO assisted in reducing polarization and improving the reversibility of LFP cathodes. The charge/discharge profiles in Fig. 6b exhibit a voltage plateau at ∼3.42 V vs. Li+/Li for all LIB samples, also correlated with the redox reaction in LFP. Apparently, LFP-rGOGIC-25-8h can achieve the highest discharge capacity up to 170.8 mA h g−1 at 0.1 C rate. This value is similar to the theoretical specific capacity of LFP (170 mA h g−1) which is likely contributed by the reversible redox reaction between Li+ of the electrolyte and rGO.39 Besides, the wider gap between discharge and charge plateaus in LFP–carbon black (inset in Fig. 6b) indicated its higher polarization than LFP-rGOGIC-25-8h or LFP-rGOGIC-45-4h, which was in good agreement with the CV result. According to Fig. 6c, all LIBs show good reversibility in discharge capacity as the current rate returned to 5 C and 10 C. It also clearly shows that the addition of GO can enhance the specific capacity at different discharge rates (except the highest rate 20 C for the LIB with rGOGIC-45-4h) relative to the LIB without GO additives (carbon black only), and improve the cycle life due to less decay in discharge capacity of LIBs with GO after 55 cycles at 2 C rate (Table S4†). rGOGIC-25-8h modified LFP consistently exhibited better rate capability than LFP-rGOGIC-45-4h at all discharge rates, particularly at high rates (10 and 20 C). This is attributed to the better conductivity of rGOGIC-25-8h. As demonstrated by XPS, rGOGIC-25-8h had more sp2 carbon which can provide a more conductive pathway for electron transport to the rGO modified LFP particles, thereby facilitating the Li+ insertion and extraction process.56 Furthermore, LIBs with rGOGIC-25-8h had comparable or even better battery performance relative to those in previous studies which adopted rGO modified LFP (Table S4†). It is noteworthy that the LFP particles employed in this work do not have any carbon coating and the entire LFP cathode fabrication process does not require any high temperature treatment (typically at 700 °C under an inert atmosphere).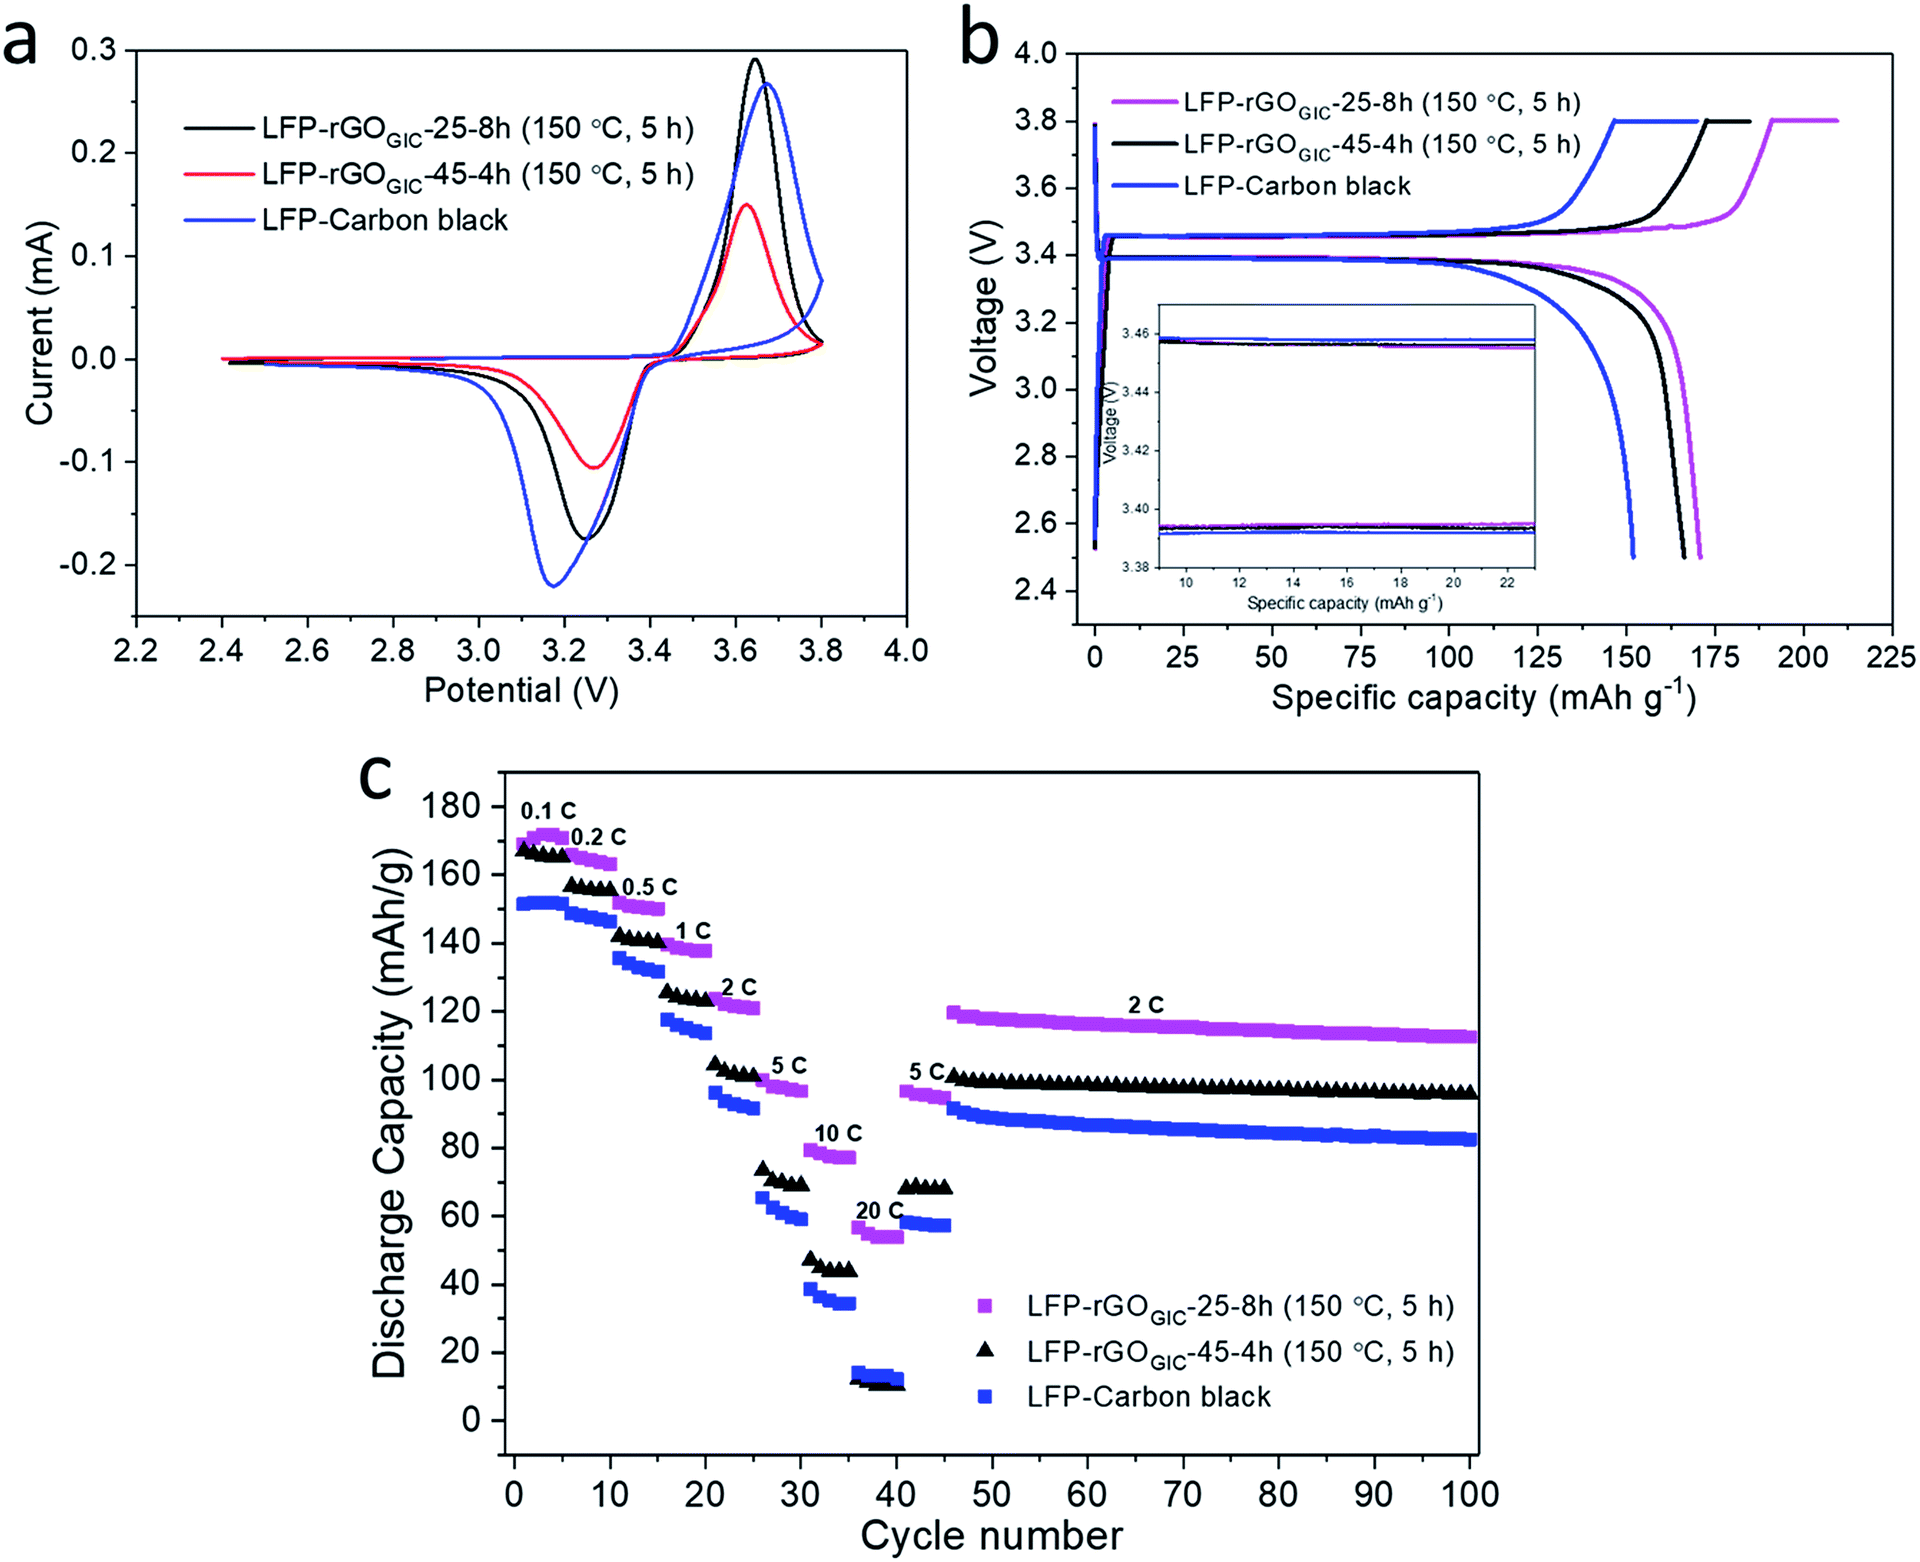 | ||
| Fig. 6 Electrochemical performances of rGOGIC-25-8h and rGOGIC-45-4h modified LFP cathodes in LIBs. The LIB cathode with only carbon black as the conductive additive served as a control. (a) Cyclic voltammetry curves of GO modified LIBs and the control at a scan rate of 0.1 mV s−1. (b) The voltage profiles for the second charge/discharge cycle at 0.1 C. Inset is a magnification of the 9–23 mA h g−1 region. (c) Performance test of LIBs showing the discharge rate capacity at different rates and the cycling stability at 2 C (1 C = 170 mA g−1). | ||
Conclusions
In conclusion, we have presented a simple modified Hummers method to prepare well-oxidized but less defective GO using expandable graphite as the starting material. Compared to that of natural graphite with a similar flake size, the oxidation of expandable graphite was easier and, more importantly, can be carried out at room temperature. The GO synthesized at room temperature has less carbonyl and carboxylic acid groups and most of its thermally labile oxygen groups (C–O) could be removed, with restoration of conductive sp2 carbon, at a mild annealing temperature of 150 °C. Finally, we directly employed the GO in our LIB cathode formulation, which contributed as a 2D binder, followed by the mild annealing process to afford a superior graphene-wrapped LFP cathode with improved capacity as well as rate performance. The mild but effective thermal reductive deoxygenation of this type of GO opens up the possibility of a more facile, energy saving and greener approach to preparing graphene materials for a variety of electroconductive applications.Conflicts of interest
There are no conflicts to declare.Acknowledgements
This work was financially supported by the Australian Research Council (LP160101521 and DP170104157).Notes and references
- S. Wu, R. Xu, M. Lu, R. Ge, J. Iocozzia, C. Han, B. Jiang and Z. Lin, Adv. Energy Mater., 2015, 5, 1500400 CrossRef.
- Y. Jia, L. Zhang, A. Du, G. Gao, J. Chen, X. Yan, C. L. Brown and X. Yao, Adv. Mater., 2016, 28, 9532–9538 CrossRef CAS PubMed.
- G. Shi, Z. Zhao, J.-H. Pai, I. Lee, L. Zhang, C. Stevenson, K. Ishara, R. Zhang, H. Zhu and J. Ma, Adv. Funct. Mater., 2016, 26, 7614–7625 CrossRef CAS.
- Y. L. Zhong, Z. Tian, G. P. Simon and D. Li, Mater. Today, 2015, 18, 73–78 CrossRef CAS.
- D. R. Dreyer, S. Park, C. W. Bielawski and R. S. Ruoff, Chem. Soc. Rev., 2010, 39, 228–240 RSC.
- Y. Zhu, S. Murali, W. Cai, X. Li, J. W. Suk, J. R. Potts and R. S. Ruoff, Adv. Mater., 2010, 22, 3906–3924 CrossRef CAS PubMed.
- V. C. Tung, M. J. Allen, Y. Yang and R. B. Kaner, Nat. Nanotechnol., 2008, 4, 25 CrossRef PubMed.
- E. M. Milner, N. T. Skipper, C. A. Howard, M. S. P. Shaffer, D. J. Buckley, K. A. Rahnejat, P. L. Cullen, R. K. Heenan, P. Lindner and R. Schweins, J. Am. Chem. Soc., 2012, 134, 8302–8305 CrossRef CAS PubMed.
- D. Li, M. B. Muller, S. Gilje, R. B. Kaner and G. G. Wallace, Nat. Nanotechnol., 2008, 3, 101–105 CrossRef CAS PubMed.
- J. Chen, Y. Li, L. Huang, C. Li and G. Shi, Carbon, 2015, 81, 826–834 CrossRef CAS.
- N. Behabtu, J. R. Lomeda, M. J. Green, A. L. Higginbotham, A. Sinitskii, D. V. Kosynkin, D. Tsentalovich, A. N. G. Parra-Vasquez, J. Schmidt, E. Kesselman, Y. Cohen, Y. Talmon, J. M. Tour and M. Pasquali, Nat. Nanotechnol., 2010, 5, 406–411 CrossRef CAS PubMed.
- S. Stankovich, R. D. Piner, X. Chen, N. Wu, S. T. Nguyen and R. S. Ruoff, J. Mater. Chem., 2006, 16, 155–158 RSC.
- I. Jung, M. Pelton, R. Piner, D. A. Dikin, S. Stankovich, S. Watcharotone, M. Hausner and R. S. Ruoff, Nano Lett., 2007, 7, 3569–3575 CrossRef CAS.
- W. S. Hummers and R. E. Offeman, J. Am. Chem. Soc., 1958, 80, 1339 CrossRef CAS.
- D. C. Marcano, D. V. Kosynkin, J. M. Berlin, A. Sinitskii, Z. Sun, A. Slesarev, L. B. Alemany, W. Lu and J. M. Tour, ACS Nano, 2010, 4, 4806–4814 CrossRef CAS PubMed.
- S. Eigler, C. Dotzer and A. Hirsch, Carbon, 2012, 50, 3666–3673 CrossRef CAS.
- L. R. Radovic, J. Am. Chem. Soc., 2009, 131, 17166–17175 CrossRef CAS.
- S. Pan and I. A. Aksay, ACS Nano, 2011, 5, 4073–4083 CrossRef CAS PubMed.
- M. J. McAllister, J.-L. Li, D. H. Adamson, H. C. Schniepp, A. A. Abdala, J. Liu, M. Herrera-Alonso, D. L. Milius, R. Car, R. K. Prud'homme and I. A. Aksay, Chem. Mater., 2007, 19, 4396–4404 CrossRef CAS.
- A. M. Dimiev and J. M. Tour, ACS Nano, 2014, 8, 3060–3068 CrossRef CAS PubMed.
- L. Dong, J. Yang, M. Chhowalla and K. P. Loh, Chem. Soc. Rev., 2017, 46, 7306–7316 RSC.
- N. I. Kovtyukhova, P. J. Ollivier, B. R. Martin, T. E. Mallouk, S. A. Chizhik, E. V. Buzaneva and A. D. Gorchinskiy, Chem. Mater., 1999, 11, 771–778 CrossRef CAS.
- Y. Xu, H. Bai, G. Lu, C. Li and G. Shi, J. Am. Chem. Soc., 2008, 130, 5856–5857 CrossRef CAS PubMed.
- Z. Luo, Y. Lu, L. A. Somers and A. T. C. Johnson, J. Am. Chem. Soc., 2009, 131, 898–899 CrossRef CAS.
- S. H. Aboutalebi, M. M. Gudarzi, Q. B. Zheng and J.-K. Kim, Adv. Funct. Mater., 2011, 21, 2978–2988 CrossRef CAS.
- Q. Zheng, W. H. Ip, X. Lin, N. Yousefi, K. K. Yeung, Z. Li and J.-K. Kim, ACS Nano, 2011, 5, 6039–6051 CrossRef CAS PubMed.
- J. Jia, C.-M. Kan, X. Lin, X. Shen and J.-K. Kim, Carbon, 2014, 77, 244–254 CrossRef CAS.
- L. Dong, Z. Chen, S. Lin, K. Wang, C. Ma and H. Lu, Chem. Mater., 2017, 29, 564–572 CrossRef CAS.
- S. Eigler, M. Enzelberger-Heim, S. Grimm, P. Hofmann, W. Kroener, A. Geworski, C. Dotzer, M. Röckert, J. Xiao, C. Papp, O. Lytken, H.-P. Steinrück, P. Müller and A. Hirsch, Adv. Mater., 2013, 25, 3583–3587 CrossRef CAS PubMed.
- B. Butz, C. Dolle, C. E. Halbig, E. Spiecker and S. Eigler, Angew. Chem., Int. Ed., 2016, 55, 15771–15774 CrossRef CAS PubMed.
- J. Chen, Y. Zhang, M. Zhang, B. Yao, Y. Li, L. Huang, C. Li and G. Shi, Chem. Sci., 2016, 7, 1874–1881 RSC.
- H. Chen, W. Du, J. Liu, L. Qu and C. Li, Chem. Sci., 2019, 10, 1244–1253 RSC.
- X. Zhu, Y. Zhu, S. Murali, M. D. Stoller and R. S. Ruoff, ACS Nano, 2011, 5, 3333–3338 CrossRef CAS PubMed.
- X. Yang, L. Qiu, C. Cheng, Y. Wu, Z.-F. Ma and D. Li, Angew. Chem., Int. Ed., 2011, 50, 7325–7328 CrossRef CAS PubMed.
- I. K. Moon, J. Lee, R. S. Ruoff and H. Lee, Nat. Commun., 2010, 1, 73 Search PubMed.
- X. Zhu, J. Hu, W. Wu, W. Zeng, H. Dai, Y. Du, Z. Liu, L. Li, H. Ji and Y. Zhu, J. Mater. Chem. A, 2014, 2, 7812–7818 RSC.
- Y. Zhu, M. D. Stoller, W. Cai, A. Velamakanni, R. D. Piner, D. Chen and R. S. Ruoff, ACS Nano, 2010, 4, 1227–1233 CrossRef CAS PubMed.
- Y. Huang, H. Liu, Y.-C. Lu, Y. Hou and Q. Li, J. Power Sources, 2015, 284, 236–244 CrossRef CAS.
- B. Lung-Hao Hu, F.-Y. Wu, C.-T. Lin, A. N. Khlobystov and L.-J. Li, Nat. Commun., 2013, 4, 1687 CrossRef PubMed.
- J. Chen, B. Yao, C. Li and G. Shi, Carbon, 2013, 64, 225–229 CrossRef CAS.
- J. Shen, Y. Hu, M. Shi, X. Lu, C. Qin, C. Li and M. Ye, Chem. Mater., 2009, 21, 3514–3520 CrossRef CAS.
- S. Park, J. An, J. R. Potts, A. Velamakanni, S. Murali and R. S. Ruoff, Carbon, 2011, 49, 3019–3023 CrossRef CAS.
- P. Yu, S. E. Lowe, G. P. Simon and Y. L. Zhong, Curr. Opin. Colloid Interface Sci., 2015, 20, 329–338 CrossRef CAS.
- N. E. Sorokina, M. A. Khaskov, V. V. Avdeev and I. V. Nikol'skaya, Russ. J. Gen. Chem., 2005, 75, 162–168 CrossRef CAS.
- M. Salvatore, G. Carotenuto, S. De Nicola, C. Camerlingo, V. Ambrogi and C. Carfagna, Nanoscale Res. Lett., 2017, 12, 167 CrossRef.
- G. Shi, A. Michelmore, J. Jin, L. H. Li, Y. Chen, L. Wang, H. Yu, G. Wallace, S. Gambhir, S. Zhu, P. Hojati-Talemi and J. Ma, J. Mater. Chem. A, 2014, 2, 20382–20392 RSC.
- M. Cai, D. Thorpe, D. H. Adamson and H. C. Schniepp, J. Mater. Chem., 2012, 22, 24992–25002 RSC.
- Y. Wen, M. Wu, M. Zhang, C. Li and G. Shi, Adv. Mater., 2017, 29, 1702831 CrossRef PubMed.
- A. C. Ferrari, J. C. Meyer, V. Scardaci, C. Casiraghi, M. Lazzeri, F. Mauri, S. Piscanec, D. Jiang, K. S. Novoselov, S. Roth and A. K. Geim, Phys. Rev. Lett., 2006, 97, 187401 CrossRef CAS PubMed.
- A. C. Ferrari and J. Robertson, Phys. Rev. B: Condens. Matter Mater. Phys., 2000, 61, 14095–14107 CrossRef CAS.
- S. Eigler, C. Dotzer, A. Hirsch, M. Enzelberger and P. Müller, Chem. Mater., 2012, 24, 1276–1282 CrossRef CAS.
- S. E. Lowe, G. Shi, Y. Zhang, J. Qin, S. Wang, A. Uijtendaal, J. Sun, L. Jiang, S. Jiang, D. Qi, M. Al-Mamun, P. Liu, Y. L. Zhong and H. Zhao, ACS Appl. Nano Mater., 2019, 2, 867–878 CrossRef CAS.
- C. Mattevi, G. Eda, S. Agnoli, S. Miller, K. A. Mkhoyan, O. Celik, D. Mastrogiovanni, G. Granozzi, E. Garfunkel and M. Chhowalla, Adv. Funct. Mater., 2009, 19, 2577–2583 CrossRef CAS.
- A. Dimiev, D. V. Kosynkin, L. B. Alemany, P. Chaguine and J. M. Tour, J. Am. Chem. Soc., 2012, 134, 2815–2822 CrossRef CAS PubMed.
- C.-C. Teng, C.-C. M. Ma, C.-H. Lu, S.-Y. Yang, S.-H. Lee, M.-C. Hsiao, M.-Y. Yen, K.-C. Chiou and T.-M. Lee, Carbon, 2011, 49, 5107–5116 CrossRef CAS.
- C. M. Julien, K. Zaghib, A. Mauger, M. Massot, A. Ait-Salah, M. Selmane and F. Gendron, J. Appl. Phys., 2006, 100, 063511 CrossRef.
Footnotes |
| † Electronic supplementary information (ESI) available: Tables S1–S4 and Fig. S1–S6. See DOI: 10.1039/c9ta02244a |
| ‡ These authors contributed equally to this work. |
| This journal is © The Royal Society of Chemistry 2019 |