
 Open Access Article
 This Open Access Article is licensed under a Creative Commons Attribution-Non Commercial 3.0 Unported Licence
Semiconductor TiO2 thin film as an electrolyte for fuel cells†
Wenjing
Dong
 a,
Yuzhu
Tong
a,
Bin
Zhu
*abc,
Haibo
Xiao
a,
Lili
Wei
a,
Chao
Huang
a,
Baoyuan
Wang
a,
Xunying
Wang
a,
Jung-Sik
Kim
c and
Hao
Wang
*a
a,
Yuzhu
Tong
a,
Bin
Zhu
*abc,
Haibo
Xiao
a,
Lili
Wei
a,
Chao
Huang
a,
Baoyuan
Wang
a,
Xunying
Wang
a,
Jung-Sik
Kim
c and
Hao
Wang
*a
aKey Laboratory of Ferro, Piezoelectric Materials and Devices of Hubei Province, Faculty of Physics and Electronic Science, Hubei University, Wuhan, Hubei 430062, P. R. China. E-mail: zhubin@hubu.edu.cn; binzhu@kth.se; wangh@hubu.edu.cn
bFaculty of Materials Science and Chemistry, China University of Geosciences, 388 Lumo Road, Wuhan 430074, China
cDepartment of Aero & Auto Engineering, Loughborough University, Ashby Road, Loughborough, LE11 3TU, UK
First published on 28th June 2019
Abstract
Electrolyte layer, made up of an ionic conductor with ignorable electronic conductivity, plays vital roles in transporting ions as well as blocking electron passage in electrochemical devices like a solid oxide fuel cell (SOFC). The electronic conductivity of the electrolyte has been always blamed for bringing in the short-circuiting problem. In this study, however, we demonstrate that the dominant issue is not the electronic conductivity of electrolytes but the energy band diagram of the device. Using a semiconductor TiO2 thin film as an electrolyte, we present a novel design of fuel cell devices from the perspective of the energy band structure and alignment. A TiO2 thin film was fabricated by a mass-productive spin coating method. An OCV of 1.1 V and maximum power output of 364 mW cm−2 at 550 °C were achieved, which proves that TiO2 plays the role of an electrolyte with sufficient ionic transportation while no electronic short-circuiting problem occurs. The online intercalation of Li into TiO2 enables the creation of more oxygen vacancies. Additionally, proton incorporation and conducting mechanisms in TiO2 have been verified and discussed. This work provides a new method for suppressing the electronic conductivity of electrolytes as well as developing functional electrolytes from a well-known semiconductor for advanced low-temperature SOFCs.
1. Introduction
Lowering the operating temperature of a solid oxide fuel cell (SOFC) is an inevitable trend towards its commercialization through worldwide research, which results in the necessity of developing low temperature oxygen ion or proton conductive materials. The steady progress of the ionic conductor is enormously contributed by doping technology. By properly selecting the doping elements, doping can significantly enhance the stability of materials. It is well known that doping Y into ZrO2 stabilizes the structure of ZrO2 (YSZ),1 and doping Er into Bi2O3 helps to stabilize the δ-phase.2,3 Another purpose of doping is to improve the ionic conductivity by increasing the oxygen vacancy concentration in the material. Doped CeO2 and Sr- and Mg-doped LaGaO3 (LSGM) are reported to possess high ionic conductivity at low temperatures.4 However, they are often limited by their instability and incapability of suppressing electronic leakage when exposed to the reduced atmosphere.Traditionally, the electronic conductivity of the electrolyte is considered catastrophic because the short-circuiting problem in SOFC is thought to be originated from it.5,6 However, interestingly, for some researchers, the electronic conductivity of electrolytes doesn't seem to be an obstacle in their creative design. Zhu et al. found that no short-circuiting occurred in the cells that use semiconductor-ionic conductor composites as electrolytes.7–9 Besides, some highly electronic conductive materials have been reported to function as electrolytes to realize fuel cell reactions. Zhou et al. reported that a strongly correlated perovskite fuel cell using SmNiO3 with high initial electronic conductivity as electrolyte layer obtained 225 mW cm−2 at 500 °C in a single layer configuration Pt/SmNiO3/Pt.10 Tao et al. also achieved electrolyte function from an electronic conductor.11,12 These experimental data suggest that using electronic conductors as an electrolyte is obviously acceptable, but how to suppress their electronic leakage in a fuel cell environment is a critical issue.
Since short-circuiting problems in SOFC results from the electron transportation in an electrolyte, manipulating electron transportation behavior should be the top priority in designing SOFC. Theoretically, electron transportation in a single material is dominated by the conductivity of the material. However, in a device fabricated from different kinds of materials, the conductivity of the materials will no longer be the only dominator in electron transportation. Taking a typical semiconductor p–n junction as an example, though the p- and n-type semiconductors have non-negligible electronic conductivity, the p–n junction is cut off in the reverse condition, namely, the reverse resistance is enormously larger compared with the forward resistance. So, in SOFC, a three-layer device, we cannot simply blame its short-circuiting problem on the electronic conductivity of the electrolyte. As the transportation behavior of electrons is closely related to the energy band structures of materials in the device from the perspective of solid state physics, short-circuiting problem might be solved from energy band engineering, which has already been utilized in various fields to manipulate charge carrier transportation. In a semiconductor device like solar cells, the energy band diagram is carefully designed to facilitate the transportation of electrons and holes.13,14 In electrochemical devices for applications such as photoelectrochemical (PEC) water splitting, the energy levels of the photoanode and counter electrode are also required to obey the critical rules.15 Apart from electronic devices, the role of energy band diagram has also gradually drawn researchers' awareness in ionic devices. For example, in Li batteries, the electrochemical potential of the anode and cathode should match with the energy level of the electrolyte in order to avoid electrolyte reduction on the anode or oxidization on the cathode.16
In this study, we applied a semiconductor thin film as the electrolyte layer of SOFC. Since the electron transportation in a semiconductor is highly affected by the energy band structure, we can suppress the electronic conduction by properly selecting the band structure of the anode and cathode material. In order to lower the operating temperature of SOFC, effectively reducing the thickness of the electrolyte is an efficient way.17,18 Among all thin film technologies, mass-productivity should be taken into consideration in seek of commercialization. Fabricated by a spin-coating method, a typical semiconductor TiO2 thin film is used as an electrolyte. We designed the band structure of SOFC in comparison with that of a PEC water splitting device in order to avoid electron short-circuiting problems. Spontaneous ion doping in TiO2 is also demonstrated to be helpful in increasing its ionic conductivity. The fuel cell can deliver good current and power outputs, which are valuable for various studies. We believe that this study will be beneficial in extending semiconductors' applications in advanced SOFCs and solid state ionic devices.
2. Experimental
2.1 Material preparation and fuel cell fabrication
Firstly, commercial LiNi0.8Co0.15Al0.05O2 (NCAL) powders added by 3 wt% polyvinylidene fluoride (PVDF) as a binder were pressed into a ϕ 13 mm pellet with a thickness of 0.57 mm under the pressure of 200–300 MPa. NCAL was purchased from TianjingBamo Company, and PVDF from Sinopharm Chemical Reagent Co., Ltd. After annealing at 500 °C for 2 h to remove PVDF, the pellet was then used as the device anode substrate. TiO2 film was fabricated on the substrate by the decomposition of titanium diisopropoxidebis(acetylacetonate) according to our previous report.13 It is a widely applied method in solar cells. Specifically, a solution of titanium diisopropoxidebis(acetylacetonate) (in 75% isopropanol, HeptaChroma) (TDB) diluted in ethanol (1![[thin space (1/6-em)]](https://www.rsc.org/images/entities/char_2009.gif) :3, volume ratio) was spin-coated on the anode pellet with a speed of 1500 rads−1 for 30 s. The spin coating process was repeated 10–20 times. Then, the sample was annealed at 500 °C for 30 min to form a TiO2 thin film electrolyte layer. This sample is named as “TiO2 on NCAL” (TON) in the following text. The cathode layer was made with Ni foam coated with NCAL (Ni-NCAL). To be specific, NCAL powder was uniformly dispersed in terpineol to form a slurry, which was then brush-coated on Ni-foam, followed by desiccation at 120 °C. The Ni-NCAL cathode was then pressed into a thin pellet, and assembled with the above TON sample to form a fuel cell device with a configuration of NCAL/ TiO2/ Ni-NCAL. The effective area of the fuel cell device was 0.64 cm2.
:3, volume ratio) was spin-coated on the anode pellet with a speed of 1500 rads−1 for 30 s. The spin coating process was repeated 10–20 times. Then, the sample was annealed at 500 °C for 30 min to form a TiO2 thin film electrolyte layer. This sample is named as “TiO2 on NCAL” (TON) in the following text. The cathode layer was made with Ni foam coated with NCAL (Ni-NCAL). To be specific, NCAL powder was uniformly dispersed in terpineol to form a slurry, which was then brush-coated on Ni-foam, followed by desiccation at 120 °C. The Ni-NCAL cathode was then pressed into a thin pellet, and assembled with the above TON sample to form a fuel cell device with a configuration of NCAL/ TiO2/ Ni-NCAL. The effective area of the fuel cell device was 0.64 cm2.
2.2 Material characterization
The crystal structures of the as-prepared solid samples were detected by X-ray diffraction (XRD) using Bruker D8 advanced X-ray diffractometer (Germany, Bruker Corporation) with Cu Ka radiation (λ = 1.54060 Å) as the source. The morphologies and microstructures of the samples were analyzed by JSM7100F field emission scanning electron microscope (FESEM) and FEI Tecnai G2 F30 transmission electron microscope (TEM). X-ray photoelectron spectroscopy (XPS) and ultraviolet photoelectron spectroscopy (UPS) were carried out on an ESCALAB 250Xi photoelectron spectrometer (Thermo Fisher Scientific, UK). The optical energy bandgap of the materials was estimated by UV-vis-NIR absorption test carried out on UV3600. NCAL was pressed into a pellet for XPS and UPS tests and a TiO2 thin film was fabricated on an NCAL substrate as well as on Si and glass substrates for relative tests.2.3 Electrical and electrochemical tests of fuel cell
The cell performance, characterized by I–V (current density–voltage) and I–P (current density–power density) curves, was measured by the programmable electronic load using a computerized instrument (IT8511, ITECH) at 550 °C. During the test, pure hydrogen and air were used as fuel and oxidant gas, respectively. The gas flow rates were kept in the range of 120–150 mL min−1 for H2 and ∼150 mL min−1 for air. The electrochemical impedance spectra (EIS) measurements were tested in the same gas atmosphere as above using an electrochemical work station (Gamry Reference 3000, USA) under OCV mode. The measured frequency range was 1 MHz–0.1 Hz, while the amplitude was 10 mV.3. Results and discussion
3.1 Fuel cell design from energy band structure
According to the energy band theory, in order to adjust the carrier transportation behavior in a device, materials with different energy band structures should be carefully designed. For example, in a PEC water splitting device, the Fermi level of the metal counter electrode must be higher than the redox potential of H+/H2 while the valence band (VB) level of a semiconductor photoanode is required to be lower than the redox potential of H2O/O2 (Fig. 1a).15 As we know, the fuel cell reaction can be regarded as a reverse reaction of water splitting. In a typical SOFC, electrons are generated at the anode/electrolyte interface and are then supposed to flow through the anode to the outer circuit when the circuit is connected. In the meantime, no electrons are expected to flow through the electrolyte, otherwise, short-circuiting occurs (Fig. 1b). So the electrons in the anode should be blocked by the electrolyte from the perspective of energy band theory. In a typical Ni-YSZ (Y-stabilized ZrO2) fuel cell, the redox potential of H2/H+ is about −4.5 eV relative to vacuum energy (RVE), and the work function for a typical anode material Ni is about −5.1 eV RVE, which is lower than the potential of H2/H+, and hence electrons stemmed from the oxidation of H2 can flow to the anode. In the meantime, the conduction band (CB) of YSZ electrolyte is higher than the redox potential of H2/H+;19,20 electrons cannot jump to the CB of the electrolyte, namely the electrons that are blocked by the electrolyte. However, if an electrolyte material has lower CB level, short-circuiting problem might occur (Fig. 1c). For example, the CB level of SDC, which is measured to be at around −5.65 eV (Fig. S1†), is much lower than −4.5 eV, and the short-circuiting problem was often observed in the SDC electrolyte fuel cell. However, as the electronic conductivity of SDC is rather low, short-circuiting doesn't occur at first. But when SDC is reduced by H2, its electronic conductivity would rapidly increase and electrons can flow through it.21 That is why short-circuiting problem was observed in an SDC electrolyte fuel cell after a period of operation. In short, the energy band structure of a good SOFC should obey the following rules: (1) the CB level of the electrolyte should be higher than the redox potential of H2/H+, (2) the Fermi level of the metal anode (or the CB level of semiconductor anode) should be lower than the redox potential of H2/H+, (3) the valence band (VB) level of the electrolyte should be lower than the redox potential of O2/O2−, (4) the CB level of the cathode should be higher than the redox potential of O2/O2−. | ||
| Fig. 1 Energy band diagrams of (a) PEC water splitting (Honda–Fujishima effect), (b) SOFC, and (c) SOFC with the occurrence of short circuiting. If the anode of SOFC is not a metal but a semiconductor instead, the CB level of this semiconductor should be lower than the energy level of H+/H2 as the electrons generated by H2 oxidation are expected to flow to the CB level of this semiconductor. | ||
3.2 Fuel cell fabrication and characterization
According to the above rules, using a typical n-type semiconductor TiO2, whose CB level is higher than −4.5 eV RVE, as the electrolyte, we carefully considered the energy band structure of the electrode materials. Finally, a triple (oxygen ionic, protonic, and electronic) conductive semiconductor NCAL22 was applied as both the anode and cathode. From UPS and UV-vis-NIR results, the energy band diagram of a thin film TiO2 electrolyte fuel cell with NCAL electrodes was elucidated in Fig. 2d. According to φ = 21.2 eV − (Ecutoff − Eonset),23 where Ecutoff is the cutoff energy and Eonset is the onset energy from UPS (Fig. 2b and c), the VB levels of NCAL and TiO2 are calculated to be −6.08 and −7.65 eV RVE, respectively. The CB levels are obtained as −5.18 eV for NCAL and −4.03 eV for TiO2, by subtracting Eg from VB levels, where Eg is the optical energy gap obtained from optical absorbance spectra (Fig. S2†). From the energy band diagram presented in Fig. 2d, the energy levels of the three parts match well with all rules stated above.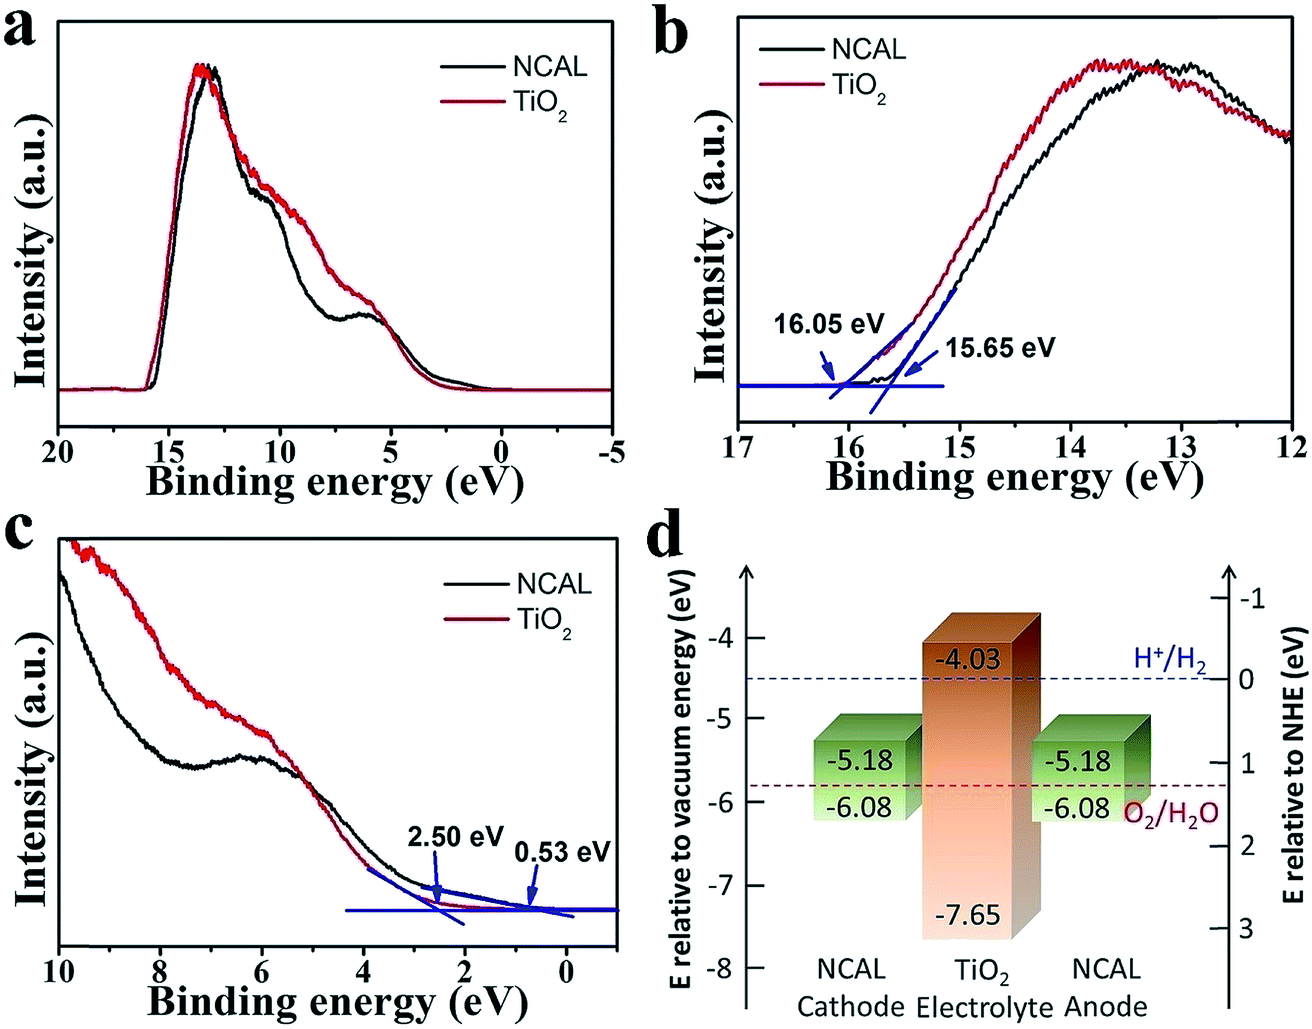 | ||
| Fig. 2 UPS spectra of NCAL and TiO2: (a) complete spectrum, (b) cutoff energy region, and (c) onset energy region. (d) Energy band diagram of fuel cell NCAL/TiO2/NCAL obtained according to UPS results and energy band gap. | ||
Fig. 3 shows the SEM morphologies of pure NCAL substrate and TiO2 thin film fabricated on NCAL. NCAL powders are spherical particles and the dry-pressed pellet was not very compact with some voids existing between the particles. Such porous structure is actually desired for the fuel cell anode to enhance the catalyst function. When spin coating TiO2 solution on the pellet, it partially infiltrated into the pores of the NCAL substrate. From Fig. 3b, we can see that a thin film was formed within a certain depth of the NCAL substrate. Raman tests further verified that the thin film on NCAL was TiO2 (Fig. S3†). The cross section of the TiO2 electrolyte fuel cell is presented in Fig. 3c. It can be observed that a compact TiO2 thin film was sandwiched between two NCAL layers, separating the anode and cathode.
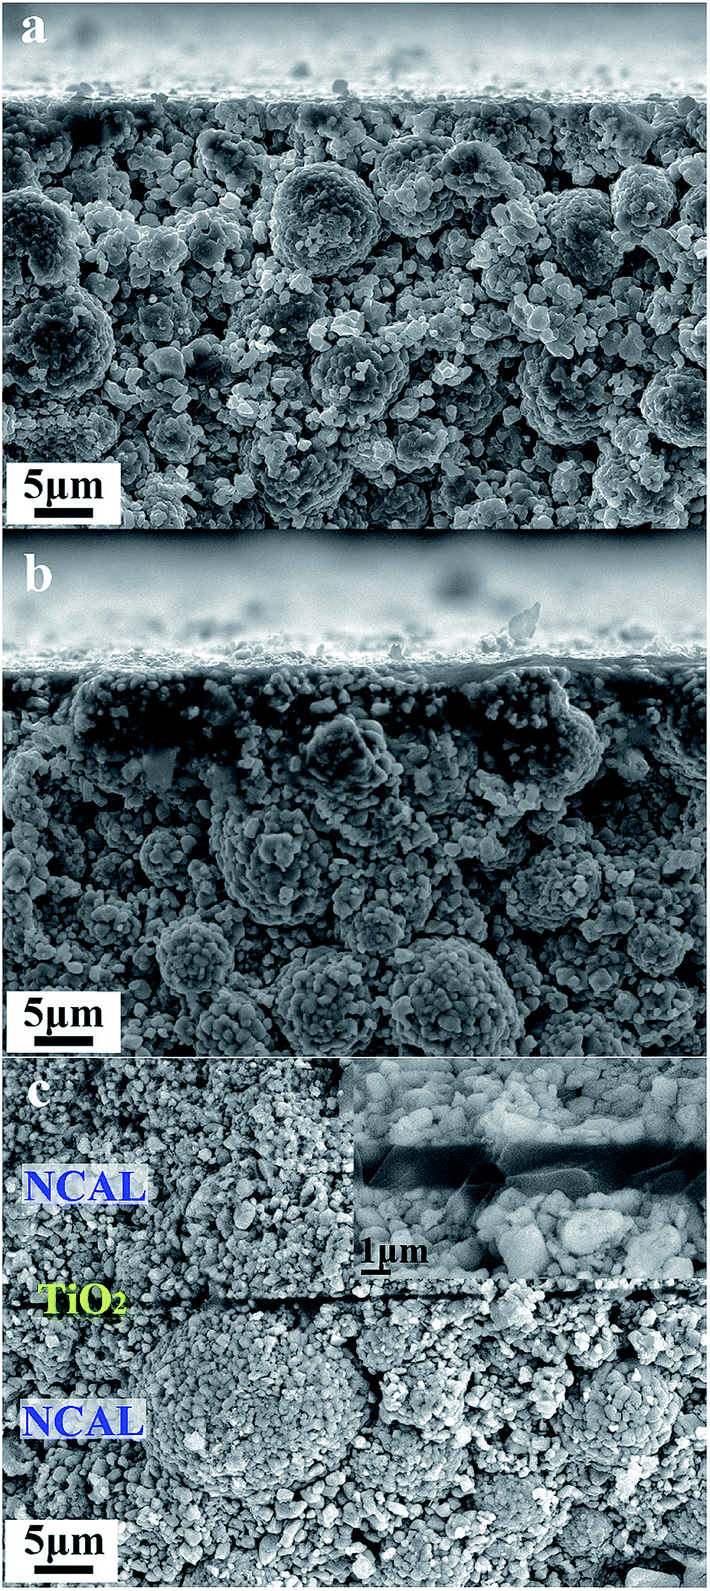 | ||
| Fig. 3 Cross sectional view; SEM images of (a) pure NCAL pellet, (b) TiO2 thin film fabricated on NCAL pellet, and (c) TiO2 electrolyte fuel cell. | ||
The typical I–V–P characteristics of the TiO2 thin film electrolyte fuel cell measured at 550 °C are shown in Fig. 4a. An OCV of 1.1 V and a maximum power density (Pmax) of 364 mW cm−2 were obtained. The OCV value provides clear evidence that the designed energy band alignment succeeded in solving the electronic short-circuiting problem in the device. By contrast, the fuel cell made without the TiO2 thin film, i.e. the assembly of the NCAL substrates and Ni-NCAL cathode in the configuration of NCAL/Ni-NCAL, showed no OCV or detectable power output. This provides further support for TiO2 acting as the electrolyte to conduct ions, resulting in OCVs and power outputs. EIS result is presented in Fig. 4b. The fitting curve is in good agreement with the measured EIS, where R0, relating to the intercept of the impedance arc on the real axis, represents the bulk resistance (or ohmic resistance) of the cell. From the capacitance calculated from R and Q, the high frequency and low frequency resistance, R1 and R2, can be assigned to the mass transfer resistance, including gas diffusion.24,25 No significant grain boundary resistance arc was observed for the TiO2 electrolyte device, suggesting good ionic conductivity of TiO2. A more detailed discussion on the EIS for the TiO2 electrolyte cell taken under different voltage conditions is presented in Fig. S4.†
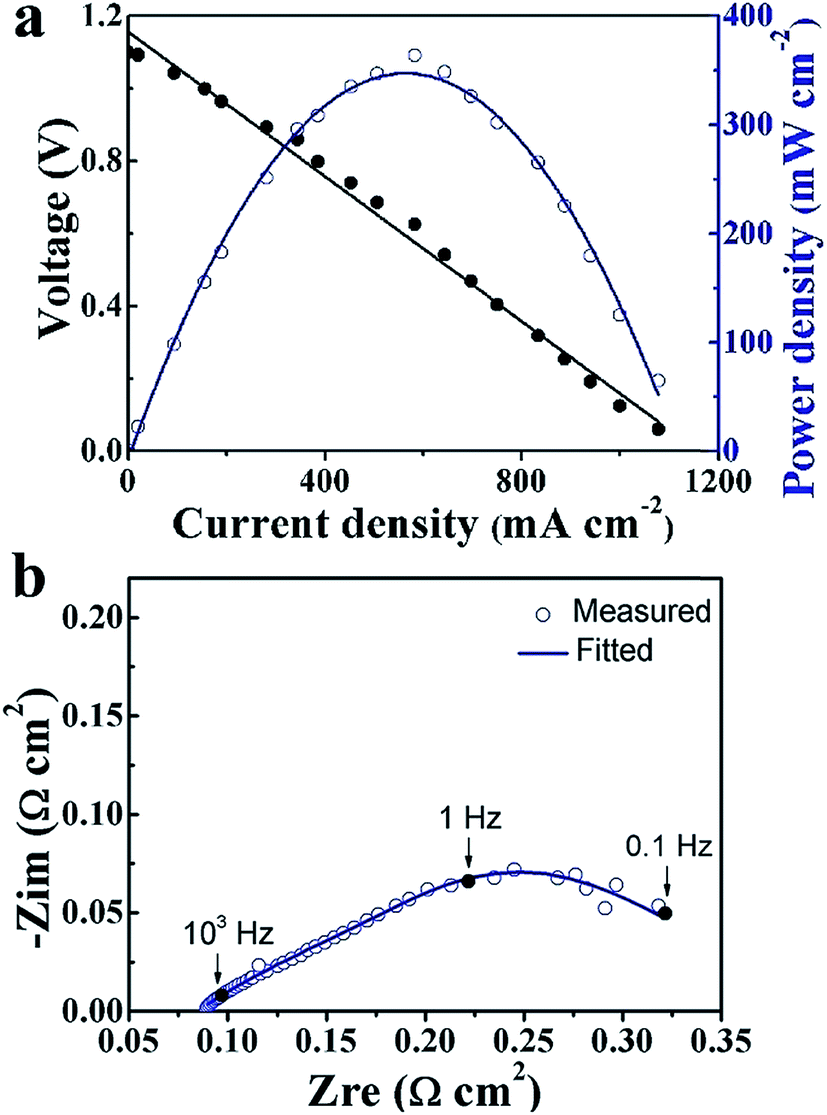 | ||
| Fig. 4 (a) I–V and I–P characteristics and (b) EIS spectra of the TiO2 thin film electrolyte fuel cell measured at 550 °C. | ||
3.3 Ionic conductive property analysis of TiO2
In a typical proton conductive perovskite oxide, protons can bond with oxygen to form ionic defects ( in Kröger–Vink notation).
 | (1) |
Then, protons diffuse in the material through the processes involving rotational diffusion of the proton defects and transfer to the neighboring oxygen ions, which is frequently termed as Grotthuss mechanism.26 In TiO2, proton incorporation and diffusion along the c-axis of TiO2 happen in a similar way, albeit with some differences in the proton incorporation process. The processes have been schematized in Fig. 5: (i) proton incorporation: theoretical calculation shows that the existence of oxygen vacancies allows electrons to move from the vacancies to the neighboring Ti and O sites in TiO2;27 thus, the electron density around the O neighboring to oxygen vacancies is high, so protons will prefer to incorporate into TiO2 by forming an OH bond with O at the shared edge of Ti3+ and Ti4+ (overall reaction 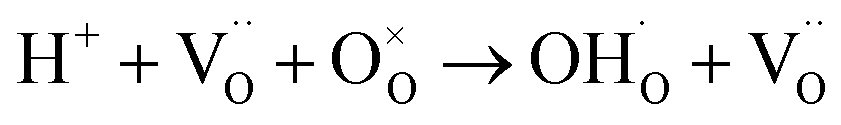 );28 (ii) rotational diffusion; (iii) transfer to neighboring oxygen, (iv) bending and (v) elongation of the Ti–O bond. According to the above processes, the proton conductivity of TiO2 is closely related to the oxygen vacancies in it.
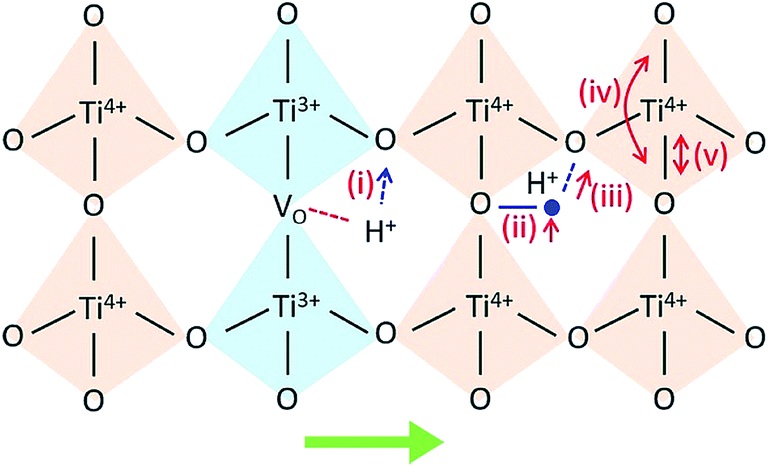 | ||
| Fig. 5 Proton incorporation and conduction mechanisms in TiO2. (i) Proton incorporation, (ii) rotational diffusion; (iii) transfer to neighboring oxygen, (iv) bending and (v) elongation of the Ti–O bond. The green arrow in the bottom points to the c-channel axis. | ||
In our case, slight Li2CO3 fragments were observed on the surfaces of NCAL, which is consistent with previous reports (Fig. 6a).29 Thus Li will possibly incorporate into TiO2 during its fabrication process (Fig. 6b).30 Li-insertion in TiO2 has already been broadly reported.31,32 As the valence state of Li+ is much lower than that of Ti4+, more oxygen vacancies would be generated when Li+ is intercalated into TiO2 according to the following reaction.
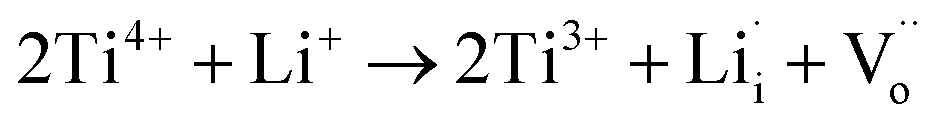 | (2) |
 | ||
| Fig. 6 (a) Schematic diagrams (not to scale) of the structure of TiO2 thin film electrolyte fuel cell, the enlarged ones are the schematic structure of NCAL and the SEM image of the surface of NCAL particle. (b) The structure of TiO2 crystal with the intercalation of Li that occupy the channels, and (c) the structure of TiO2 crystal with the intercalation of both Li and H that occupy the channels. | ||
The existence of more oxygen vacancies in TiO2 that is fabricated on NCAL than normal TiO2 (TiO2 on Si) was also proved by XPS results.
Fig. 7a shows Ti 2p XPS spectra of TiO2 on Si (TOS) and TiO2 on NCAL (TON). Due to the electronic spin–orbit coupling, the Ti 2p orbitals split into two energy levels, 2p1/2 (noted as 2p1) and 2p3/2 (noted as 2p3).33 The peaks located at 458.4 and 464.4 eV are assigned to Ti4+ 2p3 and Ti4+ 2p1, respectively. The peaks at 457.9 and 463.7 eV are attributed to the reduced state (Ti3+).34,35 The sum of Ti3+ peak area ratio of TON is much higher than that of TOS, demonstrating that the TiO2 film formed on NCAL substrate has much lower valence state comparing with TiO2 formed on Si substrate.36Fig. 7b shows the O 1s core level spectra of NCAL, TOS, and TON. It can be clearly observed that the O 1s peak of TON is much different from that of the NCAL and TiO2 on Si, indicating its different bonding environments of O species. Compared with TOS, the binding energy (BE) of O 1s of TON was negatively shifted. The Ti–O–Ti is observed at 529.5 eV for TON and this reduced value compared to TOS is attributed to the existence of enormous amount of oxygen vacancies.37,38 The higher BE peaks are associated with the –OH species.39,40According to previous reports, the ionic conductivity of oxides is closely related to the O 1s BE.41–43 Barr42 divided oxides into three different types based on their O 1s BE, and oxides with BE in the range of 528.0–529.5 eV were regarded as very ionic oxides. From Fig. 7b, it can be observed that the low energy O 1s peak of TON and NCAL are all lower than 529.5 eV, indicating that both of them can be assigned to the “very ionic oxide” type. Comparing with NCAL whose ionic conductivity has already been proven,44 the area ratio of the low energy peak to the high energy peak of TON is much larger, suggesting that the TiO2 film also has good ionic conductivity.
 | ||
| Fig. 7 (a) Ti 2p XPS spectra of TiO2 on Si and TiO2 on NCAL annealed at 550 °C for 30 min. (b) O 1s core level XPS spectra of NCAL, TiO2 on Si, and TiO2 on NCAL. TEM images of (c and e) NCAL and (d and f) core shell structure of TiO2 fabricated on NCAL particles. | ||
Li doping in TiO2 has also been proved from TEM test. For pure NCAL particles, only the (104) face (d = 0.20 nm) was detected. However, for TiO2 coating on NCAL particle, besides the observation of the (101) face of anatase TiO2, a lattice distance of 0.20 nm, which denotes the (200) face of LiTiO2,30 was also found. In the fuel cell environment, protons generated by the anode reaction might possibly exchange with Li+ in TiO2: Li, forming TiO2: Li/H (Fig. 6c) as reported in other lithium titanate. It is reported for Li2Ti3O7 that when Li+ is replaced by H+, H2Ti3O7 will form, which has been proved to be a proton conductor.45 Besides, during the fuel cell reaction process at 550 °C studied by us, TiO2 might be in a rutile phase as the temperature of anatase to rutile transformation is between 500–600 °C.46 The intercalation of hydrogen in the c channels of rutile TiO2 and its motion in TiO2 have also been reported.28,47 Reports have revealed that the activation energy for H migration along the c-channel of rutile TiO2 is 0.5–0.6 eV for diffusion,47,48 which is comparative to the activation energy of proton conduction in BaCe0.8−xZrxY0.2O3−δ.49 In addition, using typical proton conductor, BZCY ((BaZr0.1Ce0.7Y0.2O3)), as H+ filtering layer to allow only protons to pass, the proton conduction in TiO2 electrolyte has been verified (Fig. S5 and 6†).
4. Conclusions
TiO2 thin film has been successfully fabricated by a mass-productive spin coating method for novel fuel cell device applications. The TiO2 electrolyte fuel cell was designed using the energy band theory and has a typical combination of semiconductor and ion properties with fuel cells. The TiO2 thin film fuel cell has manifested a notable yield of 364 mW cm−2 at 550 °C. With more oxygen vacancies created, the online intercalation of Li into TiO2 promoted its proton conductivity. This work provides a new idea for constructing LT-SOFC and will hopefully provoke more investigations on exploring the ionic conductivity of semiconductor materials to make new technological breakthroughs for their applications.Conflicts of interest
There are no conflicts to declare.Acknowledgements
This work was supported by the National Natural Science Foundation of China (NSFC, No. 11604088 and 51772080). The authors thank Hubei Provincial 100-Talent Distinguished Professor Grant.References
- S. P. S. Badwal, Solid State Ionics, 1992, 52, 23–32 CrossRef CAS.
- K. Shitara, T. Moriasa, A. Sumitani, A. Seko, H. Hayashi, Y. Koyama, R. Huang, D. Han, H. Moriwake and I. Tanaka, Chem. Mater., 2017, 29, 3763–3768 CrossRef CAS.
- S. Sanna, V. Esposito, J. W. Andreasen, J. Hjelm, W. Zhang, T. Kasama, S. B. Simonsen, M. Christensen, S. Linderoth and N. Pryds, Nat. Mater., 2015, 14, 500 CrossRef CAS PubMed.
- Z. Gao, L. V. Mogni, E. C. Miller, J. G. Railsback and S. A. Barnett, Energy Environ. Sci., 2016, 9, 1602–1644 RSC.
- M. Gödickemeier and L. J. Gauckler, J. Electrochem. Soc., 1998, 145, 414–421 CrossRef.
- M. H. D. Othman, N. Droushiotis, Z. Wu, G. Kelsall and K. Li, Adv. Mater., 2011, 23, 2480–2483 CrossRef CAS PubMed.
- B. Zhu, R. Raza, H. Qin, Q. Liu and L. Fan, Energy Environ. Sci., 2011, 4, 2986–2992 RSC.
- B. Zhu, P. D. Lund, R. Raza, Y. Ma, L. Fan, M. Afzal, J. Patakangas, Y. He, Y. Zhao, W. Tan, Q.-A. Huang, J. Zhang and H. Wang, Adv. Energy Mater., 2015, 5, 1401895 CrossRef.
- B. Zhu, Y. Huang, L. Fan, Y. Ma, B. Wang, C. Xia, M. Afzal, B. Zhang, W. Dong, H. Wang and P. D. Lund, Nano Energy, 2016, 19, 156–164 CrossRef CAS.
- Y. Zhou, X. Guan, H. Zhou, K. Ramadoss, S. Adam, H. Liu, S. Lee, J. Shi, M. Tsuchiya, D. D. Fong and S. Ramanathan, Nature, 2016, 534, 231–234 CrossRef CAS PubMed.
- R. Lan and S. Tao, Adv. Energy Mater., 2014, 4, 1301683 CrossRef.
- R. Lan and S. Tao, Chem.–Eur. J., 2015, 21, 1350–1358 CrossRef CAS PubMed.
- W. Dong, T. Zhang, X. Chen, B. Wang and B. Zhu, Phys. Status Solidi A, 2017, 214, 1700089 CrossRef.
- H. Zhou, Q. Chen, G. Li, S. Luo, T.-b. Song, H.-S. Duan, Z. Hong, J. You, Y. Liu and Y. Yang, Science, 2014, 345, 542–546 CrossRef CAS PubMed.
- A. Kudo and Y. Miseki, Chem. Soc. Rev., 2009, 38, 253–278 RSC.
- C. Liu, Z. G. Neale and G. Cao, Mater. Today Mater. Today, 2016, 19, 109–123 CrossRef CAS.
- E. D. Wachsman and K. T. Lee, Science, 2011, 334, 935–939 CrossRef CAS PubMed.
- P.-C. Su, C.-C. Chao, J. H. Shim, R. Fasching and F. B. Prinz, Nano Lett., 2008, 8, 2289–2292 CrossRef CAS PubMed.
- G. Liu, J. A. Rodriguez, J. Hrbek, J. Dvorak and C. H. F. Peden, J. Phys. Chem. B, 2001, 105, 7762–7770 CrossRef CAS.
- P. D. C. King, T. D. Veal, S. A. Hatfield, P. H. Jefferson, C. F. McConville, C. E. Kendrick, C. H. Swartz and S. M. Durbin, Appl. Phys. Lett., 2007, 91, 112103 CrossRef.
- X. Zhang, M. Robertson, C. Deĉes-Petit, W. Qu, O. Kesler, R. Maric and D. Ghosh, J. Power Sources, 2007, 164, 668–677 CrossRef CAS.
- L. Fan and P.-C. Su, J. Power Sources, 2016, 306, 369–377 CrossRef CAS.
- Z. a. Li, Z. Zhu, C.-C. Chueh, S. B. Jo, J. Luo, S.-H. Jang and A. K. Y. Jen, J. Am. Chem. Soc., 2016, 138, 11833–11839 CrossRef CAS PubMed.
- L. Fan, H. Zhang, M. Chen, C. Wang, H. Wang, M. Singh and B. Zhu, Int. J. Hydrogen Energy, 2013, 38, 11398–11405 CrossRef CAS.
- H. Hu, Q. Lin, Z. Zhu, X. Liu, M. Afzal, Y. He and B. Zhu, J. Power Sources, 2015, 275, 476–482 CrossRef CAS.
- K.-D. Kreuer, Chem. Mater., 1996, 8, 610–641 CrossRef CAS.
- L.-B. Mo, Y. Wang, Y. Bai, Q.-Y. Xiang, Q. Li, W.-Q. Yao, J.-O. Wang, K. Ibrahim, H.-H. Wang, C.-H. Wan and J.-L. Cao, Sci. Rep., 2015, 5, 17634 CrossRef CAS PubMed.
- M. V. Koudriachova, S. W. de Leeuw and N. M. Harrison, Phys. Rev. B: Condens. Matter Mater. Phys., 2004, 70, 165421 CrossRef.
- K. Matsumoto, R. Kuzuo, K. Takeya and A. Yamanaka, J. Power Sources, 1999, 81–82, 558–561 CrossRef CAS.
- Z. Wang, S. Huang, B. Chen, H. Wu and Y. Zhang, J. Mat. Chem. A, 2014, 2, 19983–19987 RSC.
- L. J. Hardwick, M. Holzapfel, P. Novák, L. Dupont and E. Baudrin, Electrochim. Acta, 2007, 52, 5357–5367 CrossRef CAS.
- C. Arrouvel, S. C. Parker and M. S. Islam, Chem. Mater., 2009, 21, 4778–4783 CrossRef CAS.
- C. Zhang, H. Yu, Y. Li, Y. Gao, Y. Zhao, W. Song, Z. Shao and B. Yi, ChemSusChem, 2013, 6, 659–666 CrossRef CAS PubMed.
- W.-D. Zhu, C.-W. Wang, J.-B. Chen, Y. Li and J. Wang, Appl. Surf. Sci., 2014, 301, 525–529 CrossRef CAS.
- X. Zhang, H. Tian, X. Wang, G. Xue, Z. Tian, J. Zhang, S. Yuan, T. Yu and Z. Zou, Mater. Lett., 2013, 100, 51–53 CrossRef CAS.
- N.-L. Wu, M.-S. Lee, Z.-J. Pon and J.-Z. Hsu, J. Photochem. Photobiol., A, 2004, 163, 277–280 CrossRef CAS.
- S. G. Ullattil and P. Periyat, J. Mat. Chem. A, 2016, 4, 5854–5858 RSC.
- R. Ren, Z. Wen, S. Cui, Y. Hou, X. Guo and J. Chen, Sci. Rep., 2015, 5, 10714 CrossRef CAS PubMed.
- G. Wang, H. Wang, Y. Ling, Y. Tang, X. Yang, R. C. Fitzmorris, C. Wang, J. Z. Zhang and Y. Li, Nano Lett., 2011, 11, 3026–3033 CrossRef CAS PubMed.
- B. Bharti, S. Kumar, H.-N. Lee and R. Kumar, Sci. Rep., 2016, 6, 32355 CrossRef CAS PubMed.
- V. Dimitrov and T. Komatsu, J. Solid State Chem., 2002, 163, 100–112 CrossRef CAS.
- T. L. Barr, Modern ESCA, The Principles and Practice of X-Ray Photoelectron Spectroscopy, CRS Press, Boca Raton, TL, 1994 Search PubMed.
- D. A. Pawlak, M. Ito, M. Oku, K. Shimamura and T. Fukuda, J. Phys. Chem. B, 2002, 106, 504–507 CrossRef CAS.
- X. Liu, W. Dong, C. Xia, Q. Huang, Y. Cai, L. Wei, G. Wu, X. Wang, Y. Tong, Z. Qiao, Y. Meng, N. Mushtaq, B. Wang and H. Wang, Int. J. Hydrogen Energy, 2018, 43, 12773–12781 CrossRef CAS.
- D. J. D. Corcoran, D. P. Tunstall and J. T. S. Irvine, Solid State Ionics, 2000, 136–137, 297–303 CrossRef CAS.
- N. Wetchakun, B. Incessungvorn, K. Wetchakun and S. Phanichphant, Mater. Lett., 2012, 82, 195–198 CrossRef CAS.
- A. J. Hupfer, E. V. Monakhov, B. G. Svensson, I. Chaplygin and E. V. Lavrov, Sci. Rep., 2017, 7, 17065 CrossRef CAS.
- J. B. Bates, J. C. Wang and R. A. Perkins, Phys. Rev. B, 1979, 19, 4130–4139 CrossRef CAS.
- P. Sawant, S. Varma, B. N. Wani and S. R. Bharadwaj, Int. J. Hydrogen Energy, 2012, 37, 3848–3856 CrossRef CAS.
Footnote |
| † Electronic supplementary information (ESI) available. See DOI: 10.1039/c9ta01941c |
| This journal is © The Royal Society of Chemistry 2019 |