 Open Access Article
Deep eutectic solvent route synthesis of zinc and copper vanadate n-type semiconductors – mapping oxygen vacancies and their effect on photovoltage†
Sangki
Hong
a,
Rachel M.
Doughty
 b,
Frank E.
Osterloh
 b and
Julia V.
Zaikina
 *a
*a
aDepartment of Chemistry, Iowa State University, Ames, Iowa 50011, USA. E-mail: yzaikina@iastate.edu
bDepartment of Chemistry, University of California at Davis, Davis, California 95616, USA
First published on 8th April 2019
Abstract
Ternary metal oxides M2V2O7−δ (M = Zn and Cu) were synthesized by dissolving binary metal oxide precursors in an environmentally benign deep eutectic solvent (DES), which is a eutectic mixture of a hydrogen bond donor and acceptor, followed by annealing in an open crucible. The unique reaction environment provided by the evolved ammonia allows for stabilization of oxygen vacancies and reduced oxidation states of metal ions within an oxide matrix without the need for any post-treatment with flammable reducing agents. According to comprehensive characterization, including X-ray photoelectron spectroscopy (XPS), neutron powder diffraction, and UV-vis spectroscopy, oxygen deficiency is accompanied by reduced oxidation states of metal centers (Cu+ or V4+), resulting in oxides with mixed-valence metal oxidation states. The amount of oxygen vacancies can be tuned by changing the annealing temperature providing control over band gaps of ternary metal oxides and mid-gap states from reduced metal centers. All synthesized vanadates are n-type semiconductors based on negative photovoltages obtained from surface photovoltage spectroscopy (SPS). A decay of the photovoltage with increasing annealing temperatures is attributed to electron trapping and electron/hole recombination at V4+ and Cu+ mid-gap states. This work shows for the first time the impact of oxygen vacancies on the electronic structure of DES synthesized oxides for solar energy conversion applications.
Introduction
Since the discovery of photoelectrochemical (PEC) water oxidation with TiO2,1 research on semiconducting metal oxide photocatalysts has been growing. Other d0 binary metal oxides containing Zr4+, Nb5+, Ta5+, and W6+ have been studied due to their photocatalytic properties.2–13 However, their wide bandgaps limit absorption of visible-light, which is a major part of the solar spectrum at the surface of the earth. Ternary metal oxides are attractive candidates for solar PEC applications because their crystal and, consequently, electronic structure can be modified by introducing an additional metal.13 For example, SnNbO6 with a band gap of 2.3 eV exhibits improved photocatalytic activity for hydrogen evolution under visible light irradiation with Pt loading.14 Fe2V4O13 was found to have a narrow band gap of 1.83 eV and show high efficiency in photoreduction of CO2 to hydrocarbon fuels.15Oxygen vacancies play a central role in optical absorption, transport properties, and photocatalytic performance of oxide materials. For example, SrTiO3 photoelectrodes must be annealed in a hydrogen atmosphere at 1050 °C in order to produce the desired semiconducting behavior for water oxidation.16 Similarly, hydrogenated TiO2 can be prepared by heat treatment of white TiO2 in 20 bar H2 at 200 °C for 5 days.17 This oxygen-defective TiO2−δ exhibits improved UV photocatalytic activity for hydrogen evolution from aqueous solutions of sacrificial electron donors. Hydrogen-treated WO3 and BiVO4 with oxygen vacancies exhibit enhanced catalytic activity for photoelectrochemical water oxidation.18,19
Recently, copper vanadates were reported to be a potential photoanode candidate for the visible-light driven water splitting reaction.20–24 In the electronic structure of β-Cu2V2O7 the valence band maximum (VBM) and conduction band minimum (CBM) are dominated by O 2p and Cu 3d orbitals respectively.22 The partially filled d-subshell of copper improves visible light absorption and photocurrent for the oxygen evolution reaction.20–23 Interestingly, α-Zn2V2O7 and β-Cu2V2O7 belong to the family of M2V2O7 (M = Zn and Cu) with similar monoclinic structures. Both compounds also resemble each other in that they have O 2p as the main contribution to the valence band maximum (VBM).22,25 However, the conduction band of α-Zn2V2O7 predominantly consists of V 3d orbitals due to the completely filled d-subshell of zinc.25 To the best of our knowledge, a systematic study on M2V2O7 (M = Zn and Cu) has not been reported.
In this work, α-Zn2V2O7−n and β-Cu2V2O7−m were prepared by reaction in a deep eutectic solvent (DES), which is a eutectic mixture of a hydrogen bond donor (urea) and acceptor (choline chloride) in a 2![[thin space (1/6-em)]](https://www.rsc.org/images/entities/char_2009.gif) :
:![[thin space (1/6-em)]](https://www.rsc.org/images/entities/char_2009.gif) 1 molar ratio.26–28 This synthetic route includes dissolution of binary oxides in an environmentally friendly and benign eutectic mixture followed by heat treatment in air. High solubility of binary metal oxides in the DES and fast mixing of the metal precursors are attractive features of this synthetic method, which also provide control over the size and composition of the products and concentration of oxygen vacancies. Moreover, this route does not require flammable reducing agents and/or a complex experimental set-up for post-treatment. Thermal stability and synthesis optimization of α-Zn2V2O7−n and β-Cu2V2O7−m were studied, and band gap modification by oxygen vacancies was investigated. The impact of oxygen vacancies on the generation of a surface photovoltage under visible light is discussed.
1 molar ratio.26–28 This synthetic route includes dissolution of binary oxides in an environmentally friendly and benign eutectic mixture followed by heat treatment in air. High solubility of binary metal oxides in the DES and fast mixing of the metal precursors are attractive features of this synthetic method, which also provide control over the size and composition of the products and concentration of oxygen vacancies. Moreover, this route does not require flammable reducing agents and/or a complex experimental set-up for post-treatment. Thermal stability and synthesis optimization of α-Zn2V2O7−n and β-Cu2V2O7−m were studied, and band gap modification by oxygen vacancies was investigated. The impact of oxygen vacancies on the generation of a surface photovoltage under visible light is discussed.
Experimental
Materials synthesis
Urea (Alfa, 99%, crystalline), ZnO (Alfa, 99.9%), Cu2O (Alfa, 99.9%), and V2O5 (Alfa, 99.6% min) were used as received without any further purification. Choline chloride (Sigma-Aldrich, ≥98%) was dried at 120 °C under vacuum prior to use. A deep eutectic solvent (DES) was prepared by mixing urea and choline chloride in a 2![[thin space (1/6-em)]](https://www.rsc.org/images/entities/char_2009.gif) :
:![[thin space (1/6-em)]](https://www.rsc.org/images/entities/char_2009.gif) 1 molar ratio (54.322 g urea and 63.750 g choline chloride for α-Zn2V2O7 and 55.200 g urea and 64.800 g choline chloride for β-Cu2V2O7). The mixture was heated at 70 °C in a parafilm-covered glass beaker with stirring until a homogeneous liquid was obtained. Each metal precursor (0.567 g ZnO and 0.633 g V2O5 for α-Zn2V2O7 and 0.506 g Cu2O and 0.644 g V2O5 for β-Cu2V2O7) was dissolved in a separate beaker containing the DES under vigorous stirring at 70 °C. The concentration of ZnO, Cu2O, and V2O5 was 0.06986 M, 0.03493 M, and 0.03493 M, respectively. The solutions with the dissolved precursors were further mixed (ZnO and V2O5 for α-Zn2V2O7 and Cu2O and V2O5 for β-Cu2V2O7) and left stirring at 70 °C overnight with a parafilm cover. Afterwards, the solutions (light green for α-Zn2V2O7 and dark blue for β-Cu2V2O7) were transferred to porcelain crucibles for calcination (7 mL of solution in 30 mL crucibles). A heat treatment was performed in open crucibles, in air using a muffle furnace (box-type). A heating rate of 10 °C min−1 was employed. For α-Zn2V2O7, the precursor solution was heated at 230 °C for 2 hours and then calcined at 500 °C, 600 °C, or 700 °C for a span of 10.5 hours (500 °C) or 12 hours (600 °C and 700 °C). For β-Cu2V2O7, the precursor solution was heated at 300 °C for 7 hours and then calcination was carried out at 400 °C or 500 °C for 7 hours. About 27 mg of α-Zn2V2O7 (76% yield) and 32 mg of β-Cu2V2O7 (72% yield) powdered products were obtained. Different colors were observed for samples annealed at different temperatures: pale yellow (500 °C)/grey (600 °C)/light pink (700 °C) for α-Zn2V2O7 and orange (400 °C)/dark red (500 °C) for β-Cu2V2O7.
1 molar ratio (54.322 g urea and 63.750 g choline chloride for α-Zn2V2O7 and 55.200 g urea and 64.800 g choline chloride for β-Cu2V2O7). The mixture was heated at 70 °C in a parafilm-covered glass beaker with stirring until a homogeneous liquid was obtained. Each metal precursor (0.567 g ZnO and 0.633 g V2O5 for α-Zn2V2O7 and 0.506 g Cu2O and 0.644 g V2O5 for β-Cu2V2O7) was dissolved in a separate beaker containing the DES under vigorous stirring at 70 °C. The concentration of ZnO, Cu2O, and V2O5 was 0.06986 M, 0.03493 M, and 0.03493 M, respectively. The solutions with the dissolved precursors were further mixed (ZnO and V2O5 for α-Zn2V2O7 and Cu2O and V2O5 for β-Cu2V2O7) and left stirring at 70 °C overnight with a parafilm cover. Afterwards, the solutions (light green for α-Zn2V2O7 and dark blue for β-Cu2V2O7) were transferred to porcelain crucibles for calcination (7 mL of solution in 30 mL crucibles). A heat treatment was performed in open crucibles, in air using a muffle furnace (box-type). A heating rate of 10 °C min−1 was employed. For α-Zn2V2O7, the precursor solution was heated at 230 °C for 2 hours and then calcined at 500 °C, 600 °C, or 700 °C for a span of 10.5 hours (500 °C) or 12 hours (600 °C and 700 °C). For β-Cu2V2O7, the precursor solution was heated at 300 °C for 7 hours and then calcination was carried out at 400 °C or 500 °C for 7 hours. About 27 mg of α-Zn2V2O7 (76% yield) and 32 mg of β-Cu2V2O7 (72% yield) powdered products were obtained. Different colors were observed for samples annealed at different temperatures: pale yellow (500 °C)/grey (600 °C)/light pink (700 °C) for α-Zn2V2O7 and orange (400 °C)/dark red (500 °C) for β-Cu2V2O7.
Characterization
Results and discussion
The monoclinic structures of M2V2O7 vanadates are similar for both metals, M = Cu and Zn, and are based on corner-sharing VO4 tetrahedra and MO5 units with two distinct coordination environments for Cu and Zn (Fig. 1a and c).32,33 Each Zn ion in α-Zn2V2O7 is coordinated with five oxygen atoms to form a ZnO5 distorted trigonal bipyramid, while the coordination environment of Cu ions in β-Cu2V2O7 is a distorted square pyramid.32,33 In turn, in the high temperature polymorphs of M2V2O7 (Fig. 1b and d), Zn and Cu ions have a distorted tetrahedral coordination environment.34,35 Monoclinic β-Zn2V2O7 has a V ion occupying the distorted VO5 trigonal bipyramid, while VO4 tetrahedra are found in orthorhombic α-Cu2V2O7.34,35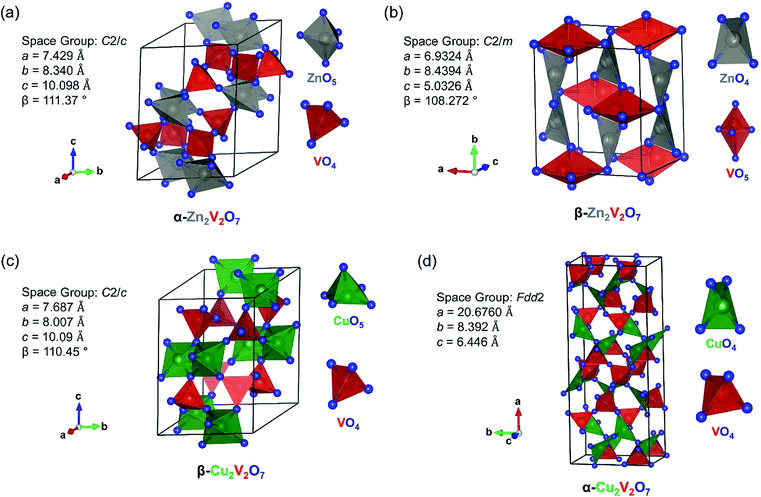 | ||
| Fig. 1 Structure of (a) α-Zn2V2O7 (ICSD no. 2886), (b) β-Zn2V2O7 (ICSD no. 250002), (c) β-Cu2V2O7 (ICSD no. 23479) and (d) α-Cu2V2O7 (ICSD no. 40973). Zn: grey, Cu: green, V: red, and O: blue. | ||
Synthesis
A deep eutectic solvent is a eutectic mixture of a hydrogen-bond donor and a hydrogen-bond acceptor, typically quaternary ammonium salt choline chloride C5H14ClNO ((2-hydroxyethyl)trimethylammonium chloride, melting point of 302 °C).26–28 Due to hydrogen bonding between choline chloride and the hydrogen-bond donor, the melting point of the mixture is lowered as compared to that of its individual components.26–28 In this work, urea (mp 132–135 °C) was used as the hydrogen-bond donor, which when combined with choline chloride in a molar ratio of 2![[thin space (1/6-em)]](https://www.rsc.org/images/entities/char_2009.gif) :
:![[thin space (1/6-em)]](https://www.rsc.org/images/entities/char_2009.gif) 1 forms a eutectic with a melting point of 30 °C, as determined by establishing a solid–liquid binary phase diagram of choline chloride–urea.36 Binary transition metal oxides, such as ZnO, Cu2O, and V2O5, exhibit high solubility in the urea
1 forms a eutectic with a melting point of 30 °C, as determined by establishing a solid–liquid binary phase diagram of choline chloride–urea.36 Binary transition metal oxides, such as ZnO, Cu2O, and V2O5, exhibit high solubility in the urea![[thin space (1/6-em)]](https://www.rsc.org/images/entities/char_2009.gif) :
:![[thin space (1/6-em)]](https://www.rsc.org/images/entities/char_2009.gif) choline eutectic mixture: 1.31 M for ZnO at 70 °C, 0.189 M for Cu2O at 70 °C, and 0.030 M for V2O5 at 50 °C.37 Notably, these solubilities are comparable to that in hydrochloric acid,37 thus the deep eutectic solvent can be considered as an environmentally sustainable replacement for corrosive acids in the synthesis of materials. Cu2O was utilized for the synthesis of β-Cu2V2O7, as opposed to CuO, because the latter has low solubility (0.00349 M).37 For the synthesis, metal oxide precursors ZnO, Cu2O, and V2O5 were fully dissolved in the urea
choline eutectic mixture: 1.31 M for ZnO at 70 °C, 0.189 M for Cu2O at 70 °C, and 0.030 M for V2O5 at 50 °C.37 Notably, these solubilities are comparable to that in hydrochloric acid,37 thus the deep eutectic solvent can be considered as an environmentally sustainable replacement for corrosive acids in the synthesis of materials. Cu2O was utilized for the synthesis of β-Cu2V2O7, as opposed to CuO, because the latter has low solubility (0.00349 M).37 For the synthesis, metal oxide precursors ZnO, Cu2O, and V2O5 were fully dissolved in the urea![[thin space (1/6-em)]](https://www.rsc.org/images/entities/char_2009.gif) :
:![[thin space (1/6-em)]](https://www.rsc.org/images/entities/char_2009.gif) choline chloride mixture at 70 °C. According to Abbott et al., [ZnClO·urea]− and [VO2Cl2]− species are present in the eutectic urea
choline chloride mixture at 70 °C. According to Abbott et al., [ZnClO·urea]− and [VO2Cl2]− species are present in the eutectic urea![[thin space (1/6-em)]](https://www.rsc.org/images/entities/char_2009.gif) :
:![[thin space (1/6-em)]](https://www.rsc.org/images/entities/char_2009.gif) choline chloride mixture upon dissolution of ZnO and V2O5 oxides.37 We observed that the resulting solutions have distinct colors, probably due to various oxidation states of the metal in the metal complex. The [ZnClO·urea]− complex produces a colorless liquid, while the [VO2Cl2]− complex is green, suggesting increased d orbital splitting of V5+ causing a blue-shift of the optical absorption. The colors of CuO and Cu2O dissolved in the urea
choline chloride mixture upon dissolution of ZnO and V2O5 oxides.37 We observed that the resulting solutions have distinct colors, probably due to various oxidation states of the metal in the metal complex. The [ZnClO·urea]− complex produces a colorless liquid, while the [VO2Cl2]− complex is green, suggesting increased d orbital splitting of V5+ causing a blue-shift of the optical absorption. The colors of CuO and Cu2O dissolved in the urea![[thin space (1/6-em)]](https://www.rsc.org/images/entities/char_2009.gif) :
:![[thin space (1/6-em)]](https://www.rsc.org/images/entities/char_2009.gif) choline chloride mixture are light blue and dark blue, respectively, indicating that the oxidation state of copper ions might be the same in the resulting copper oxide solutions. The solutions were then combined and calcined in open crucibles, allowing for the removal of the deep eutectic solvent in the form of gaseous NH3, HCl, and CO2 followed by crystallization of ternary oxides. Samples were first heated at 230 °C for α-Zn2V2O7 and 300 °C for β-Cu2V2O7 to remove NH3 (g) and HCl (g) and to avoid extensive foaming. Formation of crystalline NH4Cl in the ventilation system supports the hypothesis. The gas generated from this first heating step made a pH paper turn dark green and then the liquid sample became a tar-like product, suggesting that a basic mixture of gaseous NH3 and HCl escaped first and the leftover hydrocarbon was eliminated upon further heating. α-Zn2V2O7 was synthesized at three different calcination temperatures, 500 °C, 600 °C and 700 °C, while calcination at 400 °C results in an amorphous product. Powder X-ray diffraction peaks are indexed in accordance with α-Zn2V2O7 (ICSD no. 2886) with a minor amount of impurity (∼2 wt%) of ZnV2O6 as shown in Fig. 2a. β-Cu2V2O7 was synthesized by a similar route, but lower calcination temperatures (400 °C and 500 °C) were employed. Powder X-ray diffraction peaks are indexed to β-Cu2V2O7 (ICSD no. 23479) as shown in Fig. 2b. It is notable that β-Cu2V2O7 was obtained even at a low temperature of 400 °C, at which crystalline α-Zn2V2O7 was not observed. Moreover, the mild synthetic conditions yield a phase-pure crystalline β-Cu2V2O7 unlike a recent report on a solution combustion synthesis, in which β-Cu2V2O7 was synthesized at 500 °C with impurities (3.0% α-Cu2V2O7 and 6.5% α-CuV2O6).38
choline chloride mixture are light blue and dark blue, respectively, indicating that the oxidation state of copper ions might be the same in the resulting copper oxide solutions. The solutions were then combined and calcined in open crucibles, allowing for the removal of the deep eutectic solvent in the form of gaseous NH3, HCl, and CO2 followed by crystallization of ternary oxides. Samples were first heated at 230 °C for α-Zn2V2O7 and 300 °C for β-Cu2V2O7 to remove NH3 (g) and HCl (g) and to avoid extensive foaming. Formation of crystalline NH4Cl in the ventilation system supports the hypothesis. The gas generated from this first heating step made a pH paper turn dark green and then the liquid sample became a tar-like product, suggesting that a basic mixture of gaseous NH3 and HCl escaped first and the leftover hydrocarbon was eliminated upon further heating. α-Zn2V2O7 was synthesized at three different calcination temperatures, 500 °C, 600 °C and 700 °C, while calcination at 400 °C results in an amorphous product. Powder X-ray diffraction peaks are indexed in accordance with α-Zn2V2O7 (ICSD no. 2886) with a minor amount of impurity (∼2 wt%) of ZnV2O6 as shown in Fig. 2a. β-Cu2V2O7 was synthesized by a similar route, but lower calcination temperatures (400 °C and 500 °C) were employed. Powder X-ray diffraction peaks are indexed to β-Cu2V2O7 (ICSD no. 23479) as shown in Fig. 2b. It is notable that β-Cu2V2O7 was obtained even at a low temperature of 400 °C, at which crystalline α-Zn2V2O7 was not observed. Moreover, the mild synthetic conditions yield a phase-pure crystalline β-Cu2V2O7 unlike a recent report on a solution combustion synthesis, in which β-Cu2V2O7 was synthesized at 500 °C with impurities (3.0% α-Cu2V2O7 and 6.5% α-CuV2O6).38
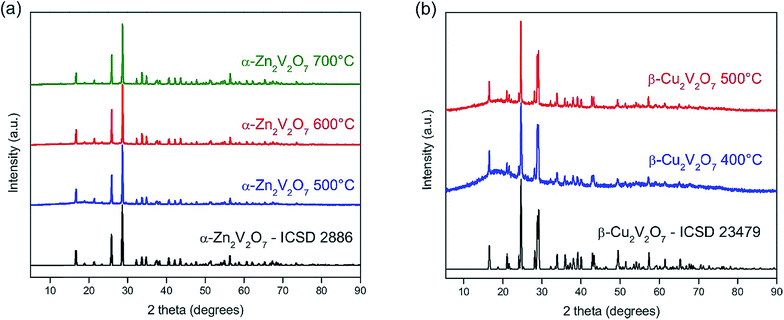 | ||
| Fig. 2 PXRD patterns of α-Zn2V2O7 synthesized at 500, 600 and 700 °C (a) and β-Cu2V2O7 synthesized at 400 and 500 °C (b) together with calculated patterns using experimentally determined crystal structures.32,33 | ||
The recent work by Söldner et al. reports on a DES-assisted synthesis of spinel-type ferrites MFe2O4 (M = Mg, Co and Ni) from stable binary metal oxide precursors,39 which normally would require a high annealing temperature for the solid-state reaction to form MFe2O4. Using a choline chloride and maleic acid mixture as a solvent, ternary ferrites were synthesized at a lower temperature (500 °C and 600 °C) as compared to the solid-state reaction.39 Our results demonstrate that the synthesis route employing the deep eutectic solvent as a reaction medium can be extended to M2V2O7 (M = Zn and Cu) systems.
Further insight into thermal stability and optimized synthesis conditions of zinc and copper vanadates was obtained from in situ high-temperature powder X-ray diffraction (HT PXRD) and DSC/TGA. It is crucial to remove the urea![[thin space (1/6-em)]](https://www.rsc.org/images/entities/char_2009.gif) :
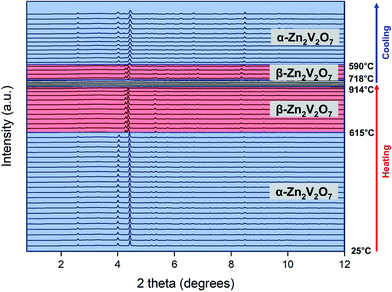
:![[thin space (1/6-em)]](https://www.rsc.org/images/entities/char_2009.gif) choline mixture before the thermal stability study, so the transformation of oxides is not hindered by the thermal decomposition of the deep eutectic solvent. Thus, the pre-calcined powdered samples were used in these experiments (calcined at 500 °C for zinc vanadates and 400 °C for copper vanadates). Fig. 3 shows the evolution of powder X-ray diffraction patterns of α-Zn2V2O7 powders upon heating followed by cooling (with a minor impurity of ZnV2O6, ∼2 wt%). Upon heating to 615 °C, no change in PXRD patterns was observed except the shift of Bragg peaks because of the thermal expansion. α-Zn2V2O7 transformed into β-Zn2V2O7 above 615 °C and remained the same until 914 °C, above which the crystalline phase disappeared due to melting. Upon cooling the melt from 955 °C, β-Zn2V2O7 appeared as a main phase below 718 °C and transformed back to α-Zn2V2O7 at 590 °C. DSC/TGA (Fig. 4) of the same sample corroborated these findings but allowed more accurate determination of the transition temperatures.
choline mixture before the thermal stability study, so the transformation of oxides is not hindered by the thermal decomposition of the deep eutectic solvent. Thus, the pre-calcined powdered samples were used in these experiments (calcined at 500 °C for zinc vanadates and 400 °C for copper vanadates). Fig. 3 shows the evolution of powder X-ray diffraction patterns of α-Zn2V2O7 powders upon heating followed by cooling (with a minor impurity of ZnV2O6, ∼2 wt%). Upon heating to 615 °C, no change in PXRD patterns was observed except the shift of Bragg peaks because of the thermal expansion. α-Zn2V2O7 transformed into β-Zn2V2O7 above 615 °C and remained the same until 914 °C, above which the crystalline phase disappeared due to melting. Upon cooling the melt from 955 °C, β-Zn2V2O7 appeared as a main phase below 718 °C and transformed back to α-Zn2V2O7 at 590 °C. DSC/TGA (Fig. 4) of the same sample corroborated these findings but allowed more accurate determination of the transition temperatures.
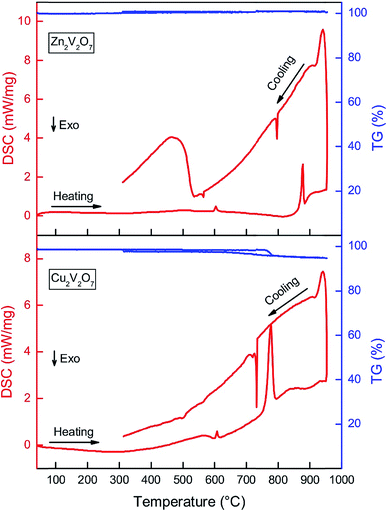
Upon heating, the first sharp endothermic peak was observed at 602 °C, which corresponds to the α → β transformation of Zn2V2O7. The onset temperature of the second endothermic peak at 850 °C indicates gradual melting of β-Zn2V2O7. Upon cooling, the first exothermic peak was observed at 795 °C, which is due to the formation of crystalline β-Zn2V2O7 from the melt. The second exothermic peak at 566 °C is indicative of the β to α phase transformation of Zn2V2O7. The bump from 309 to 533 °C in the DSC curve is due to the sample deposited at the bottom of the crucible, which is in contact with a thermocouple. The deviation of temperatures at which thermal events occurred during the in situ PXRD and DSC/TGA could be due to different heating/cooling rates used during the experiment. We believe that the DSC/TGA curves provide a more accurate temperature of thermal events due to slower heating and cooling rates as well as because the bulk effect is being registered as opposing to HT PXRD results. The phase transformation temperature determined here is in accordance with the phase diagram established by Kurzawa et al.: 590 °C for the α → β transformation and above 855 °C for the melting of β-Zn2V2O7.40 Additionally, there was no variation in the TG signal upon heating/cooling of the sample, suggesting that the sample calcined at 500 °C does not contain any carbon-based impurities from the urea![[thin space (1/6-em)]](https://www.rsc.org/images/entities/char_2009.gif) :
:![[thin space (1/6-em)]](https://www.rsc.org/images/entities/char_2009.gif) choline chloride mixture. Samples calcined at a lower temperature (350 °C) have about 87% mass loss and several exothermic peaks between 400 °C and 700 °C corresponding to the elimination of the carbon-based solvent by a combustion reaction. Thus, the suggested reaction process is as follows:
choline chloride mixture. Samples calcined at a lower temperature (350 °C) have about 87% mass loss and several exothermic peaks between 400 °C and 700 °C corresponding to the elimination of the carbon-based solvent by a combustion reaction. Thus, the suggested reaction process is as follows:
Heating:
 | (1) |
 | (2) |
Cooling:
 | (3) |
Upon heating, the dissolved oxide precursors react to form α-Zn2V2O7, which further transforms into β-Zn2V2O7, at ∼602 °C. The β-form is present at a calcination temperature of 700 °C (2). The β → α transformation upon natural cooling resulted in α-Zn2V2O7(3). A quenching experiment was performed to stabilize β-Zn2V2O7; however, the phase present in the product was α-Zn2V2O7.
Cu2V2O7 goes through a more complicated phase transformation and is less thermally stable than ZnV2O7, as determined by HT PXRD (Fig. S1†) and DSC/TGA (Fig. 4). The first endothermic peak of the DSC data was observed at 600 °C, which was attributed to the β → α + γ transformation together with partial decomposition of the β-phase into Cu1.5V12O29 and presumably amorphous copper oxide. The weak signal (onset temperature of 712 °C in the DSC data) is due to melting of the α-phase, which can be understood by the low enthalpy value from the small amount of the α-phase.41 The third endothermic peak at 750 °C corresponds to the melting of the γ-phase and Cu1.5V12O29, accompanied by 3% mass loss as evident from TGA data. Since no additional signals were observed in mass spectrum/FTIR data in this temperature range, the mass loss was attributed to oxygen evolution upon melting. Upon cooling, the first exothermic peak at 735 °C is due to partial crystallization of γ-Cu2V2O7,41 followed by a weak exothermic peak at 720 °C from the γ → α transformation. Interestingly, the sample mass was regained during the crystallization process upon cooling, suggesting that oxygen atoms were restored in the crystal structure. The cooling process is complicated with multiple weak DSC signals between 400 °C and 600 °C because γ-Cu2V2O7 melts peritectically and low-melting β-Cu2V2O7, CuVO3 and other vanadates containing mono- and divalent copper crystallize.41
Scanning electron microscopy (SEM) was used to characterize the morphology and microstructure of α-Zn2V2O7 and β-Cu2V2O7 samples obtained by calcination at various temperatures (Fig. 5). α-Zn2V2O7 powders have pebble-shaped morphologies with sizes in the ranges 1–3 μm, 2–20 μm, and 4–20 μm for the samples synthesized at 500 °C, 600 °C, and 700 °C, respectively. β-Cu2V2O7 has a similar particle shape with a size of 0.1–0.5 μm and 1–7 μm for the samples synthesized at 400 °C and 500 °C, respectively. The average particle sizes were estimated using the Debye–Scherrer equation, using the full width at half-maximum (FWHM) values of the three most intense diffraction peaks (Table S1†). Both methods reveal that the particle size increases as the annealing temperature increases from 500 °C to 600 °C for α-Zn2V2O7 and from 400 °C to 500 °C for β-Cu2V2O7. Energy dispersive X-ray spectroscopy (EDS) confirms the absence of metals other than Cu, V, and Zn, and additionally the Zn/V and Cu/V ratio was determined to agree with the stoichiometric ratio 2![[thin space (1/6-em)]](https://www.rsc.org/images/entities/char_2009.gif) :
:![[thin space (1/6-em)]](https://www.rsc.org/images/entities/char_2009.gif) 2 (Table S1†). Thus, higher temperature annealing leads to larger particles without altering the composition.
2 (Table S1†). Thus, higher temperature annealing leads to larger particles without altering the composition.
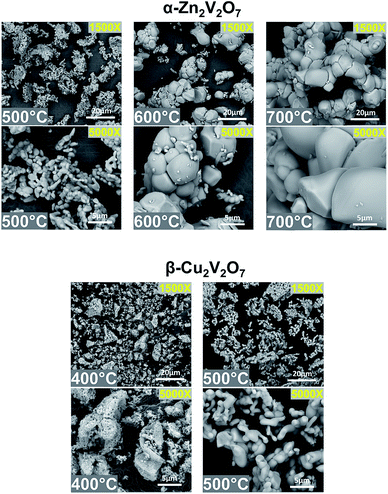 | ||
| Fig. 5 SEM images of α-Zn2V2O7 calcined at 500 °C, 600 °C, and 700 °C (from left to right) and β-Cu2V2O7 calcined at 400 °C and 500 °C (from left to right). | ||
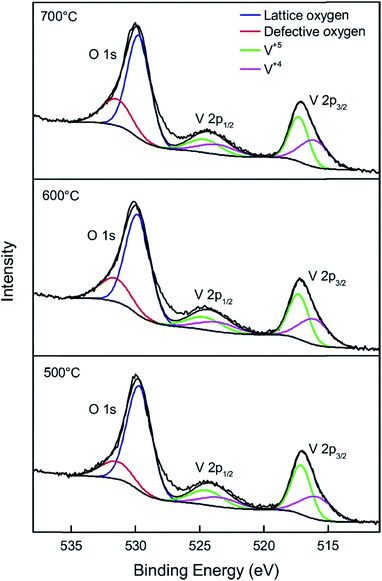
X-ray photoelectron spectroscopy (XPS) was carried out to understand the chemical composition and the chemical state of metals and oxygen on the surface of α-Zn2V2O7 and β-Cu2V2O7. Fig. 6 shows the O 1s and V 2p core level spectra of α-Zn2V2O7. The O 1s region is composed of two components, with a narrow peak at 529.7 eV attributed to the lattice oxygen and a broader peak at 531.5 eV due to oxygen defects.42 Interestingly, the concentration of oxygen defects gradually increases as the annealing temperature increases from 500 °C to 700 °C (Table 1), suggesting that high temperature annealing under basic conditions with evolution of ammonia promotes oxygen vacancy formation. The two vanadium peaks originate from spin orbit-splitting of V 2p3/2 and V 2p1/2,43 while each peak is a superposition of two peaks corresponding to V5+ and V4+. Two fitted peaks at 517.1 eV (V 2p3/2) and 524.5 eV (V 2p1/2)43 are from V5+, while peaks located at 515.9 eV (V 2p3/2) and 523.6 eV (V 2p1/2)43 are attributed to V4+, which needs to be present to compensate the charge imbalance from oxygen vacancies. Unsurprisingly, the concentration of V4+ was the highest in α-Zn2V2O7 annealed at 700 °C (Table 1). Yan et al. and Li et al. also prepared α-Zn2V2O7 and performed XPS analysis, however, only V5+ was identified.25,44 Thus, we believe that α-Zn2V2O7 is stable under ultra-high vacuum conditions, and the partial reduction of V5+ stems from the oxygen vacancy created by the synthesis method utilized. Peak positions of Zn 2p3/2 and 2p1/2 are in agreement with those of ZnO (Fig. S2†),43 indicating that the divalent oxidation state of zinc remains unchanged due to the completely filled d-subshell.
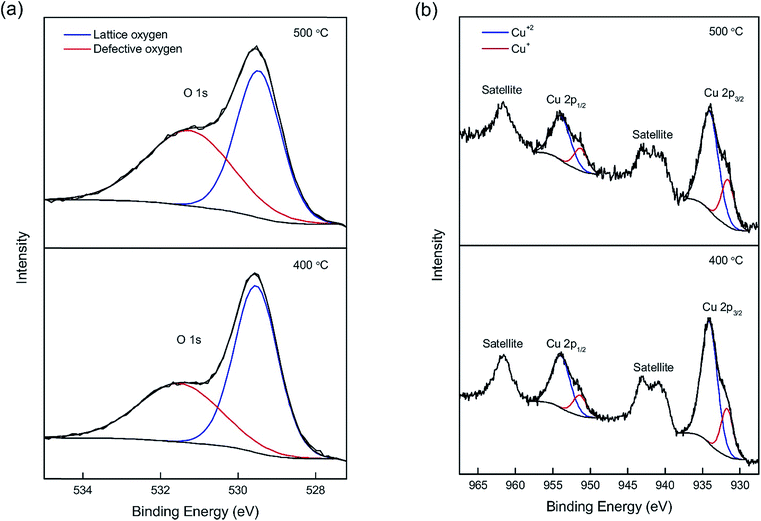
XPS spectra (Fig. 7) show the chemical states of β-Cu2V2O7. The O 1s core level spectra (Fig. 7a) are identified as the superposition of two peaks located at 529.6 eV and 531.5 eV. The narrow peak at 529.6 eV is attributed to lattice oxygen, and the broad peak at 531.5 eV originates from oxygen defects.42 It was noticed that the concentration of oxygen defects in β-Cu2V2O7 shows a similar trend to that in α-Zn2V2O7: a greater amount of oxygen vacancies was observed in the sample synthesized at a higher temperature (Table 1). The shake-up satellite peaks of Cu 2p (939–944 eV and 958–965 eV) (Fig. 7b), in agreement with the CuO spectrum,43 indicate the presence of Cu2+. Both 2p3/2 and 2p1/2 peaks of Cu have a shoulder peak at a lower binding energy (931.6 eV and 951.3 eV, respectively), which is due to Cu1+ formed to compensate oxygen vacancies.43 The concentration of Cu+ increases from β-Cu2V2O7 synthesized at 400 °C to 500 °C due to the greater charge imbalance created by the oxygen defects. Two peaks located at 516.3 eV and 523.8 eV are attributed to V 2p3/2 and V 2p1/2 of V5+, respectively (Fig. S3†).43 Peak splitting between V 2p3/2 and V 2p1/2 is about 7.3 eV, which agrees with the reported value.43 Kim et al. recently prepared β-Cu2V2O7 by electrostatic deposition (ESD) and showed the presence of Cu2+ without Cu+ in its XPS spectrum.45 In addition, the temperature programmed desorption of O2 from Cu2V2O7 performed by Machida et al. reveals that β-Cu2V2O7 does not release oxygen until above 600 °C under ultra-high vacuum.46 Therefore, we believe that the reduction of Cu2+ is a result of oxygen vacancies created by the basic reaction conditions. Also, due to the fact that the reduction potential of V5+ is higher than that of Cu2+, the charge imbalance was compensated by Cu+, unlike ZnV2O7 (vide supra).
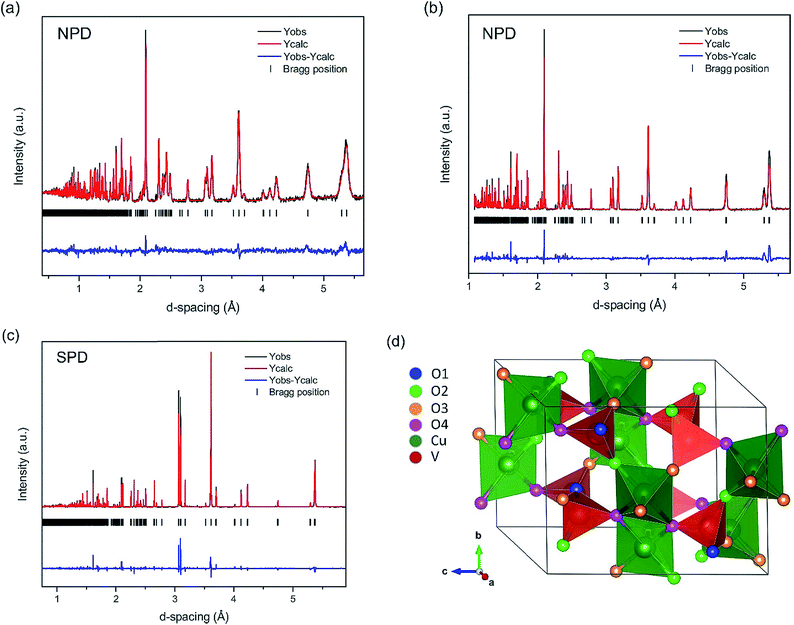
To further confirm the presence of oxygen-deficient sites in β-Cu2V2O7 synthesized at 500 °C, time-of-flight (TOF) neutron powder diffraction (λ = 0.8 Å and 2.665 Å) data were collected. Because of the negative neutron scattering length of vanadium, synchrotron X-ray powder diffraction (λ = 0.412749 Å) data were also collected and refined jointly with the neutron diffraction data (Fig. 8). The Rietveld refinement results indicate a phase pure sample of monoclinic β-Cu2V2O7. The refinement of atomic displacement parameters (ADPs) for all atoms was carried out isotropically. In addition, site occupancy factors (SOFs) and atomic displacement parameters (ADPs) were refined in separate refinement cycles to prevent correlations for all atomic sites. The refinement of SOFs for metal sites did not result in any deviation from unity. The refinement of SOFs for four crystallographically independent oxygen sites indicates that they are partially occupied with the O4 sites bearing the largest amount of vacancies (Table 2). The relatively high ADP value for the O1 site (Table 2) is not from significant thermal motion of oxygen but likely from disordered oxygen ion displacements.47,48 All oxygen positions are corner-shared sites of either vanadium or copper centered polyhedra, such as two VO4 tetrahedra sharing O1 sites. Both O2 and O3 are shared between a VO4 tetrahedron and a CuO5 distorted square pyramid. One VO4 tetrahedron and two CuO5 distorted square pyramids share the O4 site. This O4 site has a higher concentration of oxygen vacancies, in line with its coordination with two mixed valent Cu centers. Unsurprisingly, the O1 site, which is coordinated to V metal centers, has a site fraction close to unity. It should be noted that when the SOF for all O sites is set to 1, such a refinement resulted in a poorer fit with a high Rw value, thus further confirming the presence of partially occupied oxygen sites. Similar partial occupancies (∼0.95(2)) for all oxygen sites were obtained, when the ADPs for all four oxygen sites were constrained to be the same and refined to be 0.0120(2) Å2. It is noteworthy that the expanded unit cell volume and elongated unit cell parameters (a, b, and c) as compared to the reported value (V = 581.9 Å3; a = 7.687(5) Å, b = 8.007(3) Å, and c = 10.09(2) Å from ICSD no. 23479 as compared to unit cell parameters in Table 2) might also be due to the oxygen defects. Similar enlargement of the unit cell volume was reported for vacancy-containing ZnO49,50 and indium-tin-oxide (ITO) thin films.51 Moreover, the absence of cation vacancies as confirmed by neutron and synchrotron X-ray diffraction data refinement supports unit cell expansion due to oxygen vacancies.
| Atom | Wyckoff site | Coordinates | Site occupancy factor (SOF) | U eq., Å2 | ||
|---|---|---|---|---|---|---|
| x/a | y/b | z/c | ||||
| a Space group: C2/c, a = 7.7014(1) Å, b = 8.03305(4) Å, c = 10.1166(2) Å, β = 110.2794(3)°, V = 587.079(8) Å3, Rw = 9.36%, Rp = 7.58%, and G.O.F = 3.52. | ||||||
| Cu | 8f | 0.30950(7) | 0.92687(6) | 0.51372(6) | 1 | 0.0096(1) |
| V | 8f | 0.2753(1) | 0.72239(9) | 0.21290(8) | 1 | 0.0047(2) |
| O1 | 4e | 1/2 | 0.6369(3) | 1/4 | 0.999(4) | 0.0254(7) |
| O2 | 8f | 0.2666(2) | 0.9027(2) | 0.1336(2) | 0.951(3) | 0.0171(5) |
| O3 | 8f | 0.1221(2) | 0.5893(2) | 0.1041(2) | 0.950(3) | 0.0102(4) |
| O4 | 8f | 0.2364(2) | 0.7522(2) | 0.3708(2) | 0.934(3) | 0.0067(3) |
The composition calculated based on the total oxygen content obtained from the Rietveld refinement is Cu2V2O6.69(2) (Table 2), which is consistent with Cu2V2O6.74, calculated using the Cu+ and Cu2+ ratios from the XPS result and assuming charge balance.
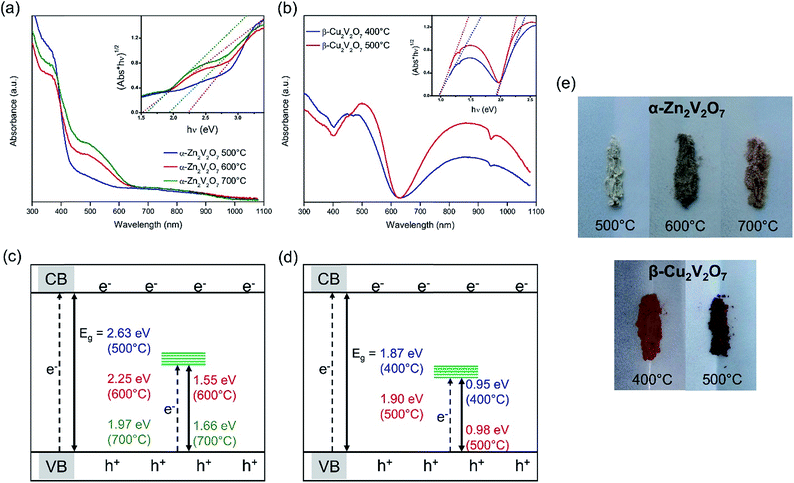
To study the effect of oxygen vacancies and mixed oxidation states of metal centers on the electronic structure, the optical properties of α-Zn2V2O7 and β-Cu2V2O7 samples were evaluated from diffuse reflectance UV-vis absorption spectroscopy (Fig. 9). A red shift of the main absorption edge in α-Zn2V2O7 was observed as the annealing temperature increases: 443.5 nm for 500 °C, 471.6 nm for 600 °C, and 500.6 nm for 700 °C. To determine optical indirect band gaps, the data were plotted as (α × hν)1/2vs. hν (Tauc plot), where α is absorbance and hν is the excitation energy in eV. The estimated bandgaps are 2.63(3) eV, 2.25(3) eV, and 1.97(3) eV for 500 °C, 600 °C, and 700 °C, respectively. The bandgap of α-Zn2V2O7 annealed at 500 °C is close to the reported value (2.75 eV),25 but a smaller bandgap was observed for the samples synthesized at 600 °C and 700 °C. This is due to oxygen vacancy related disorder being responsible for band tailing.50 Interestingly, an additional absorption edge at 682.3 nm for the 600 °C annealed sample and 674.7 nm for the 700 °C annealed sample is observed, corresponding to mid-gap states at 1.55 eV and 1.66 eV, respectively. This additional absorption in the visible-light range is attributed to the d-states from the reduced metal centers (V4+) generated to compensate oxygen vacancies. Similar to the band tailing originating from the oxygen defects,50 the mid-gap state position changes with different reaction conditions. This could be due to different mid-gap defect densities of the reduced metal centers affecting the bandwidth of the mid-gap states.
UV-vis diffuse reflectance spectra of β-Cu2V2O7 show the main absorption edge at 615.0 nm and 615.5 nm for the samples synthesized at 400 °C and 500 °C, respectively (Fig. 9). The estimated band gaps of 1.90(3) eV (400 °C) and 1.87(3) eV (500 °C) are smaller than the reported values of 2.20 eV (ref. 52) and 2.22 eV.38 Similar to α-Zn2V2O7, there is an additional absorption edge at a higher wavelength: 1166.2 nm for the 400 °C sample and 1150.5 nm for the 500 °C sample, corresponding to mid-gap states at 0.95 eV and 0.98 eV, respectively. The additional absorption and the distinct color difference between the 400 °C and 500 °C samples are due to the mid-gap states located in between the valence band and the conduction band contributed by d-states from the reduced metal centers (Cu+). Also, it is observed that the 500 °C sample exhibits higher absorption in the wavelength range from 700 nm to 1100 nm compared to the 400 °C sample, suggesting that a greater amount of oxygen vacancies is present in the 500 °C sample, thus a greater fraction of Cu+, consistent with XPS results.
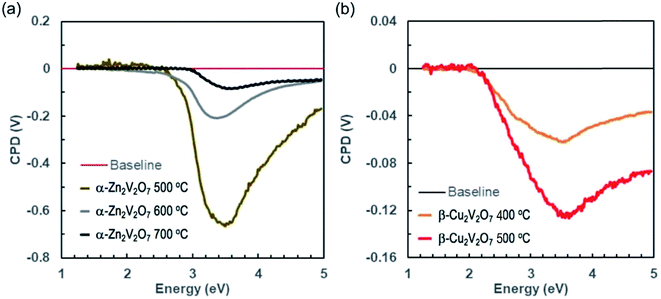
Surface photovoltage spectroscopy (SPS) measurements were conducted to probe the ability of the vanadates to generate and separate photochemical charge carriers. In SPS, the contact potential difference (CPD) of a sample film on top of a conductive substrate is recorded with a contactless Kelvin probe as a function of the incident photon energy (Fig. 10).53–55 The change of the CPD under illumination corresponds to a photovoltage. The sign, onset, and size of this voltage provide information about the majority carrier type, the effective band gap, defects, and the photochemistry of the sample, as detailed in previous studies.54–61 SPS data for the vanadate powders on FTO substrates are shown in Fig. 10. All samples generate a negative photovoltage caused by majority charge carrier injection into the substrate. This confirms that all vanadates are n-type semiconductors. Using the tangent method, the effective bandgaps are estimated from the major photovoltage feature to be 2.85 eV, 2.81 eV, and 2.95 eV for the α-Zn2V2O7 samples annealed at 500 °C, 600 °C and 700 °C, respectively. These onset values exceed the optical bandgaps of these samples, especially at higher annealing temperatures. The 600 °C and 700 °C annealed samples also produce much smaller photovoltages than the α-Zn2V2O7 film annealed at 500 °C. This suggests that the photovoltaic properties of α-Zn2V2O7 are degraded by the higher temperature annealing step. Tentatively, we attribute these observations to electron trapping and/or charge recombination at 1.55 eV and 1.66 eV mid gap states of V4+ that are seen in the optical spectra of the 600 °C and 700 °C annealed samples. Trap states near the absorber mid gap energy are known to be particularly effective for recombination because they are equally accessible to electrons and holes.62–64 The SPS data for copper vanadates on FTO (Fig. 10b) resemble those of zinc vanadates; however, the effective band gap of 2.12 eV for both samples agrees relatively well with the optical band gaps. But again, the photovoltage values achieved with the 400 °C and 500 °C annealed copper vanadates (−0.06 V and −0.12 V at 3.6 eV) are much smaller than that for the 500 °C annealed α-Zn2V2O7. The photovoltage appears to be limited by electron trapping and/or recombination at the 0.95 eV Cu+ mid gap state. This behavior is analogous to CuWO4, whose photocatalytic properties are also diminished by electron trapping at the 1.8 eV Cu2+ mid gap-state.65 Cathodic photocorrosion via electron trapping at copper d states is a general property of copper containing metal oxides.66–68
Conclusion
Ternary metal oxides M2V2O7−δ (M = Zn and Cu) were synthesized using a deep eutectic solvent (DES): a urea![[thin space (1/6-em)]](https://www.rsc.org/images/entities/char_2009.gif) :
:![[thin space (1/6-em)]](https://www.rsc.org/images/entities/char_2009.gif) choline chloride mixture. Based on thermal stability of the products, their syntheses were optimized. We have shown for the first time the presence of oxygen vacancies and reduced oxidation states of metal ions in ternary metal oxides synthesized by this route. The mixed-valence oxidation states of vanadium (V4+vs. V5+) in α-Zn2V2O7−n and copper (Cu+vs. Cu2+) in β-Cu2V2O7−m corroborate partial reduction of the metal ions needed for charge compensation due to the oxygen vacancies. Further investigation of oxygen deficiencies in β-Cu2V2O7−m by neutron powder diffraction reveals that the oxygen site coordinated to two copper metal centers possesses a significant number of oxygen vacancies. By simply changing the annealing temperature of metal precursors in the DES, various concentrations of oxygen vacancies are achieved, thereby tuning the electronic structure of metal oxides. A high concentration of oxygen vacancies in M2V2O7−δ (M = Zn and Cu) leads to narrowed band gaps and it generates mid-gap states of reduced metal centers in between the valence band and conduction band. Surface photovoltage spectroscopy shows that the mid-gap states reduce the photovoltage of the materials, indicating that Cu+ and V4+ ions can serve as electron/hole trap and recombination sites. This limits solar energy conversion applications of the vanadates. Most importantly, the results demonstrate the potential of deep eutectic solvents for the synthesis of semiconducting metal oxides containing oxygen vacancies.
choline chloride mixture. Based on thermal stability of the products, their syntheses were optimized. We have shown for the first time the presence of oxygen vacancies and reduced oxidation states of metal ions in ternary metal oxides synthesized by this route. The mixed-valence oxidation states of vanadium (V4+vs. V5+) in α-Zn2V2O7−n and copper (Cu+vs. Cu2+) in β-Cu2V2O7−m corroborate partial reduction of the metal ions needed for charge compensation due to the oxygen vacancies. Further investigation of oxygen deficiencies in β-Cu2V2O7−m by neutron powder diffraction reveals that the oxygen site coordinated to two copper metal centers possesses a significant number of oxygen vacancies. By simply changing the annealing temperature of metal precursors in the DES, various concentrations of oxygen vacancies are achieved, thereby tuning the electronic structure of metal oxides. A high concentration of oxygen vacancies in M2V2O7−δ (M = Zn and Cu) leads to narrowed band gaps and it generates mid-gap states of reduced metal centers in between the valence band and conduction band. Surface photovoltage spectroscopy shows that the mid-gap states reduce the photovoltage of the materials, indicating that Cu+ and V4+ ions can serve as electron/hole trap and recombination sites. This limits solar energy conversion applications of the vanadates. Most importantly, the results demonstrate the potential of deep eutectic solvents for the synthesis of semiconducting metal oxides containing oxygen vacancies.
Conflicts of interest
There are no conflicts to declare.Acknowledgements
We thank Dr Kirill Kovnir (Department of Chemistry, Iowa State University and Ames Laboratory) for the access to the PXRD diffractometer; Dr Javier Vela (Department of Chemistry, Iowa State University and Ames Laboratory) for the access to the UV-vis spectrometer; Dr Warren Straszheim (Materials Analysis Research Laboratory, Iowa State University) and Tori Cox (Iowa State University) for the help with SEM/EDS data acquisition; Dr Dapeng Jing (Materials Analysis Research Laboratory, Iowa State University) for the help with XPS measurements; Steve Veysey (Chemical Instrumentation Facility, Iowa State University) for the help with DSC/TGA measurements; Dr Ashfia Huq (Oak Ridge National Laboratory) for neutron diffraction data collection; and Dr Wenqian Xu and Dr Andrey Yakovenko at 17-BM beamline, APS ANL, and Colin Harmer at Iowa State University for assistance in HT PXRD. The POWGEN beamline at the Spallation Neutron Source, Oak Ridge National Laboratory is sponsored by the Scientific User Facilities Division, Office of Basic Energy Sciences, U.S. Department of Energy. Use of the Advanced Photon Source at Argonne National Laboratory was supported by the U.S. Department of Energy, Office of Science, Office of Basic Energy Sciences, under Contract No. DE-AC02-06CH11357. Support for surface photovoltage spectroscopy measurements was provided by the U.S. Department of Energy, Office of Science, Office of Basic Energy Sciences under Award Number DOE-SC0015329.References
- A. Fujishima and K. Honda, Electrochemical Photolysis of Water at a Semiconductor Electrode, Nature, 1972, 238, 37–38 CrossRef CAS PubMed.
- K. Sayama and H. Arakawa, Photocatalytic decomposition of water and photocatalytic reduction of carbon dioxide over zirconia catalyst, J. Phys. Chem., 1993, 97, 531–533 CrossRef CAS.
- K. Sayama and H. Arakawa, Effect of Na2CO3 addition on photocatalytic decomposition of liquid water over various semiconductor catalysis, J. Photochem. Photobiol., A, 1994, 77, 243–247 CrossRef CAS.
- K. Sayama and H. Arakawa, Effect of carbonate addition on the photocatalytic decomposition of liquid water over a ZrO2 catalyst, J. Photochem. Photobiol., A, 1996, 94, 67–76 CrossRef CAS.
- V. R. Reddy, D. W. Hwang and J. S. Lee, Photocatalytic Water Splitting over ZrO2 Prepared by Precipitation Method, Korean J. Chem. Eng., 2003, 20, 1026–1029 CrossRef CAS.
- J. J. Zou, C. J. Liu and Y. P. Zhang, Control of the Metal–Support Interface of NiO-Loaded Photocatalysts via Cold Plasma Treatment, Langmuir, 2006, 22, 2334–2339 CrossRef CAS PubMed.
- K. Sayama, H. Arakawa and K. Domen, Photocatalytic water splitting on nickel intercalated A4TaxNb6−xO17 (A = K, Rb), Catal. Today, 1996, 28, 175–182 CrossRef CAS.
- H. Kato and A. Kudo, New tantalate photocatalysts for water decomposition into H2 and O2, Chem. Phys. Lett., 1998, 295, 487–492 CrossRef CAS.
- Y. Takahara, J. N. Kondo, T. Takata, D. Lu and K. Domen, Mesoporous Tantalum Oxide. 1. Characterization and Photocatalytic Activity for the Overall Water Decomposition, Chem. Mater., 2001, 13, 1194–1199 CrossRef CAS.
- C. Santato, M. Odziemkowski, M. Ulmann and J. Augustynski, Crystallographically Oriented Mesoporous WO3 Films: Synthesis, Characterization, and Applications, J. Am. Chem. Soc., 2001, 123, 10639–10649 CrossRef CAS PubMed.
- F. E. Osterloh, Inorganic nanostructures for photoelectrochemical and photocatalytic water splitting, Chem. Soc. Rev., 2013, 42, 2294–2320 RSC.
- J. Boltersdorf, I. Sullivan, T. L. Shelton, Z. Wu, M. Gray, B. Zoellner, F. E. Osterloh and P. A. Maggard, Flux Synthesis, Optical and Photocatalytic Properties of n-type Sn2TiO4: Hydrogen and Oxygen Evolution under Visible Light, Chem. Mater., 2016, 28, 8876–8889 CrossRef CAS.
- X. Ma, X. Cui, Z. Zhao, M. A. Melo Jr, E. J. Roberts and F. E. Osterloh, Use of surface photovoltage spectroscopy to probe energy levels and charge carrier dynamics in transition metal (Ni, Cu, Fe, Mn, Rh) doped SrTiO3 photocatalysts for H2 evolution from water, J. Mater. Chem. A, 2018, 6, 5774–5781 RSC.
- Y. Hosogi, Y. Shimodaira, H. Kato, H. Kobayashi and A. Kudo, Role of Sn2+ in the Band Structure of SnM2O6 and Sn2M2O7 (M = Nb and Ta) and Their Photocatalytic Properties, Chem. Mater., 2008, 20, 1299–1307 CrossRef CAS.
- P. Li, Y. Zhou, W. Tu, Q. Liu, S. Yan and Z. Zou, Direct Growth of Fe2V4O13 Nanoribbons on a Stainless-Steel Mesh for Visible-Light Photoreduction of CO2 into Renewable Hydrocarbon Fuel and Degradation of Gaseous Isopropyl Alcohol, ChemPlusChem, 2013, 78, 274–278 CrossRef CAS.
- M. S. Wrighton, A. B. Ellis, P. T. Wolczanski, D. L. Morse, H. B. Abrahamson and D. S. Ginley, Strontium titanate photoelectrodes. Efficient photoassisted electrolysis of water at zero applied potential, J. Am. Chem. Soc., 1976, 98(10), 2774–2779 CrossRef CAS.
- X. Chen, L. Liu, P. Y. Yu and S. S. Mao, Increasing Solar Absorption for Photocatalysis with Black Hydrogenated Titanium Dioxide Nanocrystals, Science, 2011, 331, 746–750 CrossRef CAS PubMed.
- G. Wang, Y. Ling, H. Wang, X. Yang, C. Wang, J. Z. Zhang and Y. Li, Hydrogen-treated WO3 nanoflakes show enhanced photostability, Energy Environ. Sci., 2012, 5, 6180–6187 RSC.
- G. Wang, Y. Ling, X. Lu, F. Qian, Y. Tong, J. Z. Zhang, V. Lordi, C. R. Leao and Y. Li, Computational and Photoelectrochemical Study of Hydrogenated Bismuth Vanadate, J. Phys. Chem. C, 2013, 117, 10957–10964 CrossRef CAS.
- J. A. Seabold and N. R. Neale, All First Row Transition Metal Oxide Photoanode for Water Splitting Based on Cu3V2O8, Chem. Mater., 2015, 27, 1005–1013 CrossRef CAS.
- W. Guo, W. D. Chemelewski, O. Mabayoje, P. Xiao, Y. Zhang and C. B. Mullins, Synthesis and Characterization of CuV2O6 and Cu2V2O7: Two Photoanode Candidates for Photoelectrochemical Water Oxidation, J. Phys. Chem. C, 2015, 119, 27220–27227 CrossRef CAS.
- L. Zhou, Q. Yan, A. Shinde, D. Guevarra, P. F. Newhouse, N. Becerra-Stasiewicz, S. M. Chatman, J. A. Haber, J. B. Neaton and J. M. Gregoire, High Throughput Discovery of Solar Fuels Photoanodes in the CuO–V2O5 System, Adv. Energy Mater., 2015, 5, 1500968 CrossRef.
- C. M. Jiang, G. Segev, L. H. Hess, G. Liu, G. Zaborski, F. M. Toma, J. K. Cooper and I. D. Sharp, Composition-Dependent Functionality of Copper Vanadate Photoanodes, ACS Appl. Mater. Interfaces, 2018, 10, 10627–10633 CrossRef CAS PubMed.
- C. M. Jiang, M. Farmand, C. H. Wu, Y. S. Liu, J. Guo, W. S. Drisdell, J. K. Cooper and I. D. Sharp, Electronic Structure, Optoelectronic Properties, and Photoelectrochemical Characteristics of γ-Cu3V2O8 Thin Films, Chem. Mater., 2017, 29, 3334–3345 CrossRef CAS.
- Y. Yan, Y. Yu, D. Wu, Y. Yang and Y. Cao, TiO2/vanadate (Sr10V6O25, Ni3V2O8, Zn2V2O7) heterostructured photocatalysts with enhanced photocatalytic activity for photoreduction of CO2 into CH4, Nanoscale, 2016, 8, 949–958 RSC.
- A. P. Abbott, D. Boothby, G. Capper, D. L. Davies and R. K. Rasheed, Deep Eutectic Solvents Formed between Choline Chloride and Carboxylic Acids: Versatile Alternatives to Ionic Liquids, J. Am. Chem. Soc., 2004, 126, 9142–9147 CrossRef CAS PubMed.
- E. L. Smith, A. P. Abbott and K. S. Ryder, Deep Eutectic Solvents (DESs) and Their Applications, Chem. Rev., 2014, 114, 11060–11082 CrossRef CAS PubMed.
- O. Ciocirlan, O. Iulian and O. Croitoru, Effect of Temperature on the Physico-chemical Properties of Three Ionic Liquids Containing Choline Chloride, Rev. Chim., 2010, 61, 721–723 CAS.
- PDF-2 Database Incorporated into PDXL Program Software, Rigaku, 2018 Search PubMed.
- P. J. Chupas, K. W. Chapman, C. Kurtz, J. C. Hanson, P. L. Lee and C. P. Grey, A versatile sample-environment cell for non-ambient X-ray scattering experiments, J. Appl. Crystallogr., 2008, 41, 822–824 CrossRef CAS.
- B. H. Toby and R. B. Von Dreele, GSAS-II: the genesis of a modern open-source all purpose crystallography software package, J. Appl. Crystallogr., 2013, 46, 544–549 CrossRef CAS.
- R. Gopal and C. Calvo, Crystal Structure of α-Zn2V2O7, Can. J. Chem., 1973, 51(7), 1004–1009 CrossRef CAS.
- D. Mercurio Lavaud and B. Frit, Structure cristalline de la variete haute temperature du pyrovanadate de cuivre: Cu2V2O7 beta, C. R. Seances Acad. Sci., Ser. C, 1973, 277, 1101–1104 CAS.
- T. I. Krasnenko, V. G. Zubkov, A. P. Tjutjunnik, L. V. Zolotukhina and E. F. Vasjutinskaja, Crystal structure of beta′ Zn2V2O7, Kristallografiya, 2003, 48, 40–43 CrossRef.
- P. D. Robinson, J. M. Hughes and M. L. Malinconico, Blossite alpha-Cu(2+)2V(5+)2O7, a new fumarolic sublimate from Izalco Volcano, El Salvador, Am. Mineral., 1987, 72, 397–400 CAS.
- X. Meng, K. Ballerat-Busserolles, P. Husson and J. M. Andanson, Impact of water on the melting temperature of urea + choline chloride deep eutectic solvent, New J. Chem., 2016, 40, 4492–4499 RSC.
- A. P. Abbott, G. Capper, D. L. Davies, K. J. McKenzie and S. U. Obi, Solubility of Metal Oxides in Deep Eutectic Solvents Based on Choline Chloride, J. Chem. Eng. Data, 2006, 51, 1280–1282 CrossRef CAS.
- M. K. Hossain, P. Sotelo, H. P. Sarker, M. T. Galante, A. Kormányos, C. Longo, R. T. Macaluso, M. N. Huda, C. Janáky and K. Rajeshwar, Rapid One-Pot Synthesis and Photoelectrochemical Properties of Copper Vanadates, ACS Appl. Energy Mater., 2019, 2, 2837–2847 CrossRef CAS.
- A. Söldner, J. Zach, M. Iwanow, T. Gärtner, M. Schlosser, A. Pfitzner and B. König, Preparation of Magnesium, Cobalt and Nickel Ferrite Nanoparticles from Metal Oxides using Deep Eutectic Solvents, Chem.–Eur. J., 2016, 22, 13108–13113 CrossRef PubMed.
- M. Kurzawa, I. Rychlowska-Himmel, M. Bosacka and A. Blonska-Tabero, Reinvestigation of Phase Equilibria in the V2O5–ZnO System, J. Therm. Anal. Calorim., 2001, 64, 1113–1119 CrossRef CAS.
- B. V. Slobodin and R. F. Samigullina, Thermoanalytical study of the polymorphism and melting behavior of Cu2V2O7, Inorg. Mater., 2010, 46, 236–241 Search PubMed.
- M. C. Biesinger, B. P. Payne, L. W. M. Lau, A. Gerson and R. S. C. Smart, X-ray photoelectron spectroscopic chemical state quantification of mixed nickel metal, oxide and hydroxide systems, Surf. Interface Anal., 2009, 41, 324–332 CrossRef CAS.
- M. C. Biesinger, L. W. M. Lau, A. R. Gerson and R. S. C. Smart, Resolving surface chemical states in XPS analysis of first row transition metals, oxides and hydroxides: Sc, Ti, V, Cu and Zn, Appl. Surf. Sci., 2010, 257, 887–898 CrossRef CAS.
- Y. Li, Y. Teng, Z. Zhang, Y. Feng, P. Xue, W. Tong and W. Liu, Microwave-assisted synthesis of novel nanostructured Zn3(OH)2V2O7·2H2O and Zn2V2O7 as electrode materials for supercapacitors, New J. Chem., 2017, 41, 15298–15304 RSC.
- M. Kim, B. Joshi, H. Yoon, T. Y. Ohm, K. Kim, S. S. Al-Deyab and S. S. Yoon, Electrosprayed copper hexaoxodivanadate (CuV2O6) and pyrovanadate (Cu2V2O7) photoanodes for efficient solar water splitting, J. Alloys Compd., 2017, 708, 444–450 CrossRef CAS.
- M. Machida, T. Kawada, H. Yamashita and T. Tajiri, Role of Oxygen Vacancies in Catalytic SO3 Decomposition over Cu2V2O7 in Solar Thermochemical Water Splitting Cycles, J. Phys. Chem. C, 2013, 117, 26710–26715 CrossRef CAS.
- V. Vibhu, M. R. Suchomel, N. Penin, F. Weill, J.-C. Grenier, J.-M. Bassat and A. Rougier, Structural transformations of the La2−xPrxNiO4+δ system probed by high-resolution synchrotron and neutron powder diffraction, Dalton Trans., 2019, 48, 266–277 RSC.
- T. Broux, C. Prestipino, M. Bahout, S. Paofai, E. Elkaïm, V. Vibhu, J.-C. Grenier, A. Rougier, J.-M. Bassat and O. Hernandez, Structure and reactivity with oxygen of Pr2NiO4+δ: an in situ synchrotron X-ray powder diffraction study, Dalton Trans., 2016, 45, 3024–3033 RSC.
- S. Dutta, M. Chakrabarti, S. Chattopadhyay and D. Jana, Defect dynamics in annealed ZnO by positron annihilation spectroscopy, J. Appl. Phys., 2005, 98, 053513 CrossRef.
- S. Dutta, S. Chattopadhyay, D. Jana, A. Banerjee, S. Manik, S. K. Pradhan, M. Sutradhar and A. Sarkar, Annealing effect on nano-ZnO powder studied from positron lifetime and optical absorption spectroscopy, J. Appl. Phys., 2006, 100, 114328 CrossRef.
- H. Kim, C. M. Gilmore, A. Piqué, J. S. Horwitz, H. Mattoussi, H. Murata, Z. H. Kafafi and D. B. Chrisey, Electrical, optical, and structural properties of indium-tin-oxide thin films for organic light-emitting devices, J. Appl. Phys., 1999, 86, 6451 CrossRef CAS.
- I. Khan and A. Qurashi, Shape Controlled Synthesis of Copper Vanadate Platelet Nanostructures, Their Optical Band Edges, and Solar-Driven Water Splitting Properties, Sci. Rep., 2017, 7, 14370 CrossRef PubMed.
- L. Kronik and Y. Shapira, Surface Photovoltage Phenomena: Theory, Experiment, and Applications, Surf. Sci. Rep., 1999, 37(1–5), 1–206 CrossRef CAS.
- T. Dittrich, S. Fiechter and A. Thomas, Surface photovoltage spectroscopy of carbon nitride powder, Appl. Phys. Lett., 2011, 99(8), 084105 CrossRef.
- D. Gross, I. Mora-Sero, T. Dittrich, A. Belaidi, C. Mauser, A. J. Houtepen, E. Da Como, A. L. Rogach and J. Feldmann, Charge Separation in Type II Tunneling Multi layered Structures of CdTe and CdSe Nanocrystals Directly Proven by Surface Photovoltage Spectroscopy, J. Am. Chem. Soc., 2010, 132(17), 5981–5983 CrossRef CAS PubMed.
- B. A. Nail, J. M. Fields, J. Zhao, J. Wang, M. J. Greaney, R. L. Brutchey and F. E. Osterloh, Nickel Oxide Particles Catalyze Photochemical Hydrogen Evolution from Water—Nanoscaling Promotes P-Type Character and Minority Carrier Extraction, ACS Nano, 2015, 9(5), 5135–5142 CrossRef CAS PubMed.
- Y. Yang, J. Wang, J. Zhao, B. A. Nail, X. Yuan, Y. Guo and F. E. Osterloh, Photochemical Charge Separation at Particle Interfaces: The n-BiVO4–p-Silicon System, ACS Appl. Mater. Interfaces, 2015, 10(7), 5959–5964 CrossRef PubMed.
- J. Wang, J. Zhao and F. E. Osterloh, Photochemical Charge Transfer Observed in Nanoscale Hydrogen Evolving Photocatalysts Using Surface Photovoltage Spectroscopy, Energy Environ. Sci., 2015, 8, 2970–2976 RSC.
- J. Zhao and F. E. Osterloh, Photochemical Charge Separation in Nanocrystal Photocatalyst Films – Insights from Surface Photovoltage Spectroscopy, J. Phys. Chem. Lett., 2014, 5, 782–786 CrossRef CAS PubMed.
- J. Zhao, B. A. Nail, M. A. Holmes and F. E. Osterloh, Use of Surface Photovoltage Spectroscopy to Measure Built-in Voltage, Space Charge Layer Width, and Effective Band Gap in CdSe Quantum Dot Films, J. Phys. Chem. Lett., 2016, 3335–3340 CrossRef CAS PubMed.
- M. A. Melo, Z. Wu, B. A. Nail, A. T. De Denko, A. F. Nogueira and F. E. Osterloh, Surface Photovoltage Measurements on a Particle Tandem Photocatalyst for Overall Water Splitting, Nano Lett., 2018, 18(2), 805–810 CrossRef CAS PubMed.
- T. Dittrich, Materials concepts for solar cells, Imperial College Press, London, 2015, p. xxxiii, 516 pages Search PubMed.
- J. Nelson, The Physics of Solar Cells, Imperial College Press, London, 2004, p. 363 Search PubMed.
- P. Würfel, Physics of Solar Cells, Wiley-VCH, Weinheim, 2005, p. 244 Search PubMed.
- Z. Wu, Z. Zhao, G. Cheung, R. M. Doughty, A. R. Ballestas-Barrientos, B. Hirmez, R. Han, T. Maschmeyer and F. E. Osterloh, Role of Surface States in Photocatalytic Oxygen Evolution with CuWO4 Particles, J. Electrochem. Soc., 2019, 166(5), H3014–H3019 CrossRef CAS.
- A. Paracchino, N. Mathews, T. Hisatomi, M. Stefik, S. D. Tilley and M. Gratzel, Ultrathin films on copper(I) oxide water splitting photocathodes: a study on performance and stability, Energy Environ. Sci., 2012, 5(9), 8673–8681 RSC.
- G. Sharma, Z. Zhao, P. Sarker, B. A. Nail, J. Wang, M. Huda and F. Osterloh, Electronic structure, photovoltage, and photocatalytic hydrogen evolution with p-CuBi2O4 nanocrystals, J. Mater. Chem. A, 2016, 4, 2936–2942 RSC.
- U. A. Joshi and P. A. Maggard, CuNb3O8: A p-Type Semiconducting Metal Oxide Photoelectrode, J. Phys. Chem. Lett., 2012, 3(11), 1577–1581 CrossRef CAS PubMed.
Footnote |
| † Electronic supplementary information (ESI) available. See DOI: 10.1039/c9ta00957d |
| This journal is © The Royal Society of Chemistry 2019 |

