
 Open Access Article
 This Open Access Article is licensed under a
 Creative Commons Attribution 3.0 Unported Licence
Local Li-ion conductivity changes within Al stabilized Li7La3Zr2O12 and their relationship to three-dimensional variations of the bulk composition†
Stefan
Smetaczek
 *a,
Andreas
Wachter-Welzl
a,
Reinhard
Wagner
b,
Daniel
Rettenwander
cd,
Georg
Amthauer
b,
Lukas
Andrejs
e,
Stefanie
Taibl
a,
Andreas
Limbeck
a and
Jürgen
Fleig
a
*a,
Andreas
Wachter-Welzl
a,
Reinhard
Wagner
b,
Daniel
Rettenwander
cd,
Georg
Amthauer
b,
Lukas
Andrejs
e,
Stefanie
Taibl
a,
Andreas
Limbeck
a and
Jürgen
Fleig
a
aInstitute of Chemical Technologies and Analytics, Technische Universität Wien, Vienna, Austria. E-mail: stefan.smetaczek@tuwien.ac.at
bDepartment of Chemistry and Physics of Materials, University of Salzburg, Salzburg, Austria
cInstitute for Chemistry and Technology of Materials, Graz University of Technology, Graz, Austria
dChristian Doppler Laboratory for Lithium Batteries, Institute for Chemistry and Technology of Materials, Graz University of Technology, Graz, Austria
eAustrian Institute of Technology, Vienna, Austria
First published on 21st February 2019
Abstract
The attractiveness of cubic Li7La3Zr2O12 (LLZO) based garnets lies in their high ionic conductivity and the combination of thermal and electrochemical stability. However, relationships between the exact chemical composition and ionic conductivity are still not well understood and samples of very similar composition and processing may show very different properties. In this contribution, we investigated Al stabilized LLZO by employing a combination of local conductivity measurements and 3D local chemical analysis using laser ablation inductively coupled plasma optical emission spectroscopy (LA-ICP-OES). These measurements revealed significant conductivity variations across some samples, with variations up to almost one order of magnitude, as well as an inhomogeneous elemental distribution of Al and Li, largely along the samples. Surprisingly, neither the local Al content nor the local Li content showed a clear correlation with the local Li-ion conductivity. Accordingly, an in-depth understanding of the conduction properties of Al stabilized LLZO has to concentrate on aspects beyond the simple chemical composition. Yet unknown factors (e.g. oxygen vacancies or local cation site occupancies) seem to have a much higher impact on the ionic conductivity than the exact stoichiometry.
Introduction
Storage and conversion of electrical energy is one of the major topics of current scientific activities. The search for optimized materials is key for technologies such as mobile devices, electric vehicles and load levelling. Li-ion batteries based on organic electrolytes are already widely used, but suffer from safety and stability problems as well as limitations in energy density. Inorganic solid electrolytes are therefore in the focus of today's research. One promising class of ceramic ion conductors for future Li-ion battery systems is based on cubic Li7La3Zr2O12 (LLZO), stabilized at room temperature by substitution of aliovalent ions.1–4 Numerous doping elements were tested, including Al, Ga, Ta, Nb, Mo and Fe and conductivities in the range of 10−4 to 10−3 S cm−1 have been achieved so far.5–19A lot of recent research has focused on LLZO and knowledge became available on the ideal synthesis route, effects of water, degradation phenomena, maximizing ionic conductivity, conduction paths, etc.20–40 However, many aspects are still not understood and several challenges remain. The instability of LLZO in an ambient atmosphere (due to moisture and CO2) as well as interfacial issues could hamper the application of LLZO in all-solid-state batteries.41,42 Also resource criticality should be kept in mind, e.g. of La, particularly in the case of large-scale LLZO production.43
Another important aspect that needs clarification is the partly very different ionic conductivity reported for nominally identical samples. In addition to interfacial effects on the local or effective conductivity of samples, also strongly scattering bulk conductivities are reported. For LLZO stabilized by Al, which was the first element found to stabilize the cubic phase at room temperature,44,45 published values for bulk conductivity cover essentially the entire range from 10−4 S cm−1 to 10−3 S cm−1, whereby overall effective conductivities are often lower than the bulk value.46–49 A recent study on 44 nominally identical samples revealed conductivities from about 10−5 S cm−1 to 0.8 × 10⁻³ S cm−1 for LLZO with 0.2 Al per formula unit (pfu).46 Conductivity variations thus cannot be attributed only to the different preparation routes and degradation effects and must be caused by another (yet unknown) parameter. One likely reason is unintended composition changes during LLZO synthesis,46 which usually involves high temperatures at which lithium oxide loss and associated diffusion processes are to be expected. Investigating the impact of compositional variations and correlating them with the observed conductivity fluctuations is therefore crucial for understanding the conductivity behaviour of LLZO.
Possible effects of local compositional variations beyond the surface region (i.e. in depths of several μm) were already investigated by laser-induced breakdown spectroscopy (LIBS) and even 3D elemental maps of LLZO ceramics became accessible.29,33–35 However, they were not correlated with local conductivities, rather the focus was on the impact of the composition on the overall interfacial resistances of the samples.29,33
In our study, bulk compositional variations within Al stabilized LLZO ceramics are investigated as a possible reason behind the scatter of bulk conductivity values. The relationship between the local bulk ionic conductivity and the corresponding local bulk composition is investigated by combining microelectrode impedance spectroscopy with laser ablation (LA) inductively coupled plasma (ICP) optical emission spectroscopy (OES). Impedance spectroscopic studies on circular microelectrodes with diameters of 100 μm revealed the bulk conductivity of a similarly sized region beneath.50–54 Afterwards, in several depths beneath the electrodes (up to 100 μm deep) the chemical composition was analyzed by LA-ICP-OES. These measurements enabled the analysis of correlations between local Al or Li content and local ionic conductivity. In contrast to many common interpretations of ion conduction in LLZO, neither the Al nor the Li content shows a simple correlation with the ionic conductivity. Thus, further local structural or compositional factors have to play a key role in the ionic conductivity of LLZO.
Experimental
Sample preparation
Four nominally identical samples (A, B, C, D) with an intended composition of Li6.40Al0.20La3Zr2O12 were investigated. The synthesis route is based on the procedure described by Wagner et al.55 Li2CO3 (99%, Merck), Al2O3 (99.5%, Aldrich), La2O3 (99.99% Roth) and ZrO2 (99.0% Roth) were weighed to reach the intended stoichiometry with an excess of 10 wt% Li2CO3, with respect to the stoichiometric amount of Li2CO3. The reagents were ground and mixed in an agate mortar under the addition of isopropyl alcohol and then pressed into pellets. The pellets were heated to 850 °C at a rate of 5 °C min−1 and calcined for 4 h. After cooling down, the pellets were again ground in an agate mortar and ball-milled for 1 h in isopropyl alcohol (FRITSCH Pulverisette 7, 800 rpm, 2 mm ZrO2 balls). After drying, the powder was pressed into pellets and put into an alumina crucible. To avoid undesired incorporation of Al3+ from the crucible and to suppress evaporation of Li2O from the material, the sample pellets were placed between two additional pellets of pure Li7La3Zr2O12. The final sintering step was performed at 1230 °C for 6 h in ambient air.X-ray diffraction (XRD)
Phase analysis was achieved by conducting XRD experiments on a Panalytical X'Pert MPD with Cu Kα radiation. The pattern was analyzed with HighScore, a program provided by Panalytical. A 2θ scan range from 5° to 120° with a step size of 0.026° was used.Electrochemical impedance spectroscopy (EIS)
The ionic conductivity was measured by EIS. To measure the effective conductivity of macroscopic specimens (macroelectrode measurements), samples were polished by SiC grinding paper (#4000) to remove near surface reaction layers, and thin films of Pt (200 nm) and Ti (10 nm) were deposited on the top and bottom sides as electrodes. A thin film of titanium is required in order to improve the adhesion of platinum. For the EIS measurements, a Novocontrol Alpha Analyzer was used in the frequency range of 10 Hz to 3 or 10 MHz. In such macroelectrode measurements the temperature was controlled using a Julabo F-25 HE thermostat, and the exact temperature was 25.4 °C, determined by a thermocouple at the sample.Local conductivities were measured by means of microelectrodes. Using photolithographic techniques in combination with ion beam etching, circular electrodes with diameters of 100 μm were prepared from the macroscopic Pt/Ti thin films on top of the samples. Microelectrode measurements were performed at ambient temperature (T = 23.5 °C). Tungsten needles were used to contact the microelectrodes under an optical microscope. The position of the needles was adjusted using mechanically controlled micromanipulators. Fig. 1a illustrates the measurement setup and Fig. 1b shows a part of the microelectrode array on top of the sample. Impedance spectroscopic measurements (Novocontrol Alpha Analyzer) were then performed between a microelectrode and a counter electrode on the bottom side (Pt thin film with Pt paste at the sample edges for contact reasons).
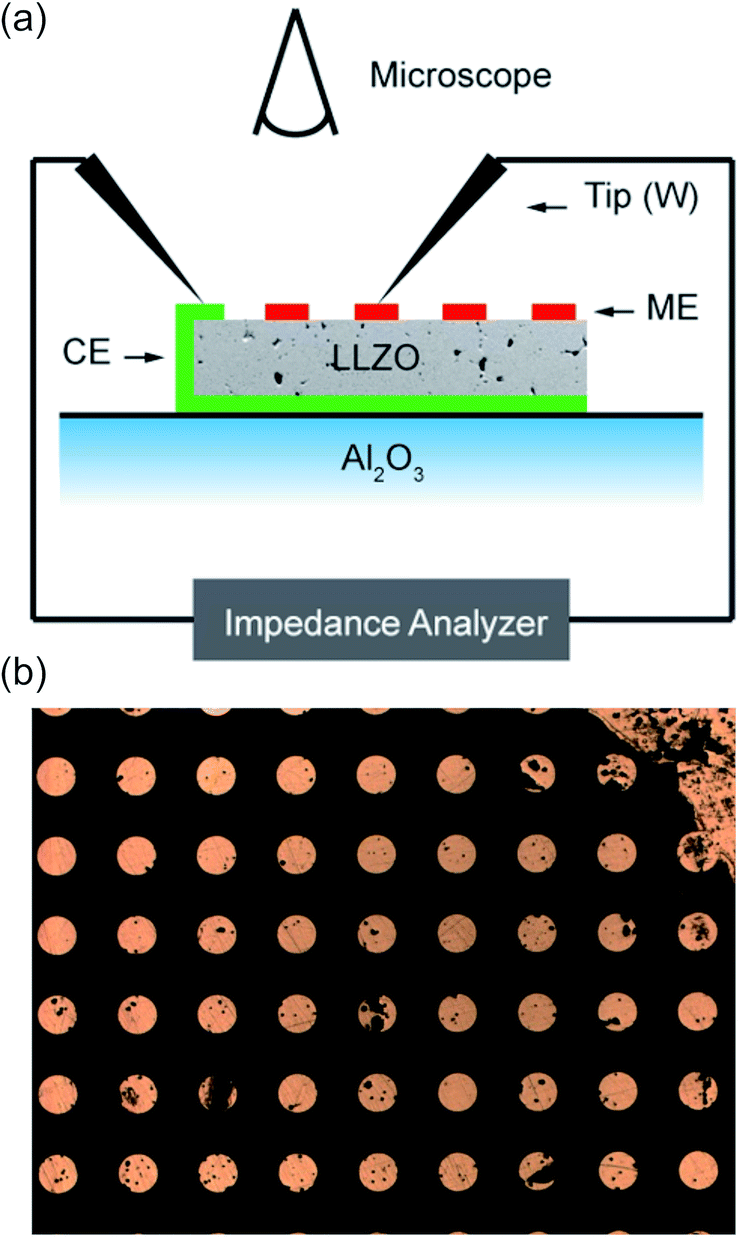 | ||
| Fig. 1 (a) A scheme of the microelectrode measurement setup. (b) The optical microscope image shows a part of the microelectrode array on top of a sample. | ||
LA-ICP-OES
Spatially resolved chemical analysis of the samples was performed using laser ablation (LA) inductively coupled plasma (ICP) optical emission spectroscopy (OES), a direct elemental analysis technique that is suitable for the characterization of various advanced materials including ceramics.56 In LA-ICP-OES, a short-pulsed, high-power laser is focused onto the sample surface, leading to the ablation of a finite volume of the material. A solid aerosol is formed, which is transported by a carrier gas stream into a conventional ICP-OES, where characteristic emission is generated and used for elemental analysis. By focusing the laser on different positions on the sample surface, lateral resolution can be achieved and elemental distribution images can be obtained.All LA-ICP-OES experiments were performed using a NWR213 laser ablation system (ESI) equipped with a frequency quintupled 213 nm Nd:YAG laser and a fast-washout ablation cell. The laser ablation device was coupled to an iCAP 6500 RAD ICP-OES instrument (ThermoFisher Scientific) using PTFE tubing with an inner diameter of 0.4 mm. A plasma torch with a corrosion-resistant ceramic injector tube of 1.5 mm inner diameter was utilized for all experiments. Cell washout was performed using He as the carrier gas, which was mixed with Ar make-up gas upon introduction into the plasma. For data acquisition iTEVA software (v.2.8.0.96) provided by the manufacturer of the instrument was used. The two most sensitive and non-interfering emission lines of Al, La, Li and Zr were measured. For each element, only one emission line was used for signal quantification, the other one was used for quality control of the analysis.
Two-dimensional elemental distribution images of whole LLZO pellets were created using line scan ablation patterns with adjoining lines. For all documented experiments a laser beam diameter of 100 μm and a scan speed of 100 μm s−1 were used, which result in a lateral resolution of 100 μm. In order to remove surface contaminations as well as near-surface segregation phases (e.g. Li2CO3 due to air exposure) a pre-ablation step consisting of a similar line scan pattern with a laser beam diameter of 250 μm was used prior to the measurements. This ablation step removes LLZO (or related phases) of about 2 μm thickness. Using the obtained time-resolved signal intensities, image processing was performed using the software ImageLab (v.2.41, Epina GmbH). Detailed information about the parameters used for the LA-ICP-OES experiments is given in the ESI.†
Compositional analysis was performed in sample depths of ca. 5, 50 and 100 μm. This depth (with respect to the original surface) was reached by mechanical polishing of the surface with SiC grinding paper (#2000) for certain times. In additional calibration studies these polishing times were related to the amount of removed material. Hence, a kind of three-dimensional compositional map became accessible. This approach also ensured that the measured “local” electrical conductivities (averaging over depths between 0 and 200 μm) could be truly related to the bulk composition within this specific sample region.
For signal quantification, matrix-matched standards were prepared by isostatically pressing LLZO powders with different Al contents into pellets. To obtain these powders, sintered LLZO pellets with various Al concentrations were crushed, ground, and homogenized using an agate mortar. To determine their chemical composition, a part of each powder was digested using a borax fusion, dissolved in a HF/HCl/HNO3 mixture, and analyzed by conventional liquid ICP-OES.
Measurement of the pressed LLZO standards was performed directly before sample analysis, using the same instrumental parameters and laser settings. To ensure that the ablated material is representative of the whole pellet, several line scan patterns with adjoining lines were used for each standard. Per standard, four ablation patterns each having an area of about 0.4 mm2 were applied on different positions of the pellet. Each pattern was ablated three times.
For the correction of variations in sample ablation and transport, as well as instrumental drifts, an internal standard-independent normalization technique presented by Liu et al. was adapted for LLZO samples.57 Based on the consideration that the sum of all metal oxides in LLZO adds up to 100 wt%, this approach uses the intensities of all measured elements expressed as the corresponding oxides (Al2O3, Li2O, La2O3, ZrO2) for signal normalization.
The accuracy of the LA-ICP-OES analysis was estimated using the prepared LLZO standards for external validation. For the Al/La, Li/La and Zr/La atomic ratio average relative deviations of 9.1%, 1.2% and 0.8% were obtained, respectively. The comparably high deviation of the Al/La ratio is attributable to the relatively low Al concentration.
More detailed information on the quantification of the described LA-ICP-OES measurements will be published in a separate paper.
Results and discussion
Sample quality
The geometries of the resulting polycrystalline pellets are listed in Table 1. The typical LLZO-grain size is about 100 to 200 μm (Fig. 2). The relative density of the samples, measured using a pycnometer (Brand GmbH), is about 91%. The XRD analysis confirmed the cubic structure of the investigated samples (Fig. 3). Only very minor signals from the second phase were found, particularly lithium oxide in sample A.| Thickness (h) cm | Area (A) cm2 | |
|---|---|---|
| A | 0.41 | 0.34 |
| B | 0.46 | 0.35 |
| C | 0.10 | 0.45 |
| D | 0.21 | 0.39 |
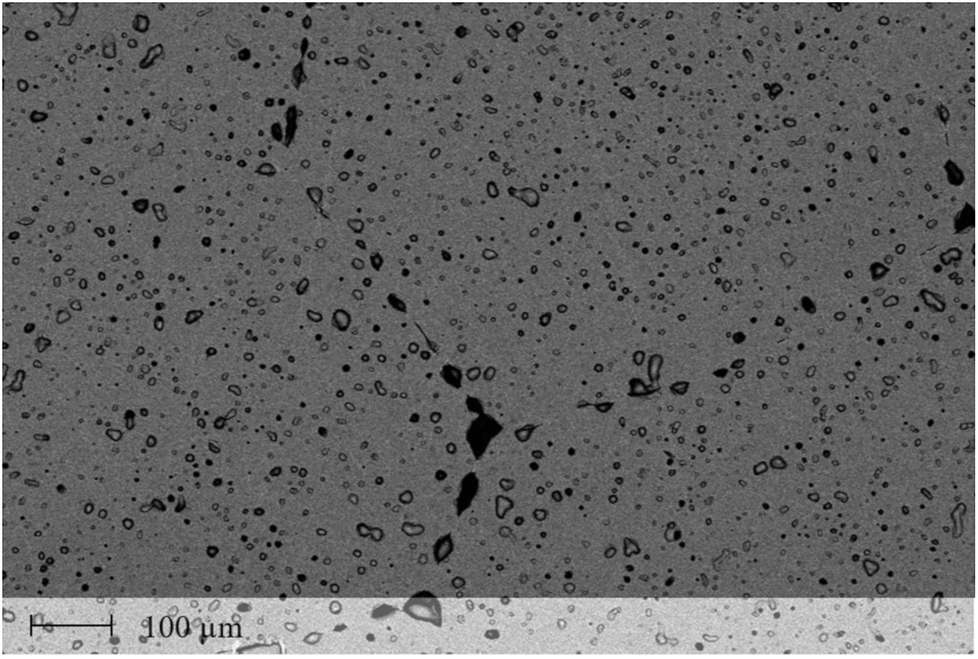 | ||
| Fig. 2 SEM image of an Al stabilized LLZO (Al = 0.20) garnet after sintering at 1230 °C for 6 h. Dark spots indicate the existence of some pores. | ||
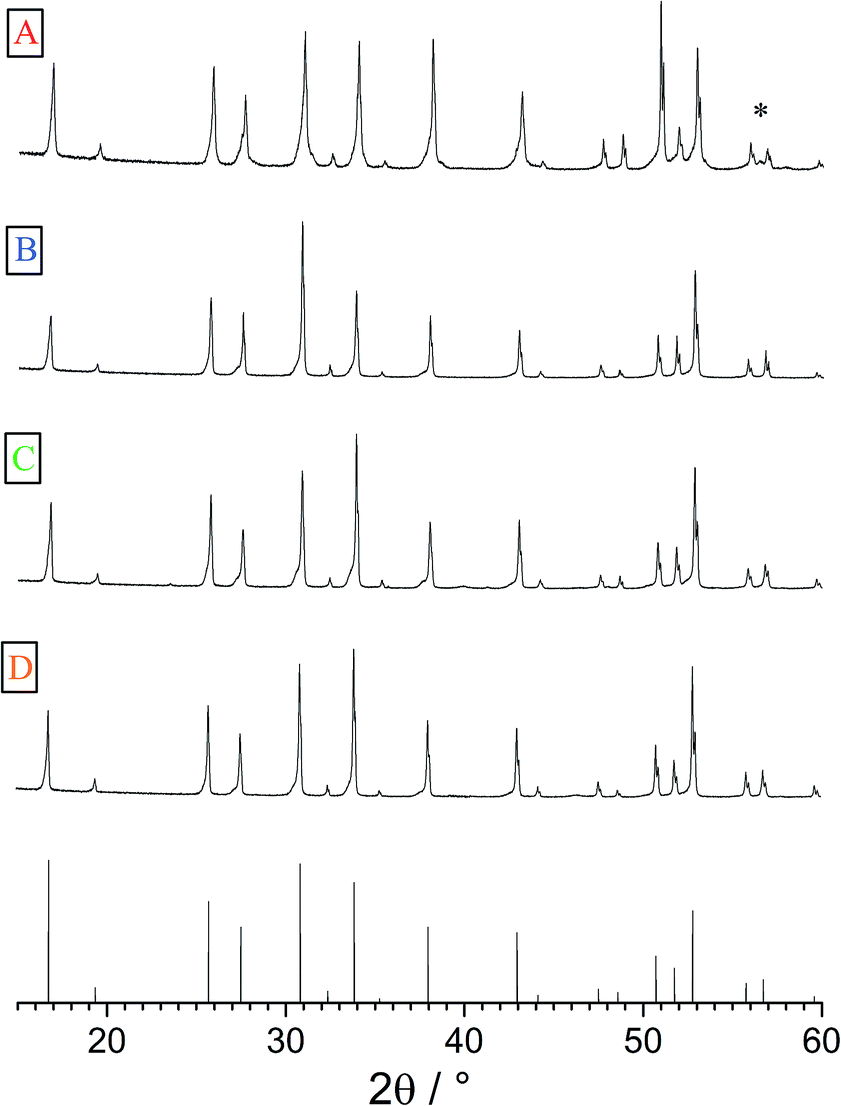 | ||
| Fig. 3 XRPD patterns of samples A–D as well as the cubic reference pattern (bottom). Very little secondary phases could be found, (*) indicates LiO2 in sample A. | ||
Macroelectrode measurements
Before microelectrodes were prepared from the deposited Pt thin film, the very same film was used as a macroscopic electrode to measure the effective conductivity of each sample. The geometry-normalized impedance spectra of all Al stabilized LLZO samples at 25.3 °C are plotted in Fig. 4. They all show a part of a “semicircle” at high frequencies, followed by a well separated low frequency contribution which represents the impedance of the ionically highly resistive electrodes (Ti/Pt). In agreement with earlier studies, we attribute the resistance of the high frequency feature to ion conduction in the bulk.16,18 Neither contributions from grain boundaries nor clear indication of interfacial layers at the electrodes are visible.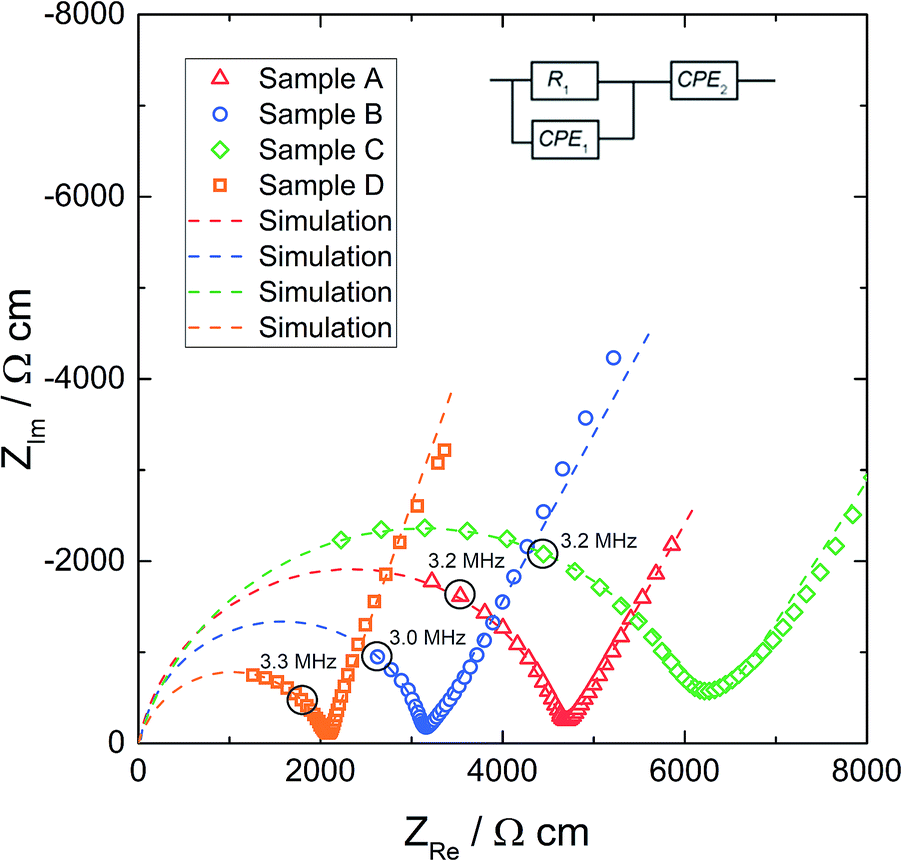 | ||
| Fig. 4 The (geometry-normalized) impedance spectra of the Al stabilized LLZO samples at 25.3 °C with macroelectrode measurement data, after subtracting the inductance due to wiring, and the simulation based on the fit to the equivalent circuit shown in the graph. | ||
To quantify the impedance spectrum properly, a resistor in parallel to a constant phase element (R1‖CPE1) is used for the bulk contribution, in series to a constant phase element CPE2, describing the partially blocking electrode. The impedance of a constant phase element includes the two fit parameters Q and n as well as the angular frequency ω according to ZCPE = Q−1(iω)−n. The inductance due to wiring was subtracted from all impedance data. The equivalent circuit is also shown in Fig. 4 and leads to a reliable fit (dashed line) of the impedance spectra. The fit parameters of the spectra in Fig. 4 are given in Table 2. The resulting relative permittivities (εr), calculated from CPE1 in accordance with ref. 58, are in the range of 45 to 78. Such a value confirms the bulk-type character of this part of the spectrum.
| R 1, Ω | σ macro, mS cm−1 | Q 1, pF sn−1 | n 1 | C 1, pF | ε r | |
|---|---|---|---|---|---|---|
| A | 5608 | 0.21 | 31.8 | 0.88 | 3.82 | 52 |
| B | 4045 | 0.32 | 8.96 | 0.97 | 5.27 | 78 |
| C | 1352 | 0.16 | 336 | 0.83 | 18.0 | 45 |
| D | 1112 | 0.48 | 248 | 0.82 | 11.5 | 70 |
From the resistance R1, the effective bulk conductivity σmacro can be calculated using
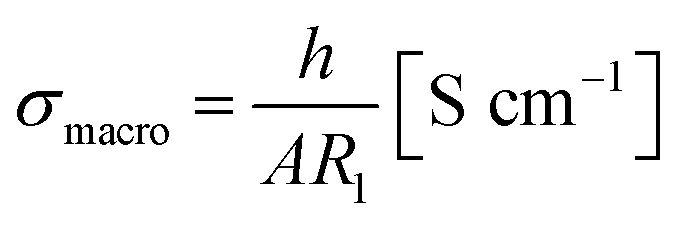 | (1) |
Microelectrode measurements
From measurements with macroscopic electrodes only averaged effective bulk conductivities can be obtained. Microelectrodes, on the other hand, provide a tool to measure spatially resolved conductivities. This becomes possible since most of the voltage between the microelectrode and a spatially extended macroscopic counter electrode drops near to the microelectrode. The resistance measured between a well-defined circular microelectrode of diameter d on top of a typical sample and an extended counter electrode on its bottom side is largely determined by the conductivity of a hemisphere beneath a microelectrode with a radius of about 2d.50 It mainly reflects the charge transport resistance of the probed sample volume and is virtually independent of the sample thickness. From this so-called spreading resistance RSpread, the local ionic conductivity of the probed sample volume σMe can then be calculated from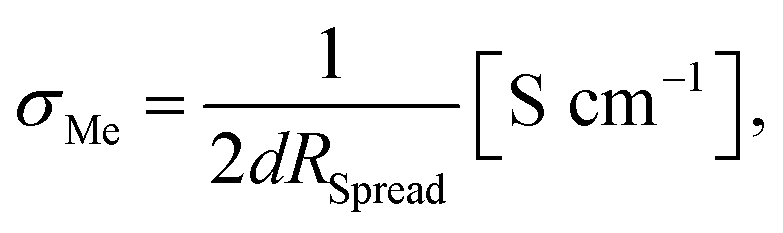 | (2) |
On each sample an array of circular electrodes with a diameter of 100 μm was applied. By subsequently contacting individual microelectrodes and measuring the impedance spectra between a microelectrode and a macroscopic counter electrode we are thus able to resolve local conductivity variations on the length scale of a few 100 μm. However, one has to keep in mind that these microelectrode measurements still average over a certain (small) sample volume.
Fig. 5 displays typical impedance spectra of such microelectrode measurements for all four samples. The impedance spectra are analyzed using the simple equivalent circuit shown in this figure. The resistive element RSpread describes the ionic charge transport in the probed LLZO volume. The serial constant phase element (CPE2) is attributed to the ionically partially blocking electrode material, as for the macroelectrode measurement in Fig. 4. Parallel to these two elements is a stray capacitance (CPE1) with a value in the range of 200 fF. This is caused by the measurement setup, particularly by the capacitance between the contacting needle and the counter electrode. Actually, such a stray capacitance is also present in macroscopic measurements, but there it can be neglected compared to the other capacitances and thus it is not needed in the circuit of Fig. 4. On the other hand, an additional constant phase element in parallel to RSpread, reflecting the very small LLZO bulk capacitance (in the 100 fF range), leads to an over-parameterization of the microelectrode equivalent circuit and was therefore avoided. More details on the appropriateness of this approach to analyze microelectrode measurements on LLZO are given in ref. 66. The obviously less pronounced separation between the electrode spike and bulk arc in microelectrode measurements (cf.Fig. 4 and 5) is simply caused by the additional stray capacitance (CPE1) and the corresponding peak frequency shift of the bulk arc.
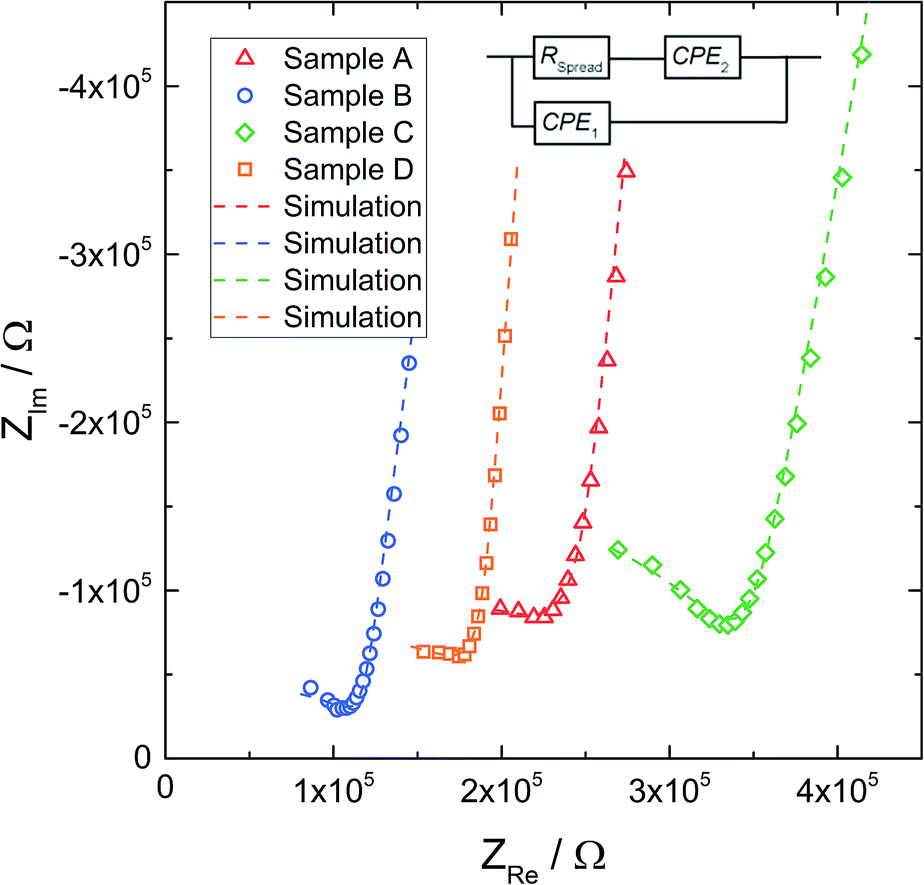 | ||
| Fig. 5 Exemplary impedance spectra obtained with microelectrodes of diameter d = 100 μm, for all samples. The corresponding fits (dashed line) are based on the equivalent circuit shown above. | ||
Local conductivities
Fig. 6a illustrates the location of the microelectrodes on sample A and the corresponding local conductivities beneath the investigated microelectrodes, using a colour map. Light colours (yellow, green) indicate areas with a higher ionic conductivity (above 2.0 × 10⁻⁴ S cm−1 in this specific sample) and cold colours (blue) represent low conductive areas (below 8.0 × 10⁻⁵ S cm−1). In Fig. 6b, measurements of one row of microelectrodes from the left to the right side of the sample, show a gradient in conductivity. Values vary by more than a factor of six, between 4.2 × 10⁻⁵ S cm−1 on the right hand side and 2.8 × 10⁻⁴ S cm−1 on the left hand side. Similar results were obtained for the rows above and beneath the highlighted row.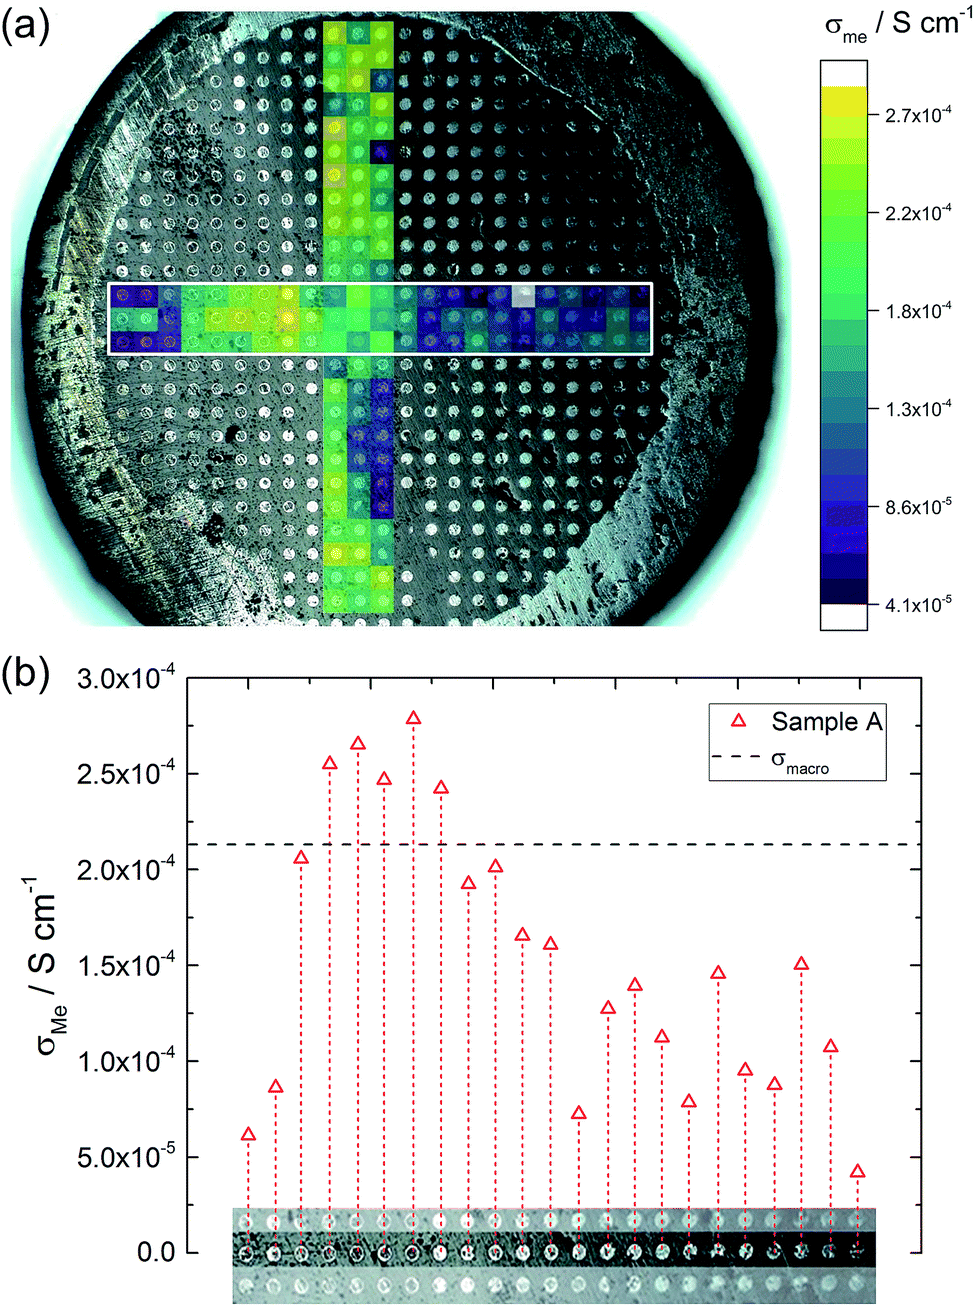 | ||
| Fig. 6 (a) Local conductivities obtained from microelectrode measurements (sample A). Coloured areas mark the investigated region of the sample and indicate the measured conductivity (yellow represents high conductivity, violet low conductivity). (b) The middle row of microelectrodes highlighted by a white rectangle in (a) displays the given change in conductivity from the left side of the sample to the right side. | ||
This demonstrates that parts of the sample exhibit higher conductivities than the effective σmacro (2.1 × 10⁻⁴ S cm−1) while others are less conductive. The corresponding electrical conductivity variation might also be the reason behind the reduced n-value (0.88) of the macroscopic experiment. The existence of a gradient is also in agreement with a previous study, where reducing the size of LLZO samples and repeatedly measuring σmacro also revealed conductivity variations.46 Measurements from top to the bottom of the sample (vertical coloured bar in Fig. 6) indicate further conductivity fluctuations but not such a clear trend as found for the horizontal measurements.
Similar local conductivity measurements were done on sample B (Fig. 7). This sample was covered with differently sized microelectrodes (10 to 300 μm), but for the sake of comparability, only electrodes with a diameter of 100 μm were investigated. On average the local conductivities are even slightly higher than σmacro = 3.2 × 10⁻⁴ S cm−1, but overall little conductivity variations and good agreement with the macro measurements are found. The rather good agreement of microelectrode and macroelectrode experiments in this sample further supports the interpretation of microelectrode measurements measuring bulk related properties. Hence, we assume that the conductivity gradients observed for sample A truly reflect bulk conductivity inhomogeneities. The rather homogeneous conductivity of sample B might also cause the high n-value of the CPE (0.97, see Table 2).
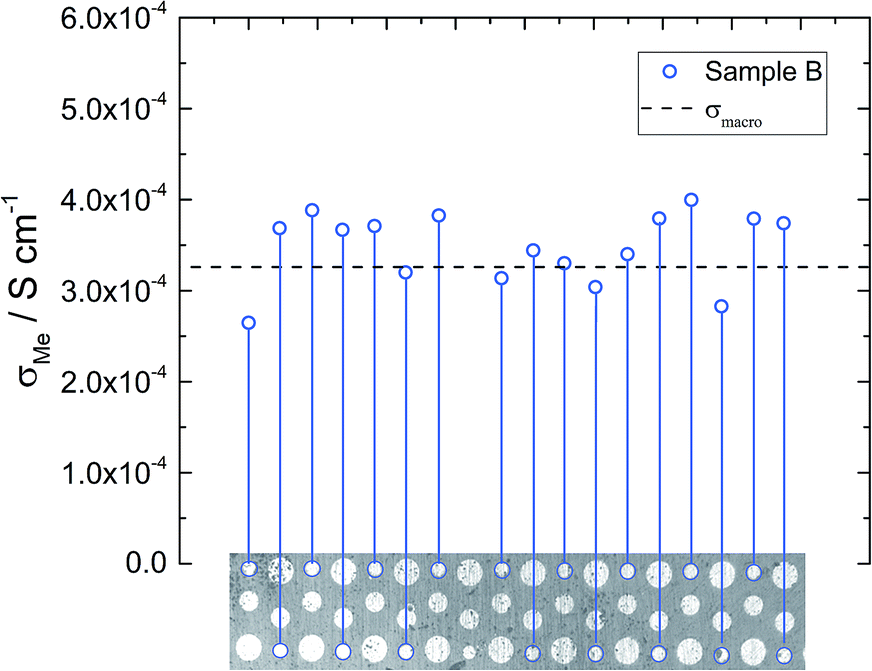 | ||
| Fig. 7 Local conductivity measurements obtained from sample B using 100 μm electrodes. The local conductivity does not show very pronounced variations. | ||
The macroelectrode measurement of sample C revealed a lower effective conductivity compared to samples A and B (1.6 × 10⁻⁴ S cm−1). Microelectrode measurements were performed on both sides of this sample. On side one (Fig. 8 – diamond), measured conductivities are either similar (many spots) or smaller (some spots) than σmacro but did not show any spatial trend. Compared to sample B much more scattering is present. The measurements on side two (Fig. 8 – circles) resulted in very similar conductivities, again some spots were less conductive, the majority, however, was close to the obtained macroelectrode value. Accordingly, we find a very reasonable agreement between the effective macroscopic conductivity (probing the entire depth) and typical local conductivities, probing bulk regions only down to about 200 μm depth. Thus a comparatively low overall ionic conductivity seems to be present across the entire sample and the low σmacro value is not caused by a low conductive layer close to the surface. Such a layer would have strongly affected the local measurements (probing less depth), which is not seen here.
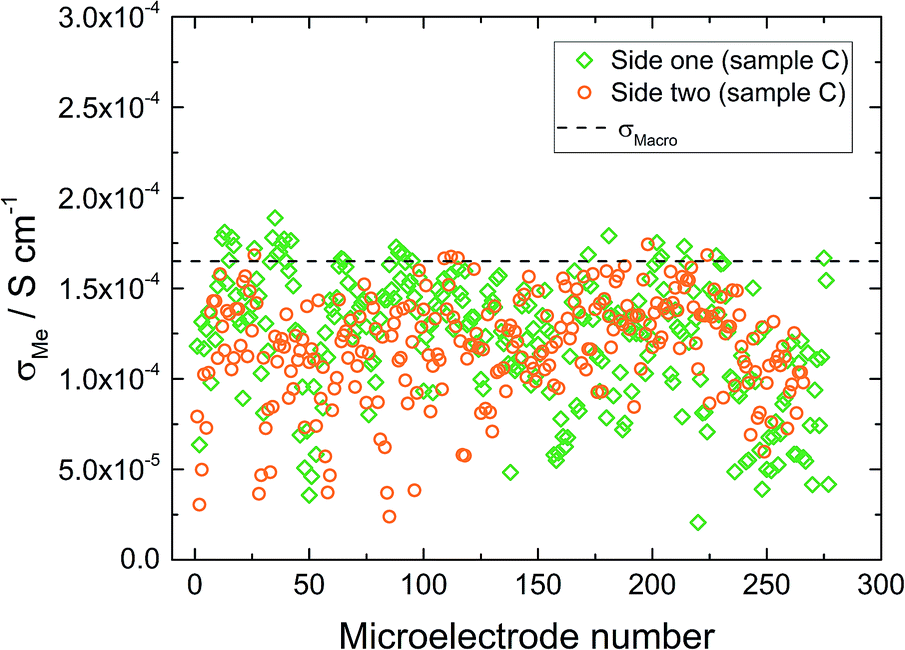 | ||
| Fig. 8 Microelectrode measurements on sample C from side one (diamonds) and side two (circles) of the sample. | ||
Microelectrode measurements on sample D resemble those on sample B with little spatial variation of the local conductivity (not shown). However, the average local conductivity in the investigated sample parts is in the range of 2.0 × 10⁻⁴ S cm−1 and thus smaller than the effective macroscopic conductivity, suggesting that at least some conductivity inhomogeneity is present somewhere in the sample. The latter is also in accordance with the lowest n-value of the CPE (0.82).
LA-ICP-OES analysis
Based on existing ideas on a direct relationship between cation composition (Al or Li content) and conductivity we may expect from the microelectrode measurements that some samples should show significant compositional variations (causing conductivity gradients) while other samples with little lateral conductivity gradients should be chemically rather homogeneous. In order to test this hypothesis we performed a detailed analysis of the local chemical composition using LA-ICP-OES. Large sample regions including those probed by local impedance spectroscopy were examined.In order to investigate the correlation of local conductivity and local composition it is essential to ensure that both local measurements refer to the same sample region. Microelectrode measurements using d = 100 μm probe spatial regions in the same range; as an estimate, often a hemisphere with radius 2d is used as the relevant volume.50 The probed sample volume of LA-ICP-OES measurements strongly depends on the analyzed material, utilized laser and chosen laser settings, however, it is typically significantly smaller than that. While analyzed areas (defined by laser beam size) with a diameter of a few hundred μm lie in the accessible range of commonly used instruments, the probed depth hardly surpasses more than a few μm.
As a first step we have to avoid chemical analysis of near surface layers on LLZO; they are well-known to exhibit different chemical compositions and may include different phases.27,29,33–35 Also Li+/H+ exchange caused by water from the air has been reported and should be taken into account.23,25–27,67 In ref. 27 proton exchanged surface regions with thicknesses between 1 and 2 μm are reported. Effects of such surface regions are avoided by two measures: first, before the first chemical analysis by LA-ICP-OES ca. 5 μm LLZO is mechanically removed by polishing (grinding), see the Experimental. Second, any further reaction products resulting from the contact with ambient air after grinding are removed by a pre-ablation step performed directly before the measurement (ca. 2 μm). Hence, already the very first analysis takes place in a depth of several μm (represented by estimated 5 μm in the following) and thus reflects the bulk composition in this depth rather than any surface effect. However, still the composition in 5 μm depth might differ from the average composition in the ca. 200 μm range probed by the microelectrodes. In ref. 34, for example, chemical composition changes in the first few μm of LLZO ceramics were found and characterized by LIBS. Therefore, by further grinding the LLZO samples, regions in 50 μm and 100 μm depth (with respect to the original surface) were investigated and we could thus obtain a kind of (rudimentary) 3D compositional map of some samples. The results of this depth dependent analysis are discussed in the following.
The result of the local chemical analysis on sample A, obtained by performing LA-ICP-OES in a depth of ca. 5 μm, is shown in Fig. 9 for Al (a), Li (e) and Zr (g). The measurement data are not smoothened, each pixel represents the stoichiometry, calculated based on the measured atomic ratios (choosing 3 pfu La as the fixed-point).
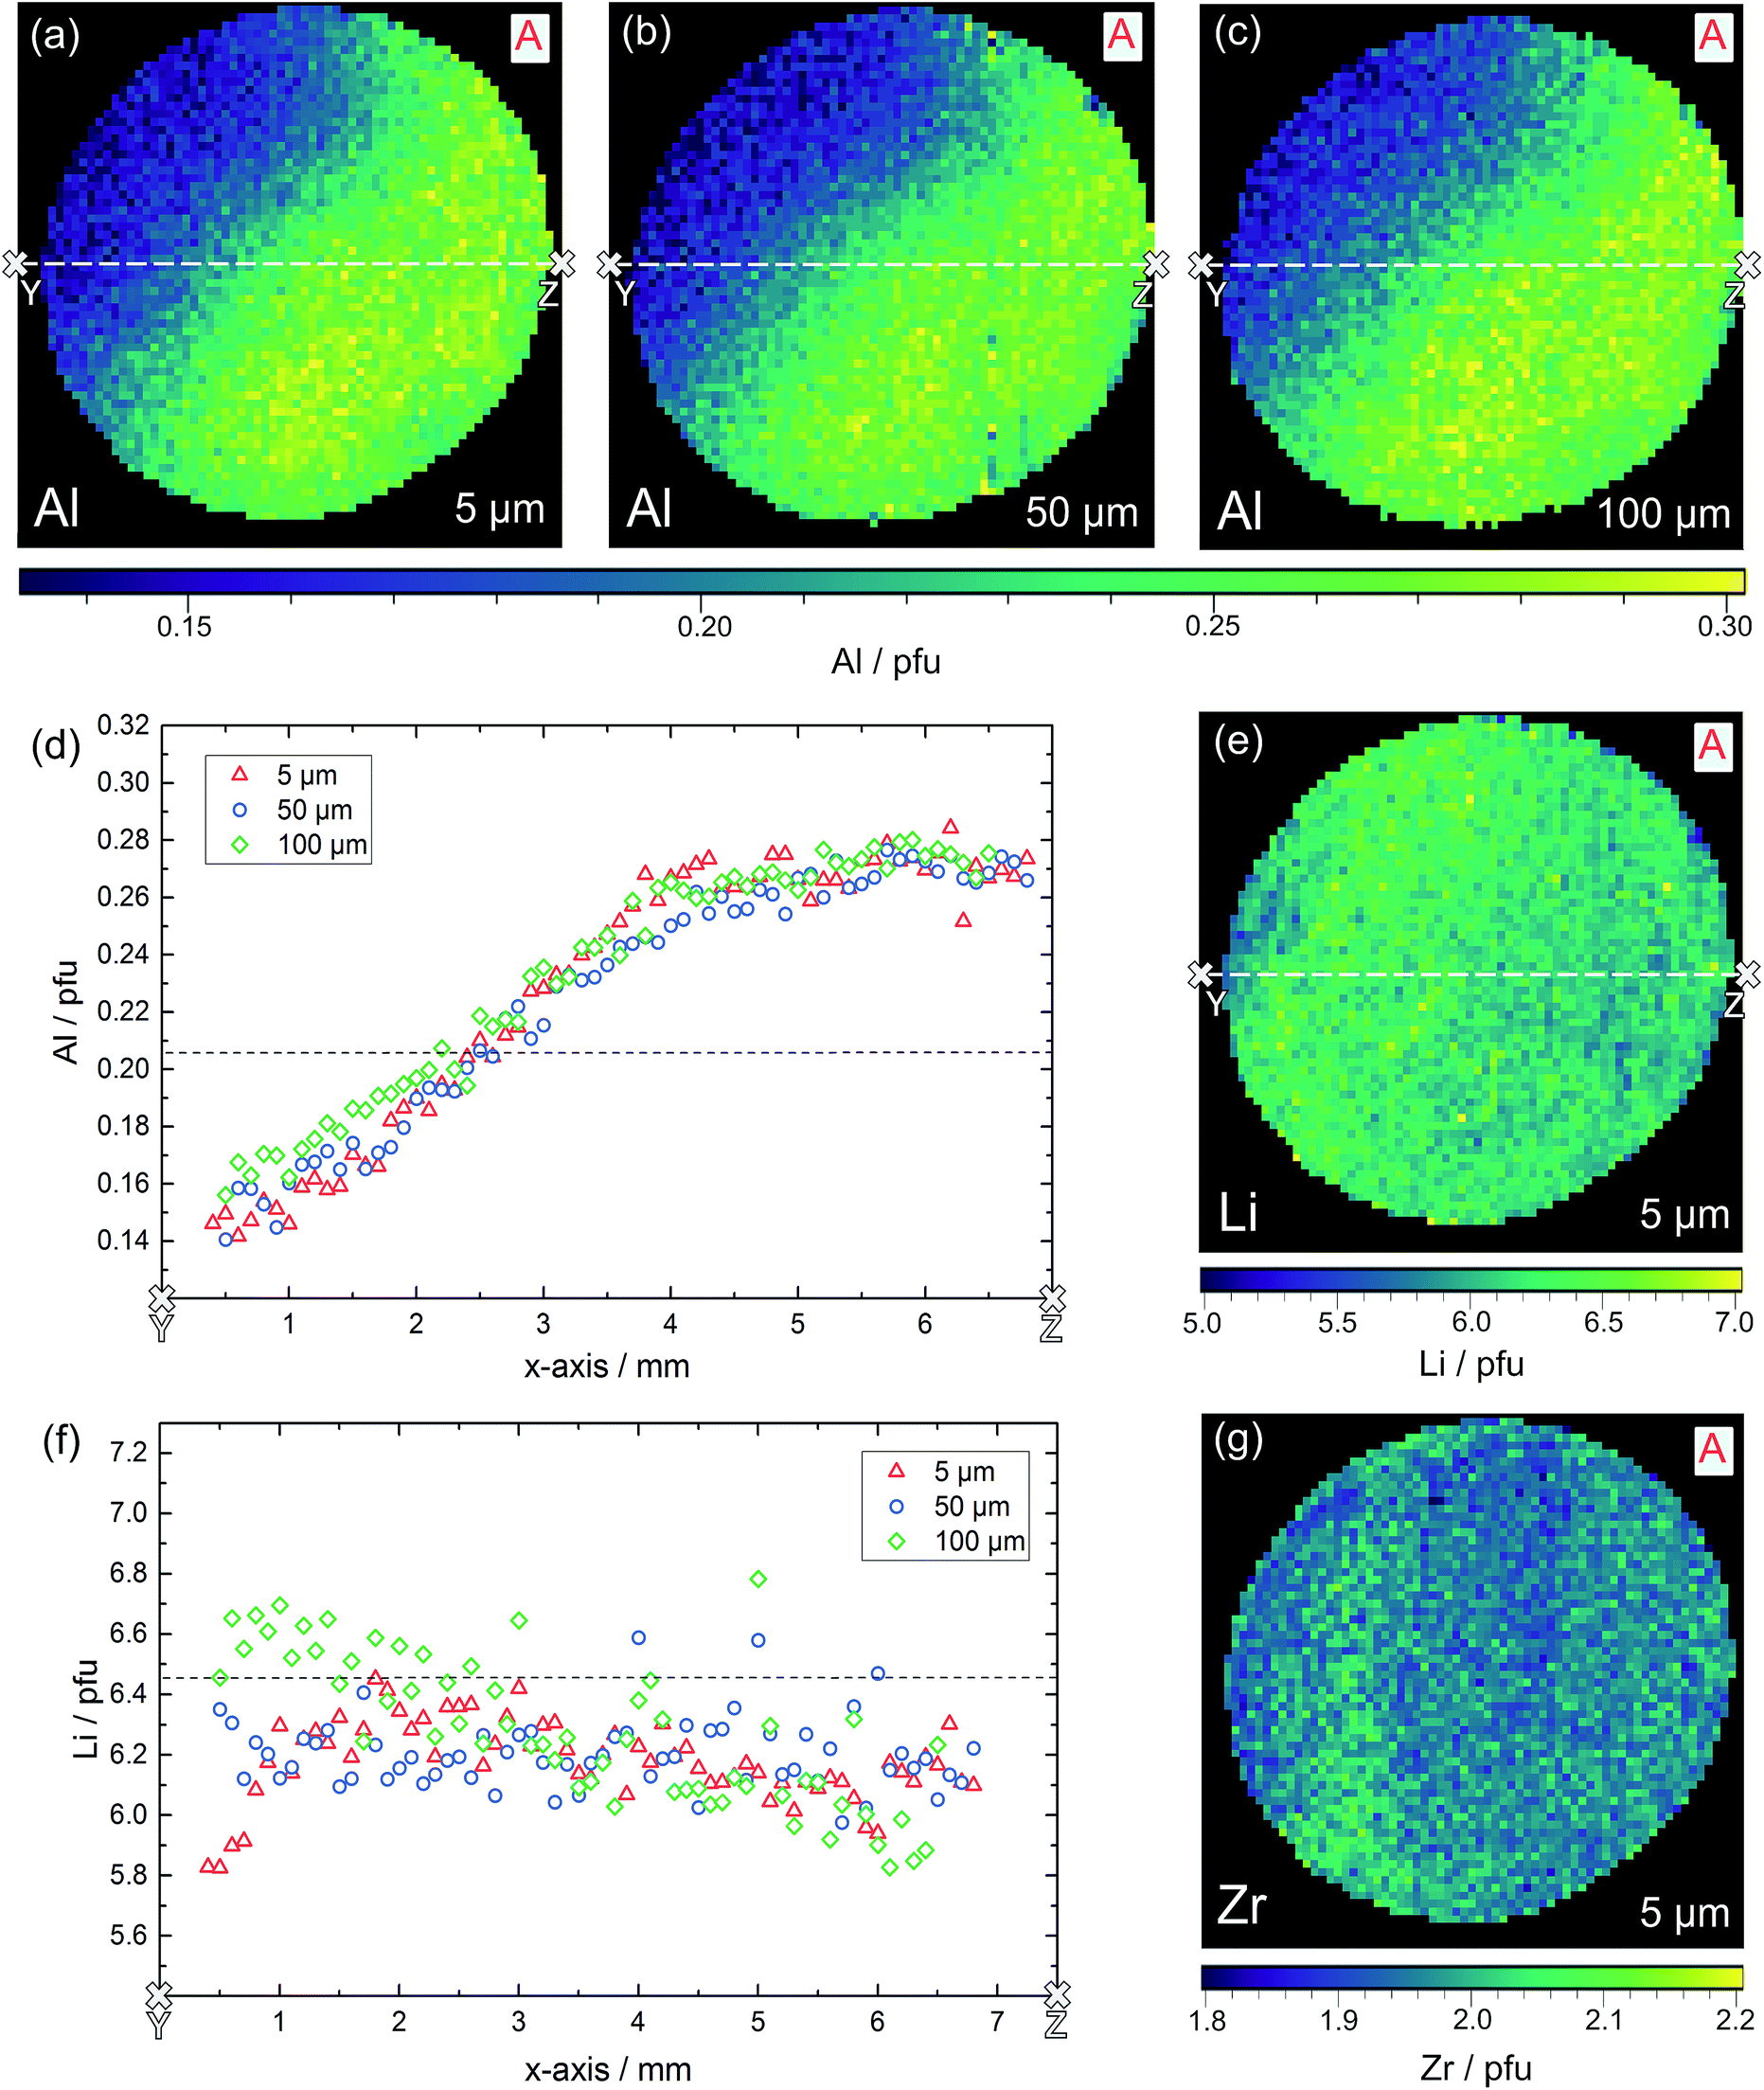 | ||
| Fig. 9 LA-ICP-OES measurements on sample A in three different sample depths. Two-dimensional distribution images of Al (a–c), Li (e) and Zr (g) pfu as well as the lateral changes of the Al (d) and Li (f) content in the cross-section from Y to Z are shown. Dashed lines indicate the nominal value according to Li6.4Al0.2La3Zr2O12. | ||
Most obvious is the gradient in Al content from left top to right bottom, with values varying by about a factor of two from 0.15 pfu to 0.30 pfu. In accordance with the common model of Al reducing the Li content, this is accompanied by a (scattered) Li gradient with the highest Li-content in the Al poor region. The Zr signal shows very little variation and a homogeneous distribution across the sample, as well as good agreement with the theoretical Zr content of 2.0 pfu. A simple explanation for these Al and Li variations cannot be given yet. During sintering one edge of the sample might have been exposed to a lower local lithium oxide activity in the gas phase. Thus, stronger Li loss might have taken place, which in turn might create a driving force for Al diffusion.
The same experiment was repeated in 50 μm and 100 μm depth and the distribution images of Al are also shown in Fig. 9b and c; Li distributions are given in the ESI.† It is very obvious that the Al gradient is also present in this depth thus indicating the absence of strong compositional variation perpendicular to the surface within about 100 μm. This is confirmed quantitatively by comparing the Al and Li content in the cross-sections (white lines) of the three distribution images, see Fig. 9d and f. In these cross-sections, averaging over six neighboring pixels was performed to better reveal overall trends. Clearly the Al stoichiometry variation is present in all depths.
Also samples B, C and D were chemically analyzed by LA-ICP-OES, for D again in three depths, for C in two depths, and B in a depth of 5 μm only. The Al distribution images of all three samples are shown in Fig. 10a–c; further Al and all Li distribution images are shown in the ESI.† First of all, also the measurements in different depths confirmed that the data found for ca. 5 μm depth already correspond to the bulk composition in much deeper regions. Hence, we can conclude that the chemical composition found by our LA-ICP-OES measurements represents the chemical composition of the local region probed by microelectrodes, irrespective of the depth used for analysis. It is thus meaningful to use these data for looking at correlations between local chemical composition and local conductivity, with “local” meaning average values in regions with a size of ca. 100 to 200 μm in each direction.
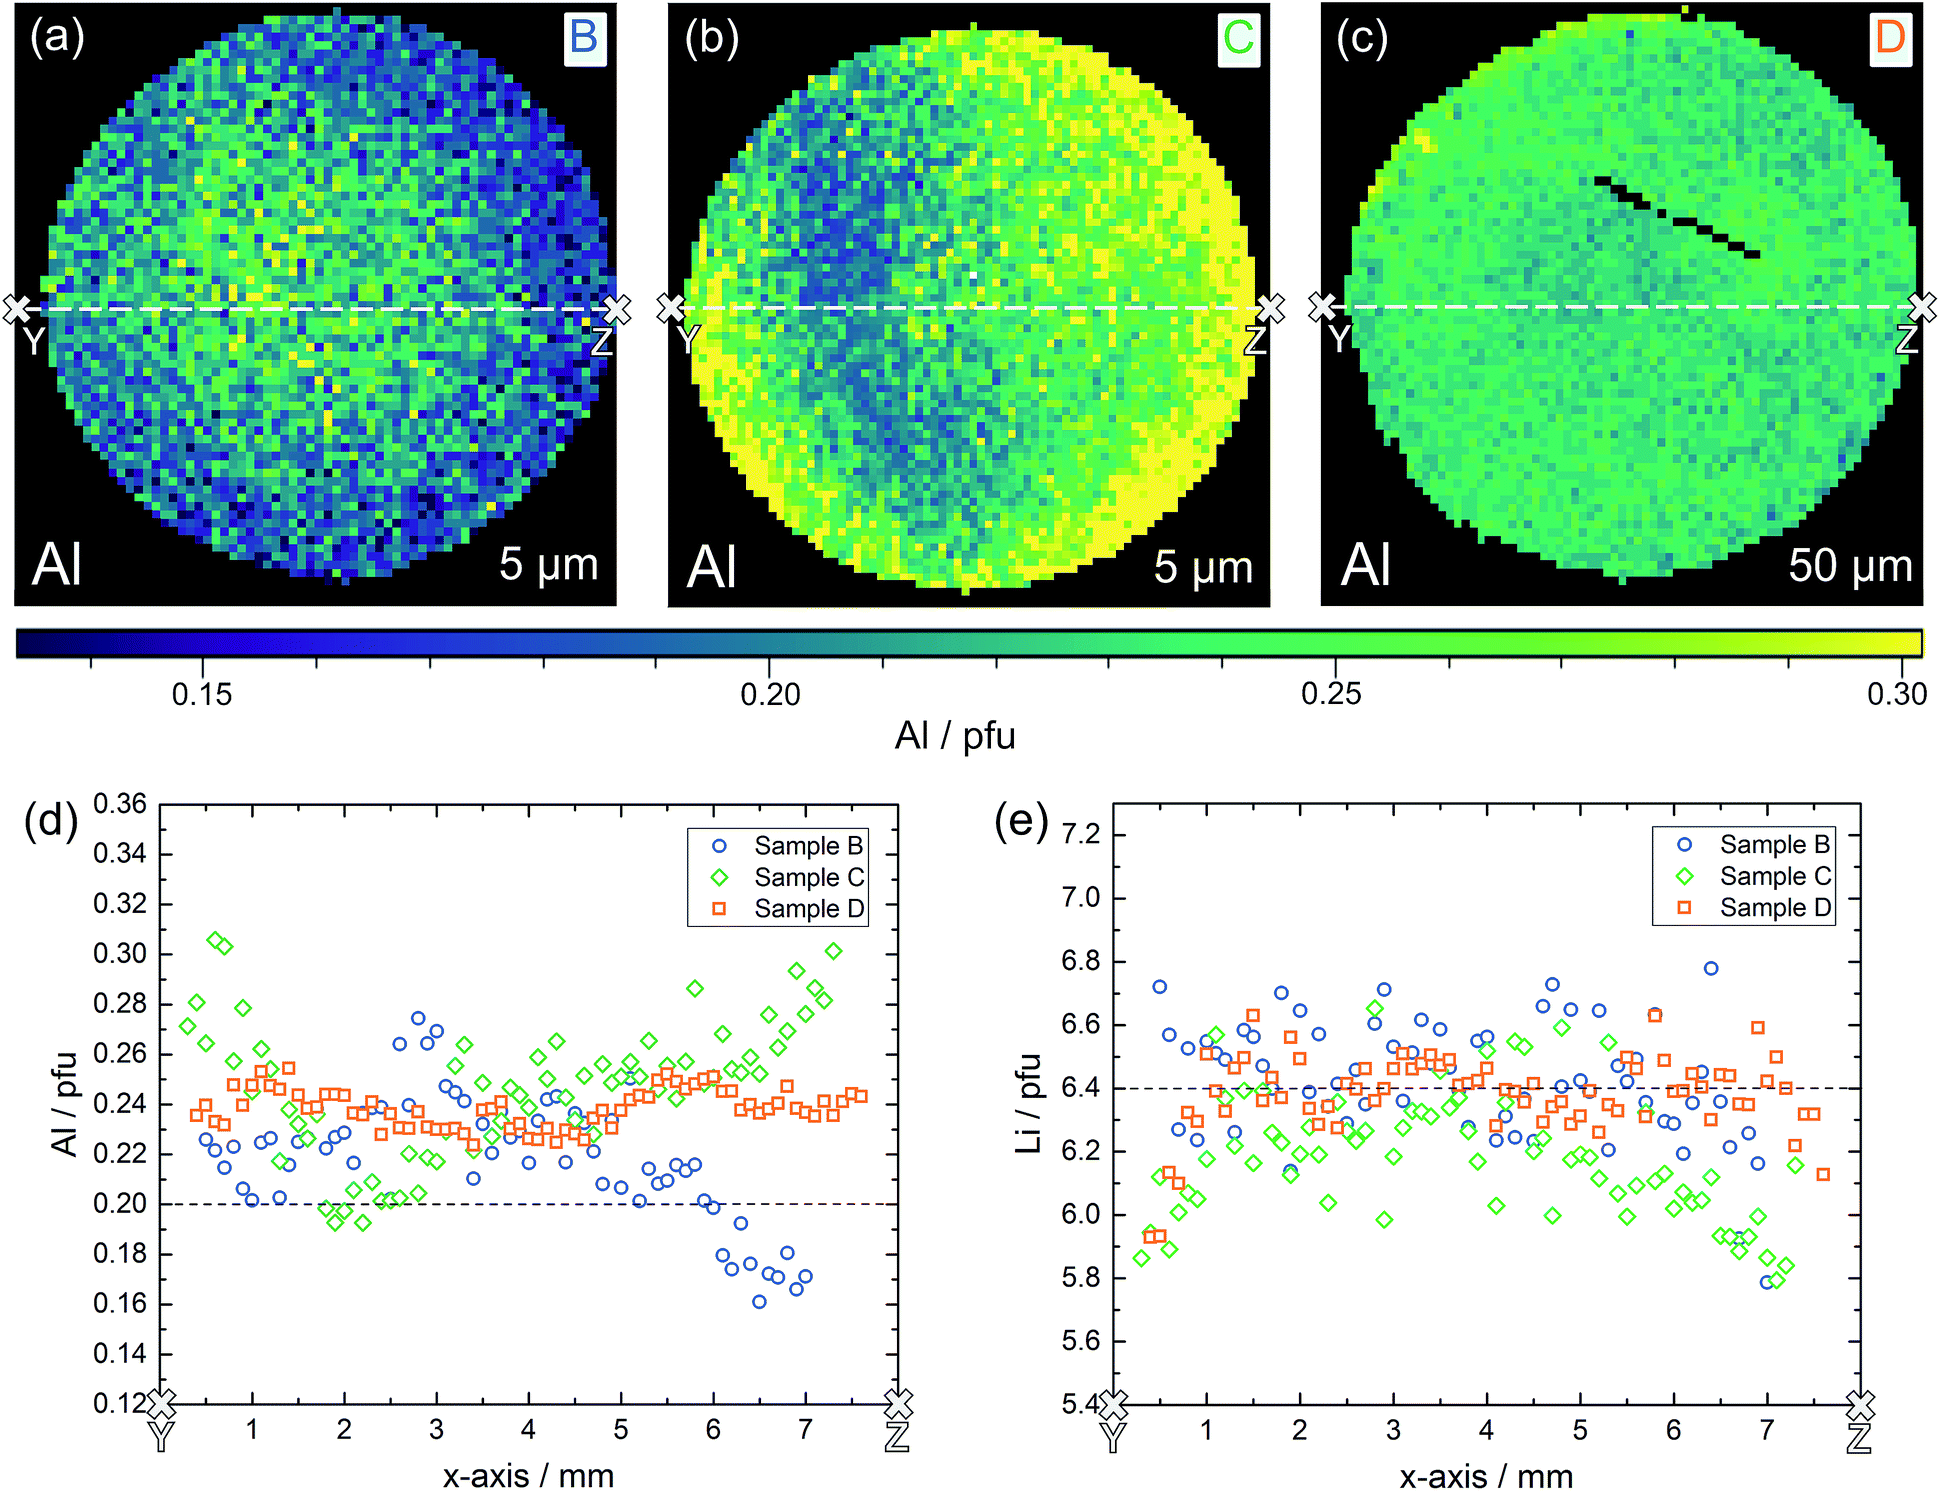 | ||
| Fig. 10 Lateral resolved LA-ICP-OES analysis of samples B, C, D, illustrating distribution images of Al in sample B (a), sample C (b) and sample D (c) as well as the Al (d) and Li (e) content in the corresponding cross-sections. Dashed lines indicate the nominal value according to Li6.4Al0.2La3Zr2O12. | ||
Lateral chemical variations of Al are also present in samples B and C (Fig. 10) with B showing an Al enrichment in the centre part of the pellet and C exhibiting a “scattered” minimum in the Al content somewhere in the centre. Sample D was the most homogeneous sample with only moderate scatter of Li and Al contents. In these samples, a correlation between the Al content and Li content is not visible. This, however, might be due to the fact that a very high precision of the Li determination is required to see the small relative changes of the Li content caused by the Al variations. Moreover, lithium oxide loss during sintering with formation of oxygen vacancies68 might affect the cation ratios.
From all measured LA-ICP-OES data of a given sample, i.e. by averaging laterally and for different depths, average chemical compositions can be calculated. They are shown in Table 3.
| Li/La | Al/La | Zr/La | Composition | |
|---|---|---|---|---|
| A | 2.07 | 0.076 | 0.669 | Li6.20Al0.23La3Zr2.01O11.95 |
| B | 2.16 | 0.069 | 0.637 | Li6.49Al0.21La3Zr1.91O11.86 |
| C | 2.10 | 0.089 | 0.631 | Li6.30Al0.27La3Zr1.89O11.83 |
| D | 2.13 | 0.080 | 0.682 | Li6.39Al0.24La3Zr1.92O12.15 |
In sample A the measured Al content was slightly higher and the measured Li content was lower than expected, leading to a total composition of Li6.20Al0.23La3Zr2.01O11.95 when calculating the oxygen content for fixed cation charges. A lower amount of lithium is not too surprising, due to its volatility during sintering. The behaviour of aluminium is less straightforward to interpret. Possibly a gradient in Al not only exists laterally, on the mm scale (cf.Fig. 9), but also across the entire sample with somewhat less Al in the center parts beyond the 100 μm depth probed by LA-ICP-OES. Even though the sample pellets were placed between two additional pellets of pure Li7La3Zr2O12 during sintering to avoid contamination, also incorporation of additional Al3+ from alumina crucible cannot be ruled out. Sample B–D show slightly increased Al content as well, supporting this hypothesis.
While sample C shows a lower Li content than expected, like sample A, the measured Li amounts of sample D and B are close to the nominal value or higher than expected, indicating that different amounts of lithium oxide were lost during sintering.
Correlation of conductivity and chemical composition
Based on the conductivity measurements and compositional data we can now analyze whether or not simple correlations exist between electrical properties and composition. Sample A exhibits both, a lateral compositional and a lateral conductivity variation and a correlation of both would not be surprising. However, overlaying both results for two cross-sections (Fig. 11a and b) already shows that there is at least not a simple relationship. This becomes even clearer when plotting all measured conductivities versus the corresponding Al or Li content (Fig. 11c–e, shown for two depths). The dotted lines in these plots represent the nominally expected amounts of Al (0.20 pfu) and Li (6.40 pfu), respectively. Similarly high conductivity values are found over the entire Al range, i.e. from 0.15 to 0.30 pfu. Only the scatter of conductivity values seems to depend on the amount of Al, with less or no low conductive regions around 0.20 to 0.23 pfu Al. The statistical significance of this, however, is not clear. In the plot of conductivity versus Li content the scatter is the same for all Li contents and essentially all Li contents from 6.1 to 6.6 pfu exhibit some data points with reasonably high conductivities. This is a first strong indication that the conductivity of LLZO does not show a simple correlation to Li and Al content.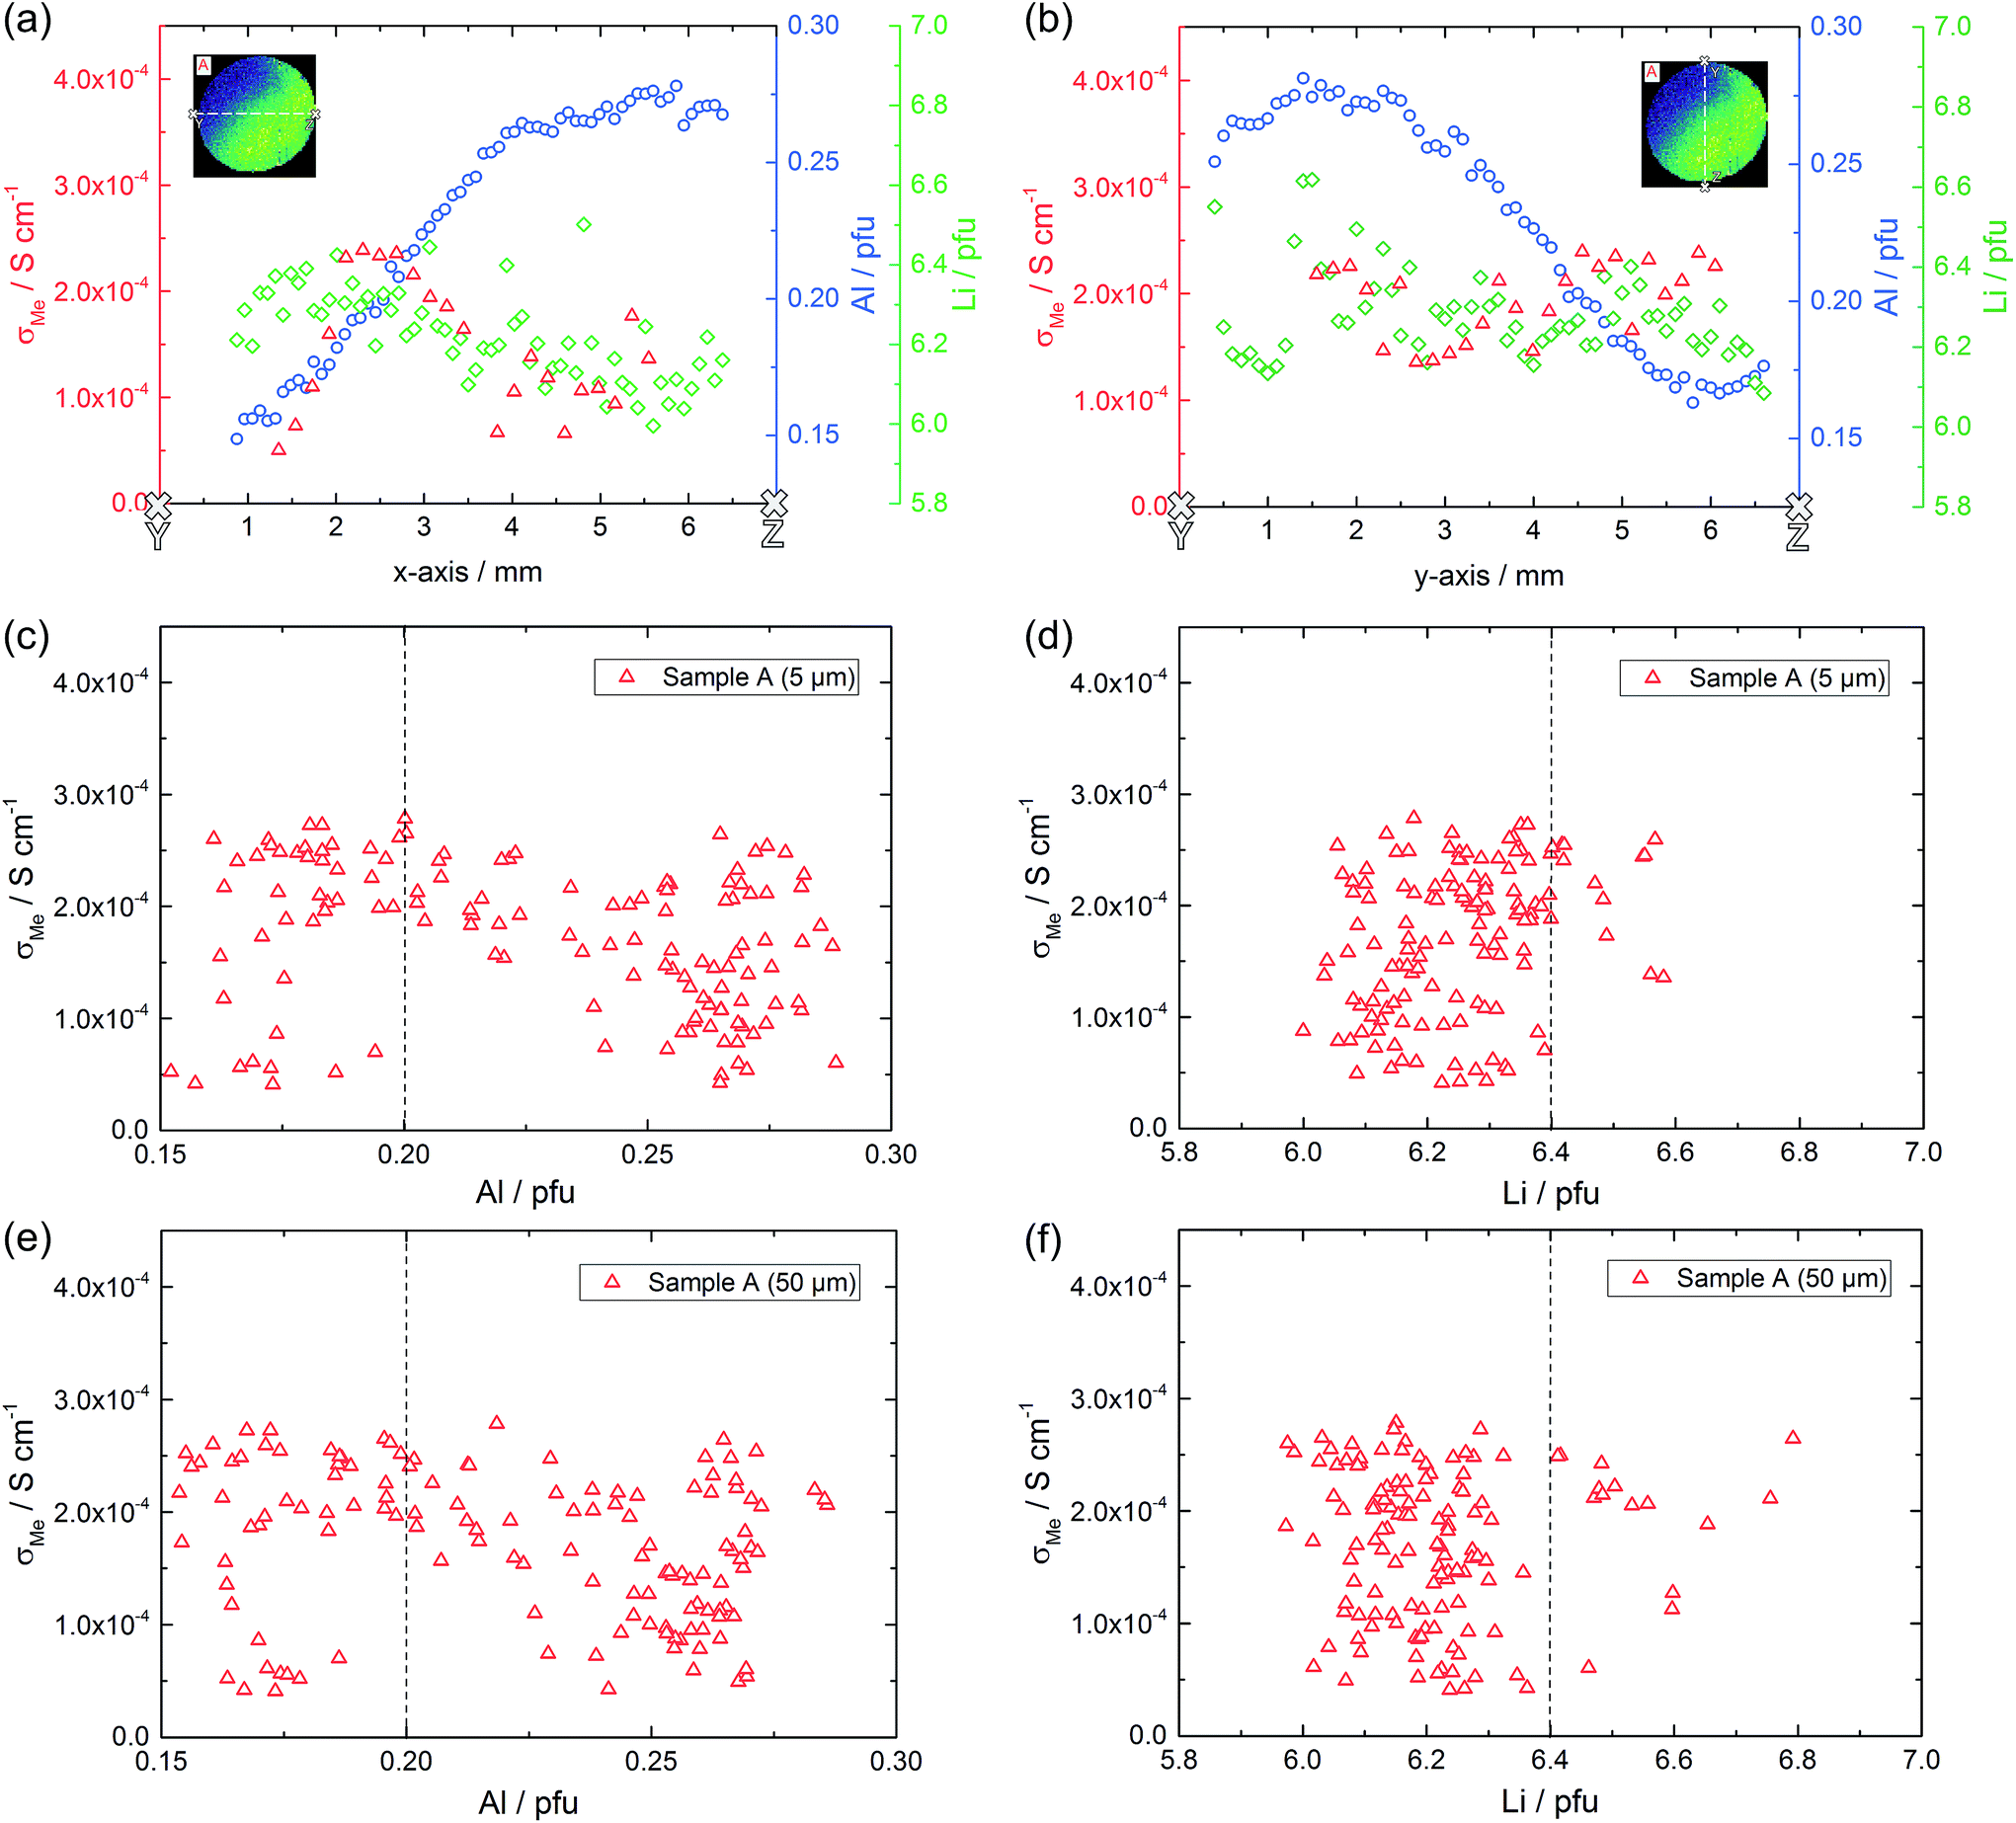 | ||
| Fig. 11 Correlation of laterally resolved conductivity and stoichiometry measurements on sample A. Conductivity as well as Al and Li content along two cross-sections (a, b) and conductivity of each measured microelectrode versus the corresponding amount of Al and Li in 5 μm (c, d) and 50 μm depth (e, f). Dashed lines indicate the nominal value according to Li6.4Al0.2La3Zr2O12. | ||
Fig. 12 displays plots of conductivity versus composition (Li or Al) for the other samples. Samples B and D show only moderate composition variation with Al as well as Li content in a similar range. Also the conductivity variations are comparatively small, however, sample B shows significantly higher local conductivities (about 3.5 × 10⁻⁴ S cm−1) compared to sample D (about 2.0 × 10⁻⁴ S cm−1). Sample C, finally, includes a substantial variation of the chemical composition while staying at relatively low conductivity. Hence a broad range of Al and Li content leads to very similar conductivity values.
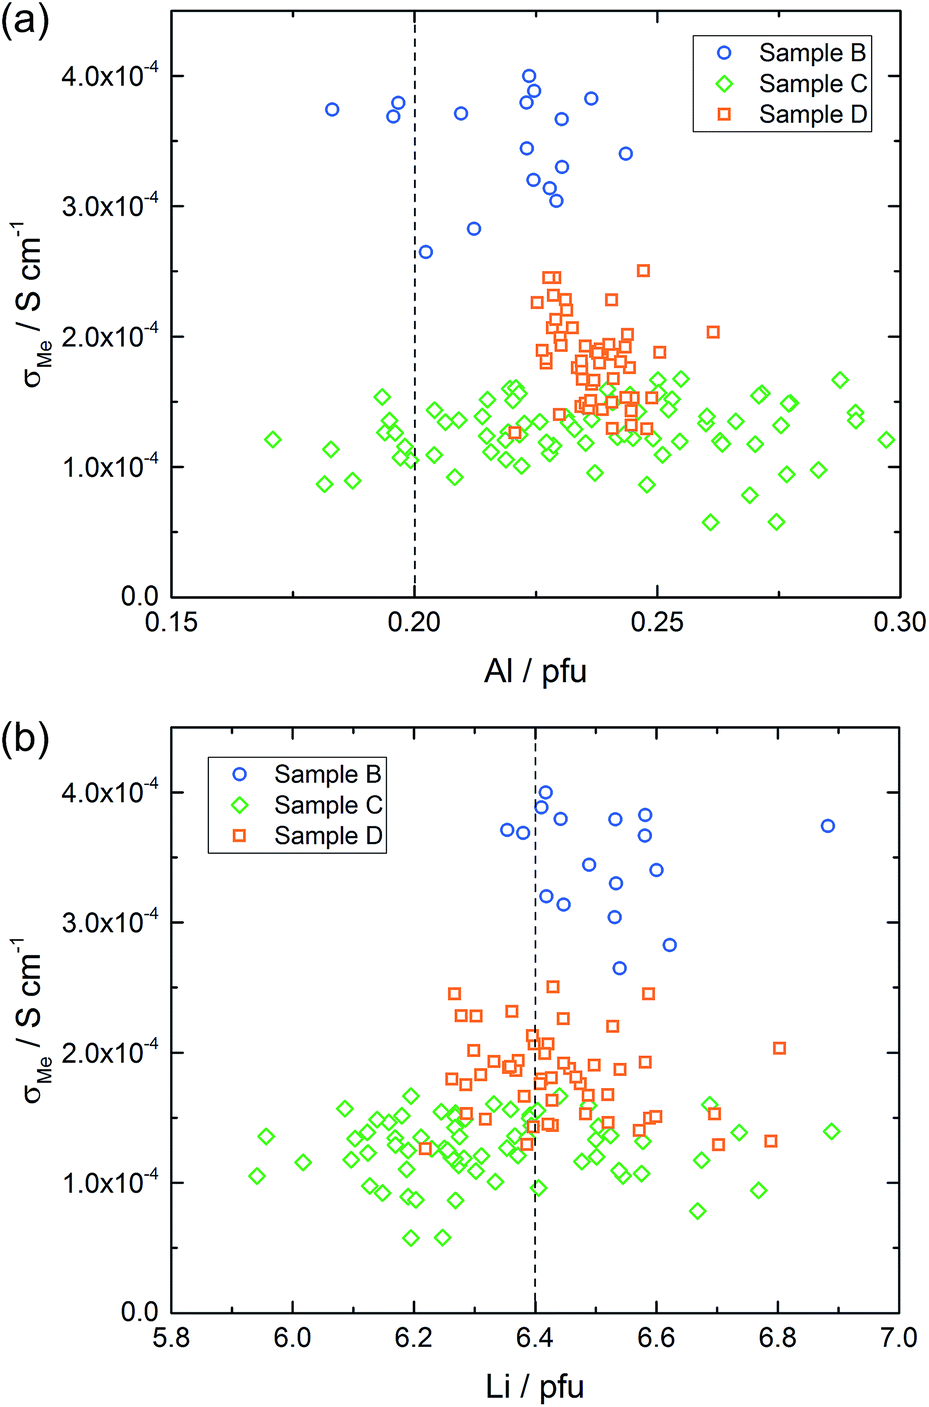 | ||
| Fig. 12 The conductivity of each measured microelectrode on sample B–D versus the corresponding amount of Al (a) and Li (b) averaged over all measured sample depths. The dashed lines represent the intended composition, in the case of Al it was 0.20 pfu resulting in Li 6.40 pfu. | ||
From all these plots it also becomes clear that for the same Al content the conductivity can vary by almost an order of magnitude. The same is true for the Li content. This is exemplified by the conductivity and composition data of four different spots on sample A (Table 4). Two of them exhibit a rather high Li amount (6.35 and 6.37 Li pfu), but conductivities vary from rather low (0.56 × 10⁻⁴ S cm−1) to acceptably high (2.42 × 10⁻⁴ S cm−1). On the other hand, if the amount of lithium is pretty low (6.12 to 6.13 pfu) the ionic conductivity can still be either acceptably high (2.54 × 10⁻⁴ S cm−1) or more than three times lower. Accordingly, there seems to be no optimal Li content (within the range considered here, i.e. between ca. 6.0 and 6.7 pfu) in contrast to suggestions in the literature.
| Spots | σ Me, S cm−1 | Composition |
|---|---|---|
| Li enriched 1 | 2.42 × 10⁻⁴ | Li6.37Al0.20La3Zr2.02O12.04 |
| Li enriched 2 | 0.56 × 10⁻⁴ | Li6.35Al0.18La3Zr2.03O12.03 |
| Li poor 1 | 2.54 × 10⁻⁴ | Li6.13Al0.28La3Zr2.01O12.01 |
| Li poor 2 | 0.79 × 10⁻⁴ | Li6.12Al0.26La3Zr2.02O12.00 |
Overall, we thus conclude that there is no clear and simple relationship between ionic conductivity and Al or Li content in Al stabilized LLZO. Hence, other aspects have to be of high relevance for the Li ion conductivity that are not simply reflected by the concentration of the stabilizing cation (Al) or the absolute Li content. Clarifying the true reasons behind varying conductivities requires detailed further measurements and is beyond the scope of this paper. We suggest two possible reasons: first, Li ion conduction in LLZO is a complex phenomenon with different cation sites being involved.37–40,69 The exact site occupancy in a LLZO sample, and thus also the effective mobility of Li, may depend on the preparation and might exhibit gradients within samples. They are not accessible by mapping local compositions only. Accordingly, the detailed local structure might be more important for the ionic conductivity than the exact Al or Li content.
Second, existence of oxygen vacancies and their effect on the lithium ion conduction might be another important aspect to consider. Recent tracer exchange experiments with subsequent secondary ion mass spectrometry (SIMS) analysis revealed the presence of possibly substantial amounts of oxygen vacancies in various LLZO samples.68 Also the results of our study indicate understoichiometric amounts of oxygen: calculating the average oxygen content of our LLZO samples from the measured amounts of cations with fixed charge leads to oxygen contents <12 for most samples, cf.Table 3. These oxygen vacancies may also affect the local occupancy of cation sites as well as activation barriers for Li migration.
Hence, a deeper understanding of the Li ion conductivity in Al stabilized LLZO might require much more information than the Al content; rather, detailed information on oxygen vacancy concentrations and local site occupancies might be key for in-depth knowledge.
Conclusions
Several Al stabilized LLZO samples were chemically and electrochemically characterized. Microelectrode measurements revealed the existence of distinct local conductivity variation within individual samples, but also differences between nominally identical samples. Spatially resolved LA-ICP-OES measurements were used to investigate the local chemical bulk composition. While the same composition was found between 5 and 100 μm depth, samples showed lateral gradients in the Al and Li content as well as deviations from the nominal values (on average too much Al, too little Li). However, no clear trend could be found how the elemental composition and its variation relate to the local ionic conductivity. Neither does a high (or low) Li content (between 6.1 and 6.6 pfu) lead to particularly high ionic conductivities nor does a certain Al amount (between 0.15 and 0.3 pfu) maximize the conductivity. This absence of a simple correlation between composition and conductivity indicates that there have to be other yet unknown parameters that have a pronounced effect on the conductivity. For example, the exact local crystal structure with varying site occupancy or oxygen vacancies might strongly affect the Li conduction paths and local activation barriers and could thus have a higher impact on the ionic conductivity of LLZO than the absolute local cation stoichiometry.Conflicts of interest
There are no conflicts to declare.Acknowledgements
The authors gratefully acknowledge The Austrian Research Promotion Agency (FFG) SoLiK project and Austrian Science Fund (FWF) project W1243-N16 for financial support.References
- J. Awaka, N. Kijima, H. Hayakawa and J. Akimoto, Synthesis and structure analysis of tetragonal Li7La3Zr2O12 with the garnet-related type structure, J. Solid State Chem., 2009, 182, 2046–2052 CrossRef CAS.
- J. Awaka, A. Takashima, K. Kataoka, N. Kijima, Y. Idemoto and J. Akimoto, Crystal Structure of Fast Lithium-ion-conducting Cubic Li7La3Zr2O12, Chem. Lett., 2011, 40, 60–62 CrossRef CAS.
- R. Murugan, V. Thangadurai and W. Weppner, Fast lithium ion conduction in garnet-type Li7La3Zr2O12, Angew. Chem., Int. Ed., 2007, 46, 7778–7781 CrossRef CAS PubMed.
- E. J. Cussen, Structure and ionic conductivity in lithium garnets, J. Mater. Chem., 2010, 20, 5167–5173 RSC.
- E. Rangasamy, J. Wolfenstine and J. Sakamoto, The role of Al and Li concentration on the formation of cubic garnet solid electrolyte of nominal composition Li7La3Zr2O12, Solid State Ionics, 2012, 206, 28–32 CrossRef CAS.
- S. Ohta, T. Kobayashi and T. Asaoka, High lithium ionic conductivity in the garnet-type oxide Li7−XLa3(Zr2−X, NbX)O12 (X = 0–2), J. Power Sources, 2011, 196, 3342–3345 CrossRef CAS.
- S. Mukhopadhyay, T. Thompson, J. Sakamoto, A. Huq, J. Wolfenstine, J. L. Allen, N. Bernstein, D. A. Stewart and M. D. Johannes, Structure and Stoichiometry in Supervalent Doped Li7La3Zr2O12, Chem. Mater., 2015, 27, 3658–3665 CrossRef CAS.
- Y. Li, C.-A. Wang, H. Xie, J. Cheng and J. B. Goodenough, High lithium ion conduction in garnet-type Li6La3ZrTaO12, Electrochem. Commun., 2011, 13, 1289–1292 CrossRef CAS.
- H. Buschmann, S. Berendts, B. Mogwitz and J. Janek, Lithium metal electrode kinetics and ionic conductivity of the solid lithium ion conductors “Li7La3Zr2O12” and Li7−xLa3Zr2−xTaxO12 with garnet-type structure, J. Power Sources, 2012, 206, 236–244 CrossRef CAS.
- E. J. Cussen and T. W. S. Yip, A neutron diffraction study of the d0 and d10 lithium garnets Li3Nd3W2O12 and Li5La3Sb2O12, J. Solid State Chem., 2007, 180, 1832–1839 CrossRef CAS.
- C. Deviannapoorani, L. Dhivya, S. Ramakumar and R. Murugan, Lithium ion transport properties of high conductive tellurium substituted Li7La3Zr2O12 cubic lithium garnets, J. Power Sources, 2013, 240, 18–25 CrossRef CAS.
- T. Thompson, A. Sharafi, M. D. Johannes, A. Huq, J. L. Allen, J. Wolfenstine and J. Sakamoto, A Tale of Two Sites, Adv. Energy Mater., 2015, 5, 1500096 CrossRef.
- P. Bottke, D. Rettenwander, W. Schmidt, G. Amthauer and M. Wilkening, Ion Dynamics in Solid Electrolytes, Chem. Mater., 2015, 27, 6571–6582 CrossRef CAS.
- J. Wolfenstine, J. Sakamoto and J. L. Allen, Electron microscopy characterization of hot-pressed Al substituted Li7La3Zr2O12, J. Mater. Sci., 2012, 47, 4428–4431 CrossRef CAS.
- J. L. Allen, J. Wolfenstine, E. Rangasamy and J. Sakamoto, Effect of substitution (Ta, Al, Ga) on the conductivity of Li7La3Zr2O12, J. Power Sources, 2012, 206, 315–319 CrossRef CAS.
- D. Rettenwander, A. Welzl, L. Cheng, J. Fleig, M. Musso, E. Suard, M. M. Doeff, G. J. Redhammer and G. Amthauer, Synthesis, Crystal Chemistry, and Electrochemical Properties of Li7−2xLa3Zr2−xMoxO12 (x = 0.1–0.4), Inorg. Chem., 2015, 54, 10440–10449 CrossRef CAS PubMed.
- D. Rettenwander, C. A. Geiger and G. Amthauer, Synthesis and crystal chemistry of the fast Li-ion conductor Li7La3Zr2O12 doped with Fe, Inorg. Chem., 2013, 52, 8005–8009 CrossRef CAS PubMed.
- R. Wagner, G. J. Redhammer, D. Rettenwander, G. Tippelt, A. Welzl, S. Taibl, J. Fleig, A. Franz, W. Lottermoser and G. Amthauer, Fast Li-Ion-Conducting Garnet-Related Li7−3xFexLa3Zr2O12 with Uncommon I
![[4 with combining macron]](https://www.rsc.org/images/entities/char_0034_0304.gif) 3d Structure, Chem. Mater., 2016, 28, 5943–5951 CrossRef CAS PubMed.
3d Structure, Chem. Mater., 2016, 28, 5943–5951 CrossRef CAS PubMed. - R. Wagner, D. Rettenwander, G. J. Redhammer, G. Tippelt, G. Sabathi, M. E. Musso, B. Stanje, M. Wilkening, E. Suard and G. Amthauer, Synthesis, Crystal Structure, and Stability of Cubic Li7−xLa3Zr2−xBixO12, Inorg. Chem., 2016, 55, 12211–12219 CrossRef CAS PubMed.
- B. Xu, H. Duan, W. Xia, Y. Guo, H. Kang, H. Li and H. Liu, Multistep sintering to synthesize fast lithium garnets, J. Power Sources, 2016, 302, 291–297 CrossRef CAS.
- J.-F. Wu, E.-Y. Chen, Y. Yu, L. Liu, Y. Wu, W. K. Pang, V. K. Peterson and X. Guo, Gallium-Doped Li7La3Zr2O12 Garnet-Type Electrolytes with High Lithium-Ion Conductivity, ACS Appl. Mater. Interfaces, 2017, 9, 1542–1552 CrossRef CAS PubMed.
- H. El-Shinawi, G. W. Paterson, D. A. MacLaren, E. J. Cussen and S. A. Corr, Low-temperature densification of Al-doped Li7La3Zr2O12, J. Mater. Chem. A, 2017, 5, 319–329 RSC.
- C. Ma, E. Rangasamy, C. Liang, J. Sakamoto, K. L. More and M. Chi, Excellent stability of a lithium-ion-conducting solid electrolyte upon reversible Li+/H+ exchange in aqueous solutions, Angew. Chem., Int. Ed., 2015, 54, 129–133 CrossRef CAS PubMed.
- Z. F. Yow, Y. L. Oh, W. Gu, R. P. Rao and S. Adams, Effect of Li+/H+ exchange in water treated Ta-doped Li7La3Zr2O12, Solid State Ionics, 2016, 292, 122–129 CrossRef CAS.
- G. Larraz, A. Orera and M. L. Sanjuán, Cubic phases of garnet-type Li7La3Zr2O12, J. Mater. Chem. A, 2013, 1, 11419–11428 RSC.
- A. Orera, G. Larraz, J. A. Rodríguez-Velamazán, J. Campo and M. L. Sanjuán, Influence of Li+ and H+ Distribution on the Crystal Structure of Li7−xHxLa3Zr2O12 (0 ≤ x ≤ 5) Garnets, Inorg. Chem., 2016, 55, 1324–1332 CrossRef CAS PubMed.
- R. H. Brugge, A. K. O. Hekselman, A. Cavallaro, F. M. Pesci, R. J. Chater, J. A. Kilner and A. Aguadero, Garnet Electrolytes for Solid State Batteries, Chem. Mater., 2018, 30, 3704–3713 CrossRef CAS.
- Y. Jin and P. J. McGinn, Li7La3Zr2O12 electrolyte stability in air and fabrication of a Li/Li7La3Zr2O12/Cu0.1V2O5 solid-state battery, J. Power Sources, 2013, 239, 326–331 CrossRef CAS.
- L. Cheng, J. S. Park, H. Hou, V. Zorba, G. Chen, T. Richardson, J. Cabana, R. Russo and M. Doeff, Effect of microstructure and surface impurity segregation on the electrical and electrochemical properties of dense Al-substituted Li7La3Zr2O12, J. Mater. Chem. A, 2014, 2, 172–181 RSC.
- C. Liu, K. Rui, C. Shen, M. E. Badding, G. Zhang and Z. Wen, Reversible ion exchange and structural stability of garnet-type Nb-doped Li7La3Zr2O12 in water for applications in lithium batteries, J. Power Sources, 2015, 282, 286–293 CrossRef CAS.
- W. Xia, B. Xu, H. Duan, X. Tang, Y. Guo, H. Kang, H. Li and H. Liu, Reaction mechanisms of lithium garnet pellets in ambient air, J. Am. Ceram. Soc., 2017, 100, 2832–2839 CrossRef CAS.
- A. Sharafi, S. Yu, M. Naguib, M. Lee, C. Ma, H. M. Meyer, J. Nanda, M. Chi, D. J. Siegel and J. Sakamoto, Impact of air exposure and surface chemistry on Li–Li7La3Zr2O12 interfacial resistance, J. Mater. Chem. A, 2017, 5, 13475–13487 RSC.
- L. Cheng, E. J. Crumlin, W. Chen, R. Qiao, H. Hou, S. Franz Lux, V. Zorba, R. Russo, R. Kostecki, Z. Liu, K. Persson, W. Yang, J. Cabana, T. Richardson, G. Chen and M. Doeff, The origin of high electrolyte–electrode interfacial resistances in lithium cells containing garnet type solid electrolytes, Phys. Chem. Chem. Phys., 2014, 16, 18294–18300 RSC.
- H. Hou, L. Cheng, T. Richardson, G. Chen, M. Doeff, R. Zheng, R. Russo and V. Zorba, Three-dimensional elemental imaging of Li-ion solid-state electrolytes using fs-laser induced breakdown spectroscopy (LIBS), J. Anal. At. Spectrom., 2015, 30, 2295–2302 RSC.
- L. Cheng, H. Hou, S. Lux, R. Kostecki, R. Davis, V. Zorba, A. Mehta and M. Doeff, Enhanced lithium ion transport in garnet-type solid state electrolytes, J. Electroceram., 2017, 38, 168–175 CrossRef CAS.
- G. Larraz, A. Orera, J. Sanz, I. Sobrados, V. Diez-Gómez and M. L. Sanjuán, NMR study of Li distribution in Li7−xHxLa3Zr2O12 garnets, J. Mater. Chem. A, 2015, 3, 5683–5691 RSC.
- M. Xu, M. S. Park, J. M. Lee, T. Y. Kim, Y. S. Park and E. Ma, Mechanisms of Li+ transport in garnet-type cubic Li3+xLa3M2O12 (M = Te, Nb, Zr), Phys. Rev. B: Condens. Matter Mater. Phys., 2012, 85, 052301 CrossRef.
- J. Han, J. Zhu, Y. Li, X. Yu, S. Wang, G. Wu, H. Xie, S. C. Vogel, F. Izumi, K. Momma, Y. Kawamura, Y. Huang, J. B. Goodenough and Y. Zhao, Experimental visualization of lithium conduction pathways in garnet-type Li7La3Zr2O12, Chem. Commun., 2012, 48, 9840–9842 RSC.
- R. Jalem, Y. Yamamoto, H. Shiiba, M. Nakayama, H. Munakata, T. Kasuga and K. Kanamura, Concerted Migration Mechanism in the Li Ion Dynamics of Garnet-Type Li7La3Zr2O12, Chem. Mater., 2013, 25, 425–430 CrossRef CAS.
- D. Wang, G. Zhong, W. K. Pang, Z. Guo, Y. Li, M. J. McDonald, R. Fu, J.-X. Mi and Y. Yang, Toward Understanding the Lithium Transport Mechanism in Garnet-type Solid Electrolytes, Chem. Mater., 2015, 27, 6650–6659 CrossRef CAS.
- F. Zheng, M. Kotobuki, S. Song, M. O. Lai and L. Lu, Review on solid electrolytes for all-solid-state lithium-ion batteries, J. Power Sources, 2018, 389, 198–213 CrossRef CAS.
- C. Sun, J. Liu, Y. Gong, D. P. Wilkinson and J. Zhang, Recent advances in all-solid-state rechargeable lithium batteries, Nano Energy, 2017, 33, 363–386 CrossRef CAS.
- S. Troy, A. Schreiber, T. Reppert, H.-G. Gehrke, M. Finsterbusch, S. Uhlenbruck and P. Stenzel, Life cycle assessment and resource analysis of all-solid-state batteries, Appl. Energy, 2016, 169, 757–767 CrossRef.
- H. Buschmann, J. Dölle, S. Berendts, A. Kuhn, P. Bottke, M. Wilkening, P. Heitjans, A. Senyshyn, H. Ehrenberg, A. Lotnyk, V. Duppel, L. Kienle and J. Janek, Structure and dynamics of the fast lithium ion conductor “Li7La3Zr2O12”, Phys. Chem. Chem. Phys., 2011, 13, 19378–19392 RSC.
- C. A. Geiger, E. Alekseev, B. Lazic, M. Fisch, T. Armbruster, R. Langner, M. Fechtelkord, N. Kim, T. Pettke and W. Weppner, Crystal chemistry and stability of “Li7La3Zr2O12” garnet, Inorg. Chem., 2011, 50, 1089–1097 CrossRef CAS PubMed.
- A. Wachter-Welzl, J. Kirowitz, R. Wagner, S. Smetaczek, G. C. Brunauer, M. Bonta, D. Rettenwander, S. Taibl, A. Limbeck, G. Amthauer and J. Fleig, The origin of conductivity variations in Al-stabilized Li7La3Zr2O12 ceramics, Solid State Ionics, 2018, 319, 203–208 CrossRef CAS.
- M. Kotobuki, K. Kanamura, Y. Sato and T. Yoshida, Fabrication of all-solid-state lithium battery with lithium metal anode using Al2O3-added Li7La3Zr2O12 solid electrolyte, J. Power Sources, 2011, 196, 7750–7754 CrossRef CAS.
- Y. Zhang, F. Chen, R. Tu, Q. Shen and L. Zhang, Field assisted sintering of dense Al-substituted cubic phase Li7La3Zr2O12 solid electrolytes, J. Power Sources, 2014, 268, 960–964 CrossRef CAS.
- Y. Li, J.-T. Han, C.-A. Wang, S. C. Vogel, H. Xie, M. Xu and J. B. Goodenough, Ionic distribution and conductivity in lithium garnet Li7La3Zr2O12, J. Power Sources, 2012, 209, 278–281 CrossRef CAS.
- J. Fleig and J. Maier, Local conductivity measurements on AgCl surfaces using microelectrodes, Solid State Ionics, 1996, 85, 9–15 CrossRef CAS.
- J. Fleig and J. Maier, Microcontact impedance measurements of individual highly conductive grain boundaries, Phys. Chem. Chem. Phys., 1999, 1, 3315–3320 RSC.
- J.-S. Lee, J. Fleig, J. Maier, T.-J. Chung and D.-Y. Kim, Microcontact impedance spectroscopy in nitrogen-graded zirconia, Solid State Ionics, 2005, 176, 1711–1716 CrossRef CAS.
- D. Rettenwander, A. Welzl, S. Pristat, F. Tietz, S. Taibl, G. J. Redhammer and J. Fleig, A microcontact impedance study on NASICON-type Li1+xAlxTi2−x(PO4)3 (0 ≤ x ≤ 0.5) single crystals, J. Mater. Chem. A, 2016, 4, 1506–1513 RSC.
- J. Fleig, Microelectrodes in solid state ionics, Solid State Ionics, 2003, 161, 279–289 CrossRef CAS.
- R. Wagner, G. J. Redhammer, D. Rettenwander, A. Senyshyn, W. Schmidt, M. Wilkening and G. Amthauer, Crystal Structure of Garnet-Related Li-Ion Conductor Li7−3xGaxLa3Zr2O12: Fast Li-Ion Conduction Caused by a Different Cubic Modification?, Chem. Mater., 2016, 28, 1861–1871 CrossRef CAS PubMed.
- A. Limbeck, M. Bonta and W. Nischkauer, Improvements in the direct analysis of advanced materials using ICP-based measurement techniques, J. Anal. At. Spectrom., 2017, 32, 212–232 RSC.
- Y. Liu, Z. Hu, S. Gao, D. Günther, J. Xu, C. Gao and H. Chen, In situ analysis of major and trace elements of anhydrous minerals by LA-ICP-MS without applying an internal standard, Chem. Geol., 2008, 257, 34–43 CrossRef CAS.
- J. Fleig, The grain boundary impedance of random microstructures: numerical simulations and implications for the analysis of experimental data, Solid State Ionics, 2002, 150, 181–193 CrossRef CAS.
- Y. Zhang, J. Cai, F. Chen, R. Tu, Q. Shen, X. Zhang and L. Zhang, Preparation of cubic Li7La3Zr2O12 solid electrolyte using a nano-sized core–shell structured precursor, J. Alloys Compd., 2015, 644, 793–798 CrossRef CAS.
- Y. Matsuda, K. Sakamoto, M. Matsui, O. Yamamoto, Y. Takeda and N. Imanishi, Phase formation of a garnet-type lithium-ion conductor Li7−3xAlxLa3Zr2O12, Solid State Ionics, 2015, 277, 23–29 CrossRef CAS.
- W. E. Tenhaeff, E. Rangasamy, Y. Wang, A. P. Sokolov, J. Wolfenstine, J. Sakamoto and N. J. Dudney, Resolving the Grain Boundary and Lattice Impedance of Hot-Pressed Li7La3Zr2O12 Garnet Electrolytes, ChemElectroChem, 2014, 1, 375–378 CrossRef.
- C.-L. Tsai, E. Dashjav, E.-M. Hammer, M. Finsterbusch, F. Tietz, S. Uhlenbruck and H. P. Buchkremer, High conductivity of mixed phase Al-substituted Li7La3Zr2O12, J. Electroceram., 2015, 35, 25–32 CrossRef CAS.
- F. Llewellyn-Jones, The physics of electrical contacts, Clarendon Press, Oxford, 1957 Search PubMed.
- R. Holm, Electric contacts handbook, Springer, Berlin, 3rd edn, 1958 Search PubMed.
- J. Newman, Resistance for Flow of Current to a Disk, J. Electrochem. Soc., 1966, 113, 501 CrossRef CAS.
- A. Wachter-Welzl, R. Wagner, D. Rettenwander, S. Taibl, G. Amthauer and J. Fleig, Microelectrodes for local conductivity and degradation measurements on Al stabilized Li7La3Zr2O12 garnets, J. Electroceram., 2017, 38, 176–181 CrossRef CAS.
- E. Yi, W. Wang, J. Kieffer and R. M. Laine, Key parameters governing the densification of cubic-Li7La3Zr2O12 Li+ conductors, J. Power Sources, 2017, 352, 156–164 CrossRef CAS.
- M. Kubicek, A. Wachter-Welzl, D. Rettenwander, R. Wagner, S. Berendts, R. Uecker, G. Amthauer, H. Hutter and J. Fleig, Oxygen Vacancies in Fast Lithium-Ion Conducting Garnets, Chem. Mater., 2017, 29, 7189–7196 CrossRef CAS.
- X. He, Y. Zhu and Y. Mo, Origin of fast ion diffusion in super-ionic conductors, Nat. Commun., 2017, 8, 15893 CrossRef CAS PubMed.
Footnote |
| † Electronic supplementary information (ESI) available. See DOI: 10.1039/c9ta00356h |
| This journal is © The Royal Society of Chemistry 2019 |