 Open Access Article
Creative Commons Attribution 3.0 Unported Licence
Surface reactivity and cation non-stoichiometry in BaZr1−xYxO3−δ (x = 0–0.2) exposed to CO2 at elevated temperature†
Rokas
Sažinas
 abc,
Martin F.
Sunding
 d,
Annett
Thøgersen
d,
Isao
Sakaguchi
b,
Truls
Norby
e,
Tor
Grande
a and
Jonathan M.
Polfus
d,
Annett
Thøgersen
d,
Isao
Sakaguchi
b,
Truls
Norby
e,
Tor
Grande
a and
Jonathan M.
Polfus
 *d
*d
aDepartment of Materials Science and Engineering, NTNU Norwegian University of Science and Technology, NO-7491 Trondheim, Norway
bResearch Center for Functional Materials, National Institute for Materials Science, 1-1 Namiki, Tsukuba 305-0044, Japan
cDepartment of Energy Conversion and Storage, Technical University of Denmark, DK-4000, Roskilde, Denmark
dSINTEF Industry, Sustainable Energy Technology, PO Box 124, Blindern, NO-0314 Oslo, Norway
eDepartment of Chemistry, University of Oslo, Centre for Materials Science and Nanotechnology (SMN), FERMiO, Gaustadalléen 21, NO-0349 Oslo, Norway. E-mail: jonathan.polfus@sintef.no
First published on 31st January 2019
Abstract
The reactivity of BaZr1−xYxO3−δ (x = 0–0.2) ceramics under 1 atm CO2 at 650 °C for up to 1000 h was investigated in order to elucidate possible degradation processes occurring when the material is applied as a proton-conducting electrolyte in electrochemical devices. The annealed ceramics were characterized by a range of techniques (SEM, TEM, GIXRD, XPS and SIMS) with respect to changes in the phase composition and microstructure. Formation of BaCO3 was observed on the surfaces of the annealed samples and the amount increased with time and was higher for the Y-doped compositions. The subsurface regions were found to be deficient in Ba and, in the case of the Y-doped compositions, enriched in Y in two distinct chemical states as identified by XPS. First-principles calculations showed that they were Y residing on the Zr and Ba-sites, respectively, and that local enrichment of Y both in bulk and on the surface attained a structure similar to Y2O3. Overall, it was substantiated that the reaction with CO2 mainly proceeded according to a defect chemical reaction involving transfer of Y to the Ba-site and consumption of BaZrO3 formula units. It was suggested that a similar degradation mechanism may occur in the case of Ba(OH)2 formation under high steam pressure conditions.
1. Introduction
AIIBIVO3 perovskites have been widely studied as materials for solid state electrochemical devices.1–3 Alkali earths such as strontium and barium on the A-site implies the possibility of reaction with CO2 to form stable carbonates at low to intermediate temperatures in electrochemical systems for the conversion of hydrocarbons.1,3–10 The CO2-sensitivity of the materials can originate from thermodynamic phase instability or surface reactivity, and minor compositional modifications can affect the chemical stability.![[thin space (1/6-em)]](https://www.rsc.org/images/entities/char_2009.gif) 11 Consequently, traditional solid-state reaction synthesis can be insufficient to avoid compositional heterogeneities that exhibit poorer resistance to CO2
11 Consequently, traditional solid-state reaction synthesis can be insufficient to avoid compositional heterogeneities that exhibit poorer resistance to CO2![[thin space (1/6-em)]](https://www.rsc.org/images/entities/char_2009.gif) 11 and powder processing can therefore also have a significant impact on stability as well as sinterability.12–14
11 and powder processing can therefore also have a significant impact on stability as well as sinterability.12–14
The high proton conductivity of Y-doped BaZrO3 (BZY) has made it the state-of-the-art solid-state electrolyte in proton ceramic fuel cells (PCFCs)3,15 and electrochemical membrane reactors.16,17 BZY has a cubic crystal structure,18 and BZY containing 10 mol% yttria (BZY10) has become one of the most studied compositions.19 Ce-containing compositions, BaZr1−x−yCexYyO3 (BZCY), possess higher proton conductivity and improved sintering properties.20 However, the chemical stability towards CO2-, H2O-, or H2S-containing atmospheres is reduced with increasing Ce-content.21
The presence of carbonates can have a significant effect on the transport properties of proton conductors,22,23 as well as on the catalytic activity in the presence of hydrocarbons.9 Nevertheless, a recent study by Duan et al. showed excellent coking resistance and sulfur tolerance of BaZrO3-based PCFCs.24 Structural and chemical degradation has been reported even in yttria stabilized zirconia (YSZ) in carbon-rich fuel gases such as CH4, CO or syngas, inducing coking/graphitization and (oxy)carbide formation25–28 that led to irreversible changes in the transport properties.27,28 Thus, a thorough understanding of potential degradation processes at the surface of BZY materials is highly desirable, and could lead to valuable insights into the surface chemistry and structure of this important proton-conducting electrolyte.
While bulk BZY has been shown to be chemically stable in 1 atm CO2 above about 600 °C in accordance with thermodynamic considerations,29,30 the surface of the material may still exhibit some reactivity. Computational studies have recently shown that CO2 exhibits strong chemisorption on BaZrO3 surfaces by formation of carbonate species and that a carbonate overlayer of BaCO3 can be thermodynamically preferred even in 400 ppm CO2 above 100 °C.31 The reactivity between BZY and pure CO2 has been demonstrated to result in the formation of BaCO3 and deterioration of the mechanical properties at 550–750 °C.32 It was determined that the reaction with CO2 resulted in Ba-deficiency in the exposed surface rather than formation of ZrO2 crystallites,32 and the reaction could thereby reasonably be described according to
 | (1) |
 and
and  denote Ba- and O-vacancies, respectively, in Kröger–Vink notation.33 Similar degradation has also been reported for Sr-based perovskites.5,34 Alternative reaction pathways can be hypothesized based on further consideration of the phase stability and cation defect chemistry of BZY. In this respect, the coexistence of a Y-rich composition has been reported within single grains of Ba-deficient BZY.35–37 Han et al. showed by synchrotron X-ray diffraction that excess Y can occupy the A-site, i.e.,
  .18 Another possible reaction mechanism between BZY and CO2 towards BaCO3 and Ba-deficient BZY can therefore be expressed by relocation of Y from the Zr to the Ba-site and consumption of one BaZrO3 formula unit according to
 | (2) |
In this study, we present a thorough investigation of the reactivity of dense BaZr1−xYxO3−δ (x = 0–0.2) ceramics with CO2 as the gas relevant for anodic fuel conversion electrochemical devices. The BZY samples were exposed to 1 atm CO2 at 650 °C for 10–1000 h, and the extent of BaCO3 formation and changes in the BZY surface microstructure and chemical composition were investigated by using several techniques. Reactions (1) and (2) both result in Ba-deficient BZ(Y) according to the change in A/B-site ratios, Ba/Zr and Ba/(Zr + Y), respectively. However, the reactions may be differentiated by the presence of the  species as well as the level of deterioration of the BZY grains due to the consumption of a BaZrO3 formula unit in reaction (2). Furthermore, density functional theory (DFT) calculations were performed to evaluate relevant point defect energetics and to compare the thermodynamic feasibility of reactions (1) and (2).
2. Experimental
2.1 Sample preparation
Dense BaZr1−xYxO3−δ (x = 0–0.2) ceramics were prepared by the procedure described in two recent contributions.32,38 Powders made by spray pyrolysis (CerPoTech, Norway) were calcined at 950 °C for 12 h, ball milled and pressed into pellets by uniaxial pressing followed by cold isostatic pressing at 200 MPa. The pellets were sintered at 1600 °C for 10 h in a powder bed consisting of 90 wt% BZY and 10 wt% BaCO3. The pellets were polished with SiC papers and diamond suspensions down to 1 μm in order to obtain surfaces with low roughness. The density of the materials was measured by the Archimedes method using isopropanol at room temperature. The polished disc samples were broken into several pieces and annealed under 1 atm of dry flowing CO2 at 650 °C for total exposure times of 10, 20, 100 and 1000 h. The 10 and 20 h annealing experiments were performed in an alumina tube furnace, and the longer annealings of 100–1000 h were performed in a ProboStat measurement cell (NORECS, Norway) with a sample holder of alumina and platinum wires. The samples are identified by their yttrium content (BZ, BZY10 and BZY20 for 0, 10 and 20% Y doping, respectively) and their exposure time to CO2 at 650 °C.X-ray powder diffraction (XRD) of the calcined powders and sintered materials was performed using a Bruker D8 Advance DaVinci diffractometer using CuKα1 radiation. Grazing incidence XRD (GIXRD) was performed using CuKα1 and parallel beam optics on pristine samples and samples exposed to CO2 to characterize the formation of BaCO3 on the surface. Rietveld refinement of the XRD patterns for powders was carried out using TOPAS V4.1 software using a cubic structure model (Pm![[3 with combining macron]](https://www.rsc.org/images/entities/char_0033_0304.gif) m) for all the BZ(Y) materials.
m) for all the BZ(Y) materials.
The microstructure of the materials was investigated with Hitachi S3400N and Hitachi FEG Zeiss Ultra scanning electron microscopes (SEM) on gold coated samples. The chemical composition of phases was investigated by energy dispersive spectroscopy (EDS) with Oxford Instruments AZtec Energy analysis software.
2.2 Transmission electron microscopy
Cross-sectional transmission electron microscopy (TEM) samples were made using a focused ion beam on a dual-beam JEOL SEM. TEM was carried out using a FEI Titan G2 60-300 operated at 300 kV with a high brightness XFEG, probe corrector, Gatan imaging filter for electron energy loss spectroscopy (EELS) analysis and super-X EDS detector. EELS results were acquired with STEM spectral imaging, using dual EELS, acquiring both high loss and low loss, for energy referencing.2.3 Secondary ion mass spectrometry
The distribution of the isotopes was determined by secondary ion mass spectrometry (SIMS) using a Cameca IMS 4f instrument. A primary ion beam of 10 keV Cs+ was applied while qualitative optimization of sputtering and mass intensity was performed with a 12.5 keV O2+ ion beam. The primary ion current varied between 30 and 60 nA, and the secondary ion intensity ranged between 5 and 6 nA. Depending on the secondary ion intensities, an area with a diameter of ∼30 μm in the center of a sputtered 100 × 100 μm2 area was gated for signal detection and analysis in order to avoid negative interference (edge and wall effects). An electron shower with an acceleration of 4.5 kV for ∼1.2 mA sample current was used to charge compensate the insulating samples. Dynamic transfer optics setting (DTOS) of 60% was used. The secondary molecular ion signals were measured as a function of cycles per second (cps) and sputter time.2.4 X-ray photoelectron spectroscopy
X-ray photoelectron spectroscopy (XPS) was performed on both pristine and CO2-exposed BZY samples using a Kratos Axis UltraDLD XPS system with an incident monochromated Al Kα X-ray beam. The working pressure in the XPS chamber at room temperature was below 5 × 10⁻⁹ mbar. High resolution scans were recorded for the Ba 3d and 4d, Zr 3d, Y 3d, O 1s and C 1s energy regions, with a step size of 0.1 eV. All of the obtained binding energies (BE) were calibrated based on the C 1s peak for aliphatic bonds from adventitious carbon, set to 284.8 eV BE. The resulting XPS data were analysed using CasaXPS software. A Gaussian–Lorentzian line shape GL(30) was employed to fit the XPS peaks after background subtraction based on the Shirley algorithm. The peak separation and area ratio of the Y 3d5/2 and the Y 3d3/2 peaks were constrained to be 2.05 eV and 3![[thin space (1/6-em)]](https://www.rsc.org/images/entities/char_2009.gif) :
:![[thin space (1/6-em)]](https://www.rsc.org/images/entities/char_2009.gif) 2, respectively.
2, respectively.
3. Computational methods
Y-doped BaZrO3 was modeled as a 3 × 3 × 3 supercell (135 atoms) containing 4 yttrium acceptors and 2 oxygen vacancies for charge neutrality, corresponding to a dopant concentration of approx. 15% (denoted as BZY15). Interactions between and
and  were thereby taken into account for a specific configuration of the highly doped material. The binding energies between isolated defects were calculated based on the single fully ionized defects in 4 × 4 × 4 supercells. The BZY15 cell was constructed with a pair of
  on next neighbor sites and two
  on second next neighbor sites. Based on the calculated association energy between isolated
  and
and  of −0.29 eV, the two charge-compensating
  were placed in the most stable neighboring sites to
  . The same procedure was followed for introducing additional barium Schottky defect pairs, or the introduction of two
  and removal of the least stable
  , according to eqn (1) and (2), respectively. The tendency of the defects to segregate to the surface was investigated using 11-layer (0 0 1) BaO-terminated slabs with 3 × 3 expansion perpendicular to the surface. Defect segregation energies were calculated as the total energy difference between charge neutral cells with the defects residing in the bulk and surface regions, respectively. The entropies of reactions (1) and (2) were estimated from the tabulated entropies of CO2 and the defect-free solid phases.39,40
The DFT calculations were performed with VASP41 based on the projector-augmented wave (PAW) method42 and the generalized gradient approximation (GGA) functional proposed by Perdew, Burke and Ernzerhof.43 Geometric optimization of the Y-doped supercell was performed with a 500 eV plane-wave energy cut-off and the subsequent calculations of the Ba-deficient cells were performed with fixed lattice parameters to represent bulk continuation to the surface. A 2 × 2 × 2 Monkhorst–Pack scheme was used for k-point sampling of the supercells.44 The ionic positions were relaxed until the residual forces were within 0.05 eV Å−1, while the self-consistent electronic optimization was performed with an energy convergence criterion of 10−6 eV. Core level shifts for Y 3d in the different configurations and clusters were obtained according to the initial state approximation as implemented in VASP.
4. Results
4.1 Formation of BaCO3
The extent of BaCO3 formation on the surface of BZ and BZY samples after annealing in CO2 at 650 °C for 10 to 1000 h was investigated by GIXRD and SEM. Fig. 1a and b show the GIXRD patterns of the pristine and annealed specimens. For both compositions, reflections corresponding to BaCO3 (Pmcn) appear after annealing, and the amount of BaCO3 increases with annealing time. On the other hand, there is no clear evidence of formation of ZrO2 other than possibly small amounts for the BZY10 sample after 1000 h. Based on the relative intensities of the main reflections, the formation of BaCO3 was more prominent in the Y-doped composition. As shown in the insets, there is a continuous shift of the BZ and BZY Bragg reflections towards smaller lattice parameters with increasing annealing time and BaCO3 formation. Fig. 1c and d show the surface of BZY10 before and after exposure to CO2 at 650 °C for 10 h. Crystals of BaCO3 were formed on the surface by exposure to CO2, resulting in a rough surface. The average size of the crystals was about 4 μm.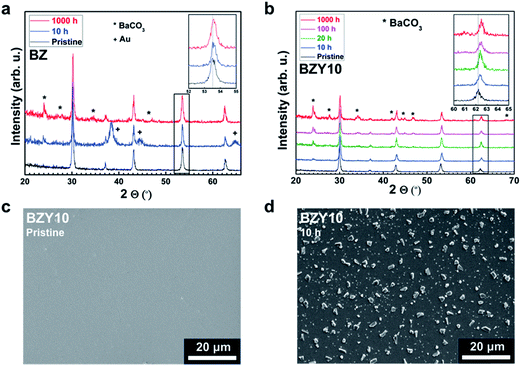 | ||
| Fig. 1 GIXRD patterns of BZ (a) and BZY10 (b) after CO2 exposure at 650 °C for 10–1000 h, and SEM micrographs of the BZY10 surface before (c) and after exposure to CO2 at 650 °C for 10 h (d). | ||
4.2 Cation depth profiles
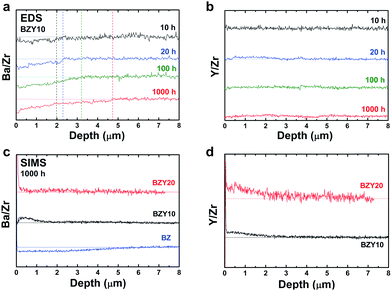
Fig. 2a and b show cross-sectional EDS line scans of BZY10 as a function of depth from the surface for different annealing times normalized to the Zr-signal. The barium line scans show a clear deficiency towards the surface, which increases with increasing annealing time. The yttrium concentration profile in Fig. 2b appears relatively constant throughout the analyzed region with no significant variations as a function of annealing time. The same result was observed when Y was normalized to the nominal B-site ratio, i.e., Y/(Zr + Y) ratio (not shown).SIMS analyses were performed on the BZ and BZY samples annealed in CO2 at 650 °C for 1000 h. The depth profiles of the elements normalized to Zr intensity are given in Fig. 2c and d. According to these profiles, the BZ sample exhibits Ba-deficiency at the surface, while BZY10 and BZY20 seem to be quite stoichiometric. However, considering Y-segregation to the surface region shown in Fig. 2b, the normalization to Zr does not reveal a consistent A/B-ratio due to the change in all of the elements from the surface towards the bulk.
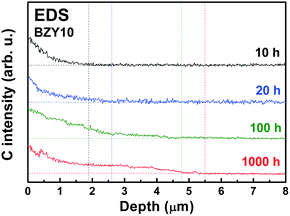
The carbon concentration profiles in BZY10 are shown in Fig. 3. The amount and depth of carbon increase as a function of annealing time in CO2. Due to the low atomic number, the carbon intensities were quite low compared to the intensities of Ba, Y and Zr.
4.3 TEM investigation of the surface microstructure and phases
TEM was used to perform microstructure and phase characterization and in particular to investigate possible formation of secondary phases at the surface. Fig. 4 shows a surface cross-sectional TEM image of BZY20 annealed for 1000 h in CO2 at 650 °C, and electron diffraction patterns from the surface region and 150 nm into the bulk. The grains corresponding to BaCO3 are clearly visible on the surface. Other secondary phases like ZrO2 or Y2O3 were not observed.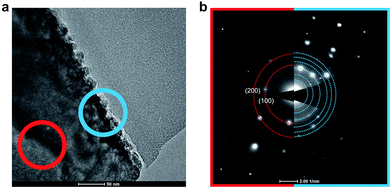 | ||
| Fig. 4 TEM cross-sectional image of the surface of BZY20 (a) and diffraction patterns from the surface and bulk (b). | ||
The bulk (red) diffraction pattern shows the 〈100〉 zone axis of the BZY perovskite structure (Pm![[3 with combining macron]](https://www.rsc.org/images/entities/char_0033_0304.gif) m) with a lattice parameter of 4.1 Å. The diffraction pattern from the surface (blue) shows the same crystal structure, albeit with a slightly increased lattice parameter of 4.4 Å, in addition to diffraction patterns from BaCO3 and/or Ba(OH)2. The increase in the BZY lattice parameter might suggest a higher Y concentration in the top 150 nm. However, no difference in Y concentration was detected by EDS. One might speculate whether the apparent increase in C content towards the surface observed by EDS profiling may reflect interstitial carbon species and associated defects that expand the lattice. In this respect, DFT calculations have shown that carbon interstitials can be stabilized as carbonate species in either Ba- or Zr-vacancies in BaZrO3.22 While their equilibrium concentrations were determined to be negligible in the acceptor doped material, the reaction may be facilitated by pre-existing cation vacancies as has been shown for dissolution of interstitial Ni into BaZrO3 from NiO.45
m) with a lattice parameter of 4.1 Å. The diffraction pattern from the surface (blue) shows the same crystal structure, albeit with a slightly increased lattice parameter of 4.4 Å, in addition to diffraction patterns from BaCO3 and/or Ba(OH)2. The increase in the BZY lattice parameter might suggest a higher Y concentration in the top 150 nm. However, no difference in Y concentration was detected by EDS. One might speculate whether the apparent increase in C content towards the surface observed by EDS profiling may reflect interstitial carbon species and associated defects that expand the lattice. In this respect, DFT calculations have shown that carbon interstitials can be stabilized as carbonate species in either Ba- or Zr-vacancies in BaZrO3.22 While their equilibrium concentrations were determined to be negligible in the acceptor doped material, the reaction may be facilitated by pre-existing cation vacancies as has been shown for dissolution of interstitial Ni into BaZrO3 from NiO.45
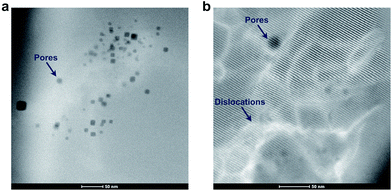
In Fig. 5a, a magnified high angled annular dark field (HAADF) STEM image shows that smaller pores of 5–20 nm were present inside the grains near the surface of BZY20 annealed for 1000 h in CO2 at 650 °C. This is also shown in Fig. 5b, in addition to structural dislocations. These nanoscopic voids exhibit high surface energies and cannot be expected to be stable after sintering of the material, and it is reasonable to assume that they may have been formed during the annealing in CO2. This can point to reaction (2), which involves consumption of BaZrO3 formula units, rather than reaction (1) which involves formation of Ba-deficient BZY. Additional HAADF images and electron energy loss spectroscopy (EELS) characterization are provided in the ESI.†
4.4 XPS and computational analyses of chemical states
XPS was performed to characterize changes in the chemical state of Y in the BZY samples after reaction with CO2 to emulate possible formation of according to reaction (2). The XPS spectra of Ba 4d and Y 3d are compared for BZY10 and BZY20 annealed in CO2 for 100 h and 1000 h in Fig. 6. The bulk spectra were taken from the annealed samples (1000 h) fractured under vacuum, and they may have been affected by long-range diffusion processes during the annealing although the main changes in stoichiometry were observed within 10 μm from the surface based on the EDS and SIMS profiles. The Ba 4d peak shows that at least two chemical states are present (Fig. 6a). The lower binding energy (BE) peak can be related to BZY while the higher BE peak is typical of BaCO3 and Ba(OH)2. The intensity of the latter peak clearly increases with exposure time to CO2, well in agreement with the BaCO3 formation on the surface of BZY10 samples as detected by GIXRD and EELS (Fig. S2†). The Zr element is quite stable in CO2 atmosphere, showing the unchanged position of Zr 3d peaks with increasing exposure time (Fig. S3†). On the other hand, the Y 3d peak shows a complex structure that changes with increasing time of CO2 exposure (Fig. 6b and c). Two spin–orbit pairs describing at least two different chemical states were required for a satisfactory fitting of the Y 3d energy region. The spin–orbit pair at the highest BE exhibited a core level shift of about 2.5 eV relative to the pair at the lowest BE for BZY10. In the case of BZY20, the core level shift was quite similar for the bulk, while it decreased to about 1.6 eV after exposure to CO2 (Fig. 6c). The peak intensities for the chemical state at lower BE decreased with CO2 exposure time in favor of the chemical state at higher BE (particularly evident for BZY20).
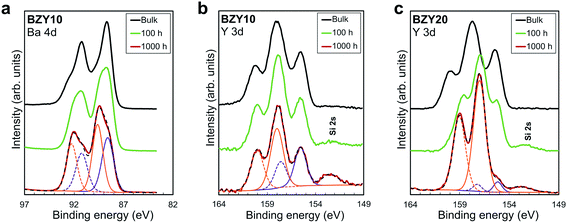 | ||
| Fig. 6 High resolution XPS (a) BZY10 Ba 4d, (b) BZY10 Y 3d and (c) BZY20 Y 3d spectra for the bulk (black), and the surface of the 100 h (green) and 1000 h (red) annealed samples. | ||
The relative Y 3d core level shift of various Y defects and clusters was investigated computationally for comparison with results from XPS. Fig. 7 shows several configurations of  (Fig. 7b–d) and
  (Fig. 7e–g) with the calculated Y 3d core level shifts (Δ) relative to the fully coordinated
  octahedra (Fig. 7a). The Y 3d core level shift for
  associated with a protonic defect, a nearest neighbor
  and/or an oxygen vacancy was 0.18–0.88 eV to higher binding energy relative to the isolated
  . In comparison, the core level shift for
  was more significant, 2.21–2.40 eV towards higher binding energy. Similar Y 3d core level shifts were obtained for
  and
and  defects and clusters on the (0 0 1) BaO-terminated surface, i.e., there was no significant difference between the core level shifts for the bulk and surface.
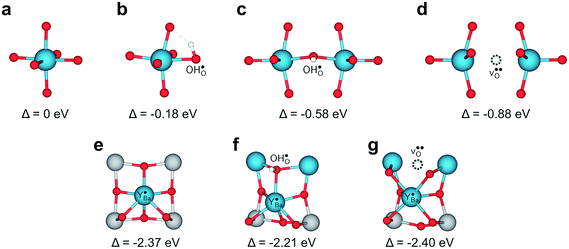 | ||
Fig. 7 Local structural environment and Y 3d core level shift (Δ) for various configurations of  (a–d) and (a–d) and  (e–g) from 3 × 3 × 3 supercells. (e–g) from 3 × 3 × 3 supercells. | ||
Despite the rather large difference in size between Y and 12-coordinated Ba,  attained a 6-coordinated configuration by relaxing towards the edge (Fig. 7f) or face (Fig. 7g) of the unit cell. The resulting Y–O bond lengths, 2.3–2.4 Å, were similar to those for the various configurations of
  , 2.1–2.3 Å. Notably, the local structure surrounding
  resembled that of Y2O3 (Ia
![[3 with combining macron]](https://www.rsc.org/images/entities/char_0033_0304.gif) ) comprising distorted YO6 octahedra and three-coordinated oxide ions similar to Fig. 7e–g. Overall, Y exhibited distinctly different 3d core level shifts when substituted on the Ba and Zr-sites in BaZrO3: 0–0.88 eV to higher binding energy for
) comprising distorted YO6 octahedra and three-coordinated oxide ions similar to Fig. 7e–g. Overall, Y exhibited distinctly different 3d core level shifts when substituted on the Ba and Zr-sites in BaZrO3: 0–0.88 eV to higher binding energy for  and about 2.3 eV to higher binding energy for
  . The difference in chemical shift of 1.4–2.3 eV between
  and
and  species corresponds well with the separation of about 1.6–2.5 eV observed by XPS. In the case of dehydrated materials due to dry atmosphere, and a relatively low concentration of oxygen vacancies due to reaction (2), the calculated shift would be closer to 2.4 eV (Fig. 7a and e).
4.5 DFT calculations of reaction thermodynamics
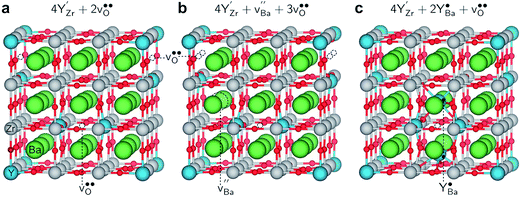
DFT calculations were used to calculate and compare the enthalpy of reactions (1) and (2), while the reaction entropies were estimated from the tabulated entropies of CO2 and the solid phases. The relaxed structures of the computational cells with an optimized configuration of additional defects are shown in Fig. 8. The BZY15 reference cell, shown in Fig. 8a, contains one oxygen vacancy in between two nearest-neighbor , i.e., (YZr–vO–YZr)×, and one oxygen vacancy associated with a single
  .
.
The cell in Fig. 8b contains a Schottky pair where the most favored site for  was adjacent to the (YZr–vO–YZr)× complex, with the oxygen vacancies associated with the remaining fully coordinated
  . The cell in Fig. 8c contains two
  , both of which were found to be most stable adjacent to (YZr–vO–YZr)×.
The total energy differences between the cells in Fig. 8b and c with respect to the reference cell in Fig. 8a were used to evaluate the enthalpies of reactions (1) and (2). Table 1 shows the calculated Gibbs energies for the reactions at 650 °C based on cells containing different amounts of defects as indicated by the degree of Ba-deficiency, x. While the obtained Gibbs energy of reaction (1) was positive for all the considered cells and configurations, it was significantly lower and close to zero for reaction (2). This indicates that reaction (2) involving formation of BaCO3 by accommodating Ba-deficiency and Y-enrichment in the bulk perovskite structure – and hence consumption of BaZrO3 – can occur to a significant extent at 650 °C in 1 atm CO2.
The tendency of yttrium to segregate to the surface was evaluated for BaO-terminated (0 0 1). The calculated segregation energy of  was −0.33 eV, indicating a considerable stabilization of the defect at the surface, shown in Fig. S4 (ESI†). The segregation energy for an additional
  to the
  at the surface was −0.50 eV, resulting in an overall segregation energy of −0.82 eV for the associated defect pair from the bulk to the surface (see the ESI† for additional details).
5. Discussion
Observations by several techniques (SEM, TEM, and GIXRD) show that BaCO3 crystallites form on the surfaces of BZ and BZY after annealing in 1 atm CO2 at 650 °C. The amount of BaCO3 increases with annealing time from 10 to 1000 h and it becomes larger for Y-doped compositions. The surface becomes Ba-deficient based on SIMS and SEM-EDS analysis of BZ and BZY, respectively (it is difficult to assess Ba-stoichiometry in BZY by SIMS since there is no constant reference due to simultaneous changes in the Y and Zr contents). The Ba-deficiency reaches several micrometers into the material, and it is likely that Ba is transported along grain boundaries.46 Moreover, the corresponding carbon profile from SEM-EDS indicates BaCO3 formation along grain boundaries and/or dissolution of carbon species into the perovskite.The BZY s-urfaces become enriched in Y as indicated by SIMS and XPS, and the Y-enrichment appears to extend several micrometers into the material, i.e., similar to the corresponding deficiency in Ba. XPS shows two distinctly different chemical states of Y, which based on DFT calculations were identified as Y substituted on the A-site,  , and B-site,
  , respectively. Furthermore, the DFT calculations indicate that these Y-species tend to cluster, both in the bulk and at the surface. The resulting local enrichment in Y becomes structurally similar to Y2O3 and may explain previous observations of Y-rich regions within BZY grains.35–37 The change in stoichiometry near the surface is accompanied by a substantial increase in the lattice parameter of the remaining perovskite, as observed by TEM.
All in all, formation of BaCO3 on BZY in CO2 atmosphere at 650 °C appears to mainly proceed according to reaction (2), in which  ends up as a charge compensating donor,
  , while a BaZrO3 formula unit is consumed. The latter fits with the observation of small intragrain pores by TEM and the general absence of Y2O3 or ZrO2 secondary phases. In comparison to BZ, where BaCO3 formation is lower, the Y-dopant thereby provides an extra compositional degree of freedom that facilitates BaCO3 formation according to reaction (2).
Now, the question is to what extent the formation of BaCO3 by reaction (2) will proceed. Under the conditions used it is possible that it will proceed until complete decomposition to BaCO3 and for instance Y-saturated ZrO2 and Zr-saturated Y2O3. This process will take thousands of hours to complete, while larger BZY grains will probably retard the transport of Ba to the surface and hence also the decomposition and degradation. Another alternative is that it stops at equilibrium when a certain content of  is reached. The observation that there is a certain Ba-deficiency and Y excess quite far into the material – instead of complete decomposition at the very surface – may support this alternative. These and other degradation paths could be studied by the reaction between for instance BaCO3 and YSZ in 1 atm CO2.
In any case, while we have shown that BZY suffers from severe BaCO3 formation in 1 atm CO2 and probably degradation of its functional and thermomechanical properties, many applications of BZY electrolytes may not be significantly affected. Lower CO2 partial pressures or impurity levels of CO2 should mitigate the degradation processes in hydrogen fuel cells and steam electrolyzers. However, such devices operating at steam pressures within the stability regime of Ba(OH)2 may exhibit similar degradation phenomena and mechanisms as we have observed here.47
A recent study on CO2 and H2O coadsorption has shown preferential adsorption of H2O on BZY and indicated that the presence of H2O prevents the formation of a carbonate overlayer on BZY surfaces.48 For applications with high CO2 partial pressures due reforming of hydrocarbons, the presence of steam may therefore limit the BaCO3 formation and the associated degradation processes. Further degradation studies should therefore take into account both CO2 and H2O. Temperatures lower than 650 °C are desirable for many applications of BZY, which worsens the thermodynamics of stability but slows down diffusion, so the effect of temperature may go both ways.
6. Conclusions
Over a time-scale of 1000 h, BaZr1−xYxO3−δ (x = 0–0.2) ceramics exhibit severe degradation under 1 atm CO2 at 650 °C due to formation of BaCO3 on the surfaces and possibly along the grain boundaries, accompanied by Ba-deficiency in the subsurface regions. For the Y-doped compositions, the surface and subsurface become enriched in Y, which may be ascribed to a degradation reaction in which Y ends up on the Ba-site while BaZrO3 formula units are consumed. Accordingly, the degradation proceeds faster with Y as an additional compositional degree of freedom and a more favourable degradation reaction. The local enrichment of Y both in the bulk and on the surface attains a structure similar to Y2O3. Electrochemical devices based on Y-doped BaZrO3 electrolytes may be stable towards BaCO3 formation under lower CO2 partial pressures and/or in the presence of H2O, while further work is necessary to be conclusive.Conflicts of interest
There are no conflicts to declare.Acknowledgements
Financial support from The Research Council of Norway under the program NANO2021 to the project “Functional oxides for clean energy technologies: fuel cells, gas separation membranes and electrolysers” (FOXCET, 228355) conducted by SINTEF, University of Oslo and The Norwegian University of Science and Technology (NTNU), is gratefully acknowledged in addition to FME NCCS (257579). Computational resources were provided by the Norwegian Metacenter for Computational Science (NOTUR) under the project nn9259k.References
- J. W. Phair and S. P. S. Badwal, Materials for separation membranes in hydrogen and oxygen production and future power generation, Sci. Technol. Adv. Mater., 2006, 7, 792–805 CrossRef CAS.
- D. A. Medvedev, J. G. Lyagaeva, E. V. Gorbova, A. K. Demin and P. Tsiakaras, Advanced materials for SOFC application: Strategies for the development of highly conductive and stable solid oxide proton electrolytes, Prog. Mater. Sci., 2016, 75, 38–79 CrossRef CAS.
- N. Kochetova, I. Animitsa, D. Medvedev, A. Demin and P. Tsiakaras, Recent activity in the development of proton-conducting oxides for high-temperature applications, RSC Adv., 2016, 6, 73222–73268 RSC.
- J. A. Kilner and M. Burriel, Materials for Intermediate-Temperature Solid-Oxide Fuel Cells, Annu. Rev. Mater. Res., 2014, 44, 365–393 CrossRef CAS.
- J. D. Baniecki, M. Ishii, K. Kurihara, K. Yamanaka, T. Yano, K. Shinozaki, T. Imada, K. Nozaki and N. Kin, Photoemission and quantum chemical study of SrTiO3(001)surfaces and their interaction with CO2, Phys. Rev. B: Condens. Matter Mater. Phys., 2008, 78, 195415 CrossRef.
- J. LÜ, L. Wang, L. Fan, Y. Li, L. Dai and H. Guo, Chemical stability of doped BaCeO3-BaZrO3 solid solutions in different atmospheres, J. Rare Earths, 2008, 26, 505–510 CrossRef.
- X. Ma, J. Dai, H. Zhang and D. E. Reisner, Protonic conductivity nanostructured ceramic film with improved resistance to carbon dioxide at elevated temperatures, Surf. Coat. Technol., 2005, 200, 1252–1258 CrossRef CAS.
- C. S. Tu, R. R. Chien, V. H. Schmidt, S. C. Lee, C. C. Huang and C. L. Tsai, Thermal stability of Ba(Zr0.8−xCexY0.2)O2.9 ceramics in carbon dioxide, J. Appl. Phys., 2009, 105, 103504 CrossRef.
- N. Zakowsky, S. Williamson and J. Irvine, Elaboration of CO2 tolerance limits of BaCe0.9Y0.1O3–δ electrolytes for fuel cells and other applications, Solid State Ionics, 2005, 176, 3019–3026 CrossRef CAS.
- D. Medvedev, J. Lyagaeva, S. Plaksin, A. Demin and P. Tsiakaras, Sulfur and carbon tolerance of BaCeO3–BaZrO3 proton-conducting materials, J. Power Sources, 2015, 273, 716–723 CrossRef CAS.
- A. Brandão, J. F. Monteiro, A. V. Kovalevsky, D. P. Fagg, V. V. Kharton and J. R. Frade, Guidelines for improving resistance to CO2 of materials for solid state electrochemical systems, Solid State Ionics, 2011, 192, 16–20 CrossRef.
- P. Duran, J. Tartaj and C. Moure, Sintering behaviour and microstructural evolution of agglomerated spherical particles of high-purity barium titanate, Ceram. Int., 2003, 29, 419–425 CrossRef CAS.
- B.-K. Yoon, E.-Y. Chin and S.-J. L. Kang, Dedensification During Sintering of BaTiO3 Caused by the Decomposition of Residual BaCO3, J. Am. Ceram. Soc., 2008, 91, 4121–4124 CrossRef CAS.
- I. Antunes, A. Brandão, F. M. Figueiredo, J. R. Frade, J. Gracio and D. P. Fagg, Mechanosynthesis of nanopowders of the proton-conducting electrolyte material Ba(Zr,Y)O3−δ, J. Solid State Chem., 2009, 182, 2149–2156 CrossRef CAS.
- K. D. Kreuer, Proton-Conducting Oxides, Annu. Rev. Mater. Res., 2003, 33, 333–359 CrossRef CAS.
- H. Malerød-Fjeld, D. Clark, I. Yuste-Tirados, R. Zanón, D. Catalán-Martinez, D. Beeaff, S. H. Morejudo, P. K. Vestre, T. Norby, R. Haugsrud, J. M. Serra and C. Kjølseth, Thermo-electrochemical production of compressed hydrogen from methane with near-zero energy loss, Nat. Energy, 2017, 2, 923–931 CrossRef.
- S. H. Morejudo, R. Zanon, S. Escolastico, I. Yuste-Tirados, H. Malerod-Fjeld, P. K. Vestre, W. G. Coors, A. Martinez, T. Norby, J. M. Serra and C. Kjolseth, Direct conversion of methane to aromatics in a catalytic co-ionic membrane reactor, Science, 2016, 353, 563–566 CrossRef CAS PubMed.
- D. Han, K. Kishida, K. Shinoda, H. Inui and T. Uda, A comprehensive understanding of structure and site occupancy of Y in Y-doped BaZrO3, J. Mater. Chem. A, 2013, 1, 3027 RSC.
- M. A. Laguna-Bercero, Recent advances in high temperature electrolysis using solid oxide fuel cells: a review, J. Power Sources, 2012, 203, 4–16 CrossRef CAS.
- D. Medvedev, A. Murashkina, E. Pikalova, A. Demin, A. Podias and P. Tsiakaras, BaCeO3: Materials development, properties and application, Prog. Mater. Sci., 2014, 60, 72–129 CrossRef CAS.
- J.-W. Jhuang, K.-R. Lee, J.-k. Chang, C.-T. Shen, Y.-H. Lee, S.-W. Lee and C.-J. Tseng, Chemical stability and electrical and mechanical properties of BaZrxCe0.8−xY0.2O3 with CeO2 protection method, Int. J. Hydrogen Energy, 2017, 42, 22259–22265 CrossRef CAS.
- F. Trobec and V. Thangadurai, Transformation of proton-conducting Perovskite-type into fluorite-type fast oxide ion electrolytes using a CO2 capture technique and their electrical properties, Inorg. Chem., 2008, 47, 8972–8984 CrossRef CAS PubMed.
- A. L. Cabrera, F. Vargas and R. A. Zarate, Adsorption of carbon dioxide by barium titanate: Evidence of adsorption process mediated by a dipole-dipole interaction, J. Phys. Chem. Solids, 1994, 55, 1303–1307 CrossRef CAS.
- C. Duan, R. J. Kee, H. Zhu, C. Karakaya, Y. Chen, S. Ricote, A. Jarry, E. J. Crumlin, D. Hook, R. Braun, N. P. Sullivan and R. O'Hayre, Highly durable, coking and sulfur tolerant, fuel-flexible protonic ceramic fuel cells, Nature, 2018, 557, 217–222 CrossRef CAS PubMed.
- M. Kogler, E. M. Kock, T. Bielz, K. Pfaller, B. Klotzer, D. Schmidmair, L. Perfler and S. Penner, Hydrogen Surface Reactions and Adsorption Studied on Y2O3, YSZ, and ZrO2, J. Phys. Chem. C, 2014, 118, 8435–8444 CrossRef CAS PubMed.
- E. M. Kock, M. Kogler, T. Bielz, B. Klotzer and S. Penner, In Situ FT-IR Spectroscopic Study of CO2 and CO Adsorption on Y2O3, ZrO2, and Yttria-Stabilized ZrO2, J. Phys. Chem. C, 2013, 117, 17666–17673 CrossRef PubMed.
- E. M. Kock, M. Kogler, T. Gotsch, B. Klotzer and S. Penner, Structural and chemical degradation mechanisms of pure YSZ and its components ZrO2 and Y2O3 in carbon-rich fuel gases, Phys. Chem. Chem. Phys., 2016, 18, 14333–14349 RSC.
- M. Kogler, E.-M. Köck, B. Klötzer, L. Perfler and S. Penner, Surface Reactivity of YSZ, Y2O3, and ZrO2 toward CO, CO2, and CH4: A Comparative Discussion, J. Phys. Chem. C, 2016, 120, 3882–3898 CrossRef CAS.
- K. H. Ryu and S. M. Haile, Chemical stability and proton conductivity of doped BaCeO3–BaZrO3 solid solutions, Solid State Ionics, 1999, 125, 355–367 CrossRef CAS.
- E. Fabbri, A. D'Epifanio, E. Di Bartolomeo, S. Licoccia and E. Traversa, Tailoring the chemical stability of Ba(Ce0.8−xZrx)Y0.2O3−δ protonic conductors for Intermediate Temperature Solid Oxide Fuel Cells (IT-SOFCs), Solid State Ionics, 2008, 179, 558–564 CrossRef CAS.
- J. M. Polfus, B. Yildiz, H. L. Tuller and R. Bredesen, Adsorption of CO2 and Facile Carbonate Formation on BaZrO3 Surfaces, J. Phys. Chem. C, 2018, 122, 307–314 CrossRef CAS.
- R. Sažinas, C. Bernuy-López, M. A. Einarsrud and T. Grande, Effect of CO2 Exposure on the Chemical Stability and Mechanical Properties of BaZrO3-Ceramics, J. Am. Ceram. Soc., 2016, 99, 3685–3695 CrossRef.
- F. A. Kröger and H. J. Vink, Relations between the Concentrations of Imperfections in Crystalline Solids, Solid State Phys., 1956, 3, 307–435 Search PubMed.
- I. Kaus, K. Wiik, B. Krogh, M. Dahle, K. H. Hofstad and S. Aasland, Stability of SrFeO3-Based Materials in H2O/CO2-Containing Atmospheres at High Temperatures and Pressures, J. Am. Ceram. Soc., 2007, 90, 2226–2230 CrossRef CAS.
- Y. Yamazaki, R. Hernandez-Sanchez and S. M. Haile, Cation non-stoichiometry in yttrium-doped barium zirconate: phase behavior, microstructure, and proton conductivity, J. Mater. Chem., 2010, 20, 8158 RSC.
- A. K. Azad, C. Savaniu, S. Tao, S. Duval, P. Holtappels, R. M. Ibberson and J. T. S. Irvine, Structural origins of the differing grain conductivity values in BaZr0.9Y0.1O2.95 and indication of novel approach to counter defect association, J. Mater. Chem., 2008, 18, 3414 RSC.
- F. Giannici, M. Shirpour, A. Longo, A. Martorana, R. Merkle and J. Maier, Long-Range and Short-Range Structure of Proton-Conducting Y: BaZrO3, Chem. Mater., 2011, 23, 2994–3002 CrossRef CAS.
- R. Sažinas, M. A. Einarsrud and T. Grande, Toughening of Y-doped BaZrO3 proton conducting electrolytes by hydration, J. Mater. Chem. A, 2017, 5, 5846–5857 RSC.
- M. Chase, NIST-JANAF Thermochemical Tables, J. Phys. Chem. Ref. Data. Monograph, 4th edn, 1998, p. 1952 Search PubMed.
- K. Kurosaki, R. J. M. Konings, F. Wastin and S. Yamanaka, The low-temperature heat capacity and entropy of SrZrO3 and BaZrO3, J. Alloys Compd., 2006, 424, 1–3 CrossRef CAS.
- G. Kresse and D. Joubert, From ultrasoft pseudopotentials to the projector augmented-wave method, Phys. Rev. B: Condens. Matter Mater. Phys., 1999, 59, 1758–1775 CrossRef CAS.
- P. E. Blöchl, Projector augmented-wave method, Phys. Rev. B: Condens. Matter Mater. Phys., 1994, 50, 17953–17979 CrossRef.
- J. P. Perdew, K. Burke and M. Ernzerhof, Generalized Gradient Approximation Made Simple, Phys. Rev. B: Condens. Matter Mater. Phys., 1996, 77, 3865–3868 CAS.
- H. J. Monkhorst and J. D. Pack, Special points for Brillouin-zone integrations, Phys. Rev. B: Condens. Matter Mater. Phys., 1976, 13, 5188–5192 CrossRef.
- J. M. Polfus, M.-L. Fontaine, A. Thøgersen, M. Riktor, T. Norby and R. Bredesen, Solubility of transition metal interstitials in proton conducting BaZrO3 and similar perovskite oxides, J. Mater. Chem. A, 2016, 4, 8105–8112 RSC.
- R. Sažinas, I. Sakaguchi, I. Hasle, J. M. Polfus, R. Haugsrud, M. A. Einarsrud and T. Grande, Tracer diffusion of 96Zr and 134Ba in polycrystalline BaZrO3, Phys. Chem. Chem. Phys., 2017, 19, 21878–21886 RSC.
- A. Slodczyk, M. D. Sharp, S. Upasen, P. Colomban and J. A. Kilner, Combined bulk and surface analysis of the BaCe0.5Zr0.3Y0.16Zn0.04O3−δ (BCZYZ) ceramic proton-conducting electrolyte, Solid State Ionics, 2014, 262, 870–874 CrossRef CAS.
- J. M. Polfus, J. Yang and B. Yildiz, Interplay between H2O and CO2 coadsorption and space-charge on Y-doped BaZrO3 surfaces, J. Mater. Chem. A, 2018, 6, 24823–24830 RSC.
Footnote |
| † Electronic supplementary information (ESI) available. See DOI: 10.1039/c8ta11021b |
| This journal is © The Royal Society of Chemistry 2019 |

