Laser-induced breakdown spectroscopy for the quantitative measurement of lithium concentration profiles in structured and unstructured electrodes
Received
26th October 2018
, Accepted 5th February 2019
First published on 20th February 2019
Abstract
Quantitative chemical mapping of battery electrodes is a rather new post-mortem analytics method for identifying and describing chemical degradation processes in lithium-based battery systems. In consideration of future applications, the development of lithium-ion batteries is quite essential in order to meet requirements such as improved cell lifetime (>5000 cycles), high energy density at the cell level (>250 W h kg−1), reduced charging times (<15 min), high power density (>2500 W kg−1), and reduced manufacturing costs (<150 $ per kW h). One novel approach that can handle a contemporaneous enhancement of energy and power density is the development of a novel cell design, mandated in a three-dimensional (3D) arrangement. This so-called “3D battery concept” enables electrode configurations with improved lithium-ion diffusion kinetics and provides reduced mechanical stresses which could arise during battery cycling. Within this study, laser-induced breakdown spectroscopy (LIBS) was applied quantitatively as a powerful analytical tool in order to study chemical degradation mechanisms and the impact of 3D electrode architectures on lithium distribution. It could be shown so far that free-standing electrode architectures can provide new lithium-insertion pathways which enhance the capability of the electrode material to operate under abuse conditions. Elemental mapping and elemental depth-profiling were applied for characterizing the electrode as a function of cell lifetime and architecture. For the first time, it was demonstrated that LIBS can be used to quantitatively describe lithium distribution in a 3D battery with specific design parameters. Finally, new scientific findings regarding electrochemically driven degradation and aging mechanisms of laser-structured, embossed, and unstructured NMC electrodes were explored.
Introduction
Lithium-ion batteries (LIBs) provide prominent advantages and can be characterized by their high volumetric and gravimetric energy density, high power capability, high efficiency, and long cycle life.1–5 More recently, LIBs have been recommended as one of the most promising power sources for sustainable transport applications such as for hybrid electric vehicles, plug-in hybrid electric vehicles, or full electric vehicles, as well as for electrochemical storage systems in renewable energy plants.6–12 In terms of energy and power density, it was reported that lithium-ion seems to be the only energy storage technology with the potential to fulfill the future requirements of the automotive industry.13 However, it is important to emphasize that the costs and performance limitations of the present lithium-ion batteries hinder their fast implementation and acceptance in electric vehicles and their efficient use in combination with renewable energy sources.14 For these reasons, a major focus in recent research is the enhancement of battery performance by simultaneously reducing production and material costs. On the cathode side and inspired by the commercial success of Li(Ni1/3Mn1/3Co1/3)O2, scientists developed new nickel-enriched layered oxides with various chemical compositions (Li(Ni1−x−yMnxCoy)O2) for increasing the reversible capacity.15 Concurrently, the fabrication of electrodes with film thicknesses up to 320 μm was demonstrated elsewhere,16 leading to a smaller amount of inactive material, i.e., a reduced cell weight and an increased LIB energy density could be achieved. However, the application of electrodes with film thicknesses beyond the state of the art (electrode thickness >100 μm) in lithium-ion cells affects the mechanical integrity of the film and decelerates lithium-ion diffusion kinetics during electrochemical cycling.17 One promising approach for enabling battery operation with high energy and high power density at the same time is the development of an advanced three-dimensional (3D) lithium-ion electrode architecture maintaining short lithium-ion transport distances.18 The 3D battery concept enables high power and energy density, high rate capability, enhanced cycle lifetime, and reduced processing time for the cost-intensive electrolyte filling.19–21 Additionally, it is important to correlate the 3D architectures with electrochemical and chemical data. One essential electrode parameter is its porosity, which has a strong impact on cell performance, wettability, and cell degradation.22 The accurate adjustment of pore size distribution at the micro- and nano-scale and the degree of compression during calendering influence the electrical conductivity, the strength of coating adhesion between the composite material and the current collector, and finally the electrochemical performance of lithium-ion cells.22–24 In a very recent approach, it was shown that laser structuring can be applied for composite electrodes such as LiFePO4, LiMn2O4, or Li(NixMnyCoz)O2, with film thicknesses in the range of 50 to 250 μm.25–27 It could be clearly demonstrated that laser-structured electrodes can significantly improve cell lifetime, liquid electrolyte wetting behavior, specific capacity, and cycle retention. For the analysis of degradation mechanisms related to electrode topography and porosity, the investigation of lithium distribution can provide a suitable approach. For this purpose, quantitative elemental mapping and depth-profiling of the entire 3D electrode was investigated by laser-induced breakdown spectroscopy (LIBS). LIBS is an analytical tool used to obtain post-mortem information about the chemical composition of electrodes, from the surface down to the current collector interface. It has great potential to enable advanced fundamental studies on 3D electrode architectures for discovering their impact on performance enhancement regarding lifetime and capacity under abuse conditions and as a function of electrochemical cycling parameters. In the field of lithium-ion batteries, LIBS has been applied so far for studying the variations in chemical composition related to solid-state electrolytes, binder distribution in electrodes and interfacial layers.28–30 In preliminary studies the lithium distribution in thick film lithium nickel manganese cobalt oxide (Li(Ni1/3Mn1/3Co1/3)O2) electrodes is investigated post-mortem by LIBS.31,32 It could be shown that there is a change in Li distribution by introducing a 3D electrode design with free-standing micro-pillars. Nevertheless, the electrode design shown in ref. 31 was related to a real 3D electrode with close contact of the free-standing structures. The gap between two micro-pillars is about 20–40 μm which is below the lateral resolution limit of the applied LIBS configuration. Therefore, for studying the impact of the contour or sidewall of the laser generated pillars, it was necessary to move from the “real” to a “model” electrode design. In the current approach, it was possible to use LIBS to characterize single micro-pillars without having any influence on the surrounding electrode material. This finally enabled us to describe quantitatively the lithium distribution with rather high accuracy. A chemical image of NMC cathodes will be presented, covering parameters such as electrode porosity and 3D topography. To our knowledge, this is quite a new analytic approach regarding post-mortem quantitative elemental mapping and elemental depth-profiling of lithium in 3D electrode architectures for LIBs.
Experimental
Electrode fabrication
The manufacturing route to composite cathodes used in this work can be separated into four processing steps: slurry preparation, coating, drying, and calendering. Each processing step has a strong impact on the electrode quality and finally on the electrochemical performance. Slurry preparation was carried out by adjusting the weight proportion to 90 wt% of the active material lithium nickel manganese cobalt oxide (Li(NiMnCo)O2, Ni![[thin space (1/6-em)]](https://www.rsc.org/images/entities/char_2009.gif) :Mn:Co = 1:1:1, NMC, MTI Corporation, USA), 5 wt% of polyvinylidene fluoride binder (PVDF, MTI Corporation, USA) and 5 wt% of conductive additive (Timcal Super C65, MTI Corporation, USA). For the fabrication of one cathode sheet, 50 g of NMC, 2.8 g of PVDF, and 2.8 g of Timcal Super C65 were used. The active material was investigated related to its particle size distribution, offering a mean value of 9.89 μm (Laser Scattering Particle Size Analyzer LA-950, Horiba Ltd., Japan). Additionally, the active powder exhibits a BET (Brunauer–Emmett–Teller) surface area of 0.38 m2 g−1 (Gemini VII 2390 a, Micromeritics Instrument Corporation, USA) and a material density of 4.6 g cm−3. Regarding the mixing procedure, first PVDF was dissolved in 30 mL N-methyl-2-pyrrolidone (NMP) by magnetic stirring. Subsequently, NMC and Timcal Super C65 were added into the polymeric solution in the dry state. Another amount of NMP (25 mL) was added and the resulting slurry was then mixed (MSK-SFM-7, MTI Corporation, USA) in a vacuum atmosphere for two hours, indicating a homogeneous dispersion of the particles. Eventually, rheological investigation such as viscosity measurements were performed for characterizing the cathode slurry with respect to its flow behavior, coating control and avoidance of particle agglomeration. Subsequently, coating was performed using a tape-casting film coater equipped with an integrated heating lid (MSK-AFA-L800-H, MTI Corporation, USA). By adjusting the doctor blade gap, i.e., the distance between the aluminum current collector (20 μm in thickness) and the doctor blade edge, NMC thick films were fabricated with a film thickness of 140 μm ± 6 μm. In this work, a doctor blade gap of 450 μm was used. The tape-casting process was performed at room temperature by applying a constant coating speed of 10 mm s−1. Next, the wet film was dried at 70 °C in order to remove the solvent from the electrode. A porosity of 54% ± 3% could be estimated for each NMC thick film. The corresponding calculation is described elsewhere.31 Finally, the electrodes were calendered using a compact hot rolling press (Precision 4′′ Hot Rolling Press/Calender, MTI Corporation, USA) with a roll temperature of 58 °C. The rolling speed was maintained at 8 mm s−1 and the porosity of 35% ± 3% could be adjusted. NMC electrodes with a thickness of 100 μm ± 3 μm were fabricated for further investigations such as electrochemical characterization and post-mortem chemical analysis.
:Mn:Co = 1:1:1, NMC, MTI Corporation, USA), 5 wt% of polyvinylidene fluoride binder (PVDF, MTI Corporation, USA) and 5 wt% of conductive additive (Timcal Super C65, MTI Corporation, USA). For the fabrication of one cathode sheet, 50 g of NMC, 2.8 g of PVDF, and 2.8 g of Timcal Super C65 were used. The active material was investigated related to its particle size distribution, offering a mean value of 9.89 μm (Laser Scattering Particle Size Analyzer LA-950, Horiba Ltd., Japan). Additionally, the active powder exhibits a BET (Brunauer–Emmett–Teller) surface area of 0.38 m2 g−1 (Gemini VII 2390 a, Micromeritics Instrument Corporation, USA) and a material density of 4.6 g cm−3. Regarding the mixing procedure, first PVDF was dissolved in 30 mL N-methyl-2-pyrrolidone (NMP) by magnetic stirring. Subsequently, NMC and Timcal Super C65 were added into the polymeric solution in the dry state. Another amount of NMP (25 mL) was added and the resulting slurry was then mixed (MSK-SFM-7, MTI Corporation, USA) in a vacuum atmosphere for two hours, indicating a homogeneous dispersion of the particles. Eventually, rheological investigation such as viscosity measurements were performed for characterizing the cathode slurry with respect to its flow behavior, coating control and avoidance of particle agglomeration. Subsequently, coating was performed using a tape-casting film coater equipped with an integrated heating lid (MSK-AFA-L800-H, MTI Corporation, USA). By adjusting the doctor blade gap, i.e., the distance between the aluminum current collector (20 μm in thickness) and the doctor blade edge, NMC thick films were fabricated with a film thickness of 140 μm ± 6 μm. In this work, a doctor blade gap of 450 μm was used. The tape-casting process was performed at room temperature by applying a constant coating speed of 10 mm s−1. Next, the wet film was dried at 70 °C in order to remove the solvent from the electrode. A porosity of 54% ± 3% could be estimated for each NMC thick film. The corresponding calculation is described elsewhere.31 Finally, the electrodes were calendered using a compact hot rolling press (Precision 4′′ Hot Rolling Press/Calender, MTI Corporation, USA) with a roll temperature of 58 °C. The rolling speed was maintained at 8 mm s−1 and the porosity of 35% ± 3% could be adjusted. NMC electrodes with a thickness of 100 μm ± 3 μm were fabricated for further investigations such as electrochemical characterization and post-mortem chemical analysis.
Generation of free-standing architectures by ultrafast laser structuring and embossing
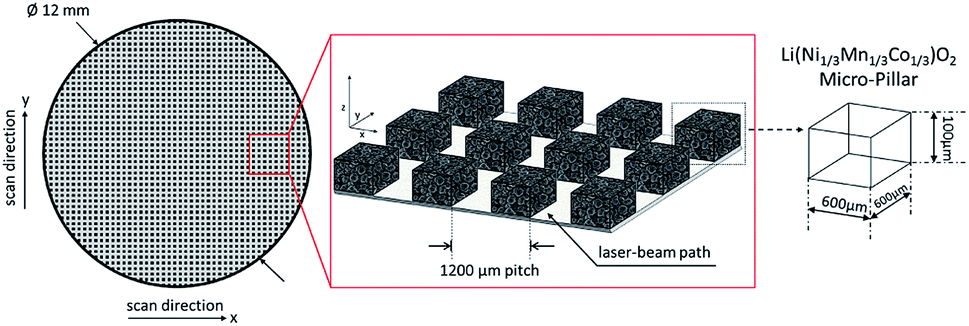
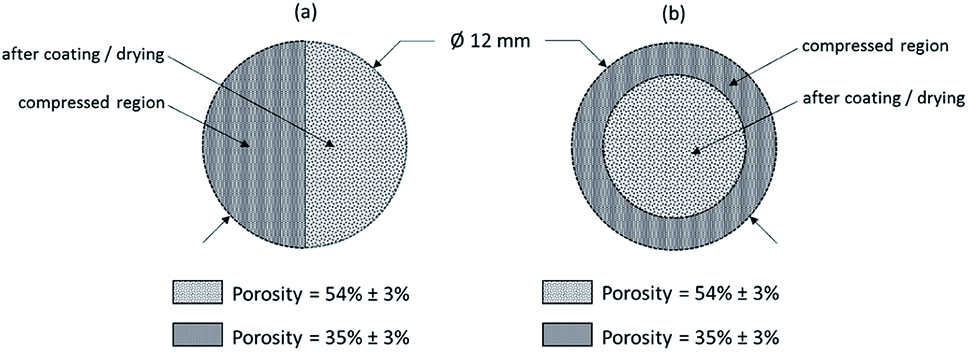
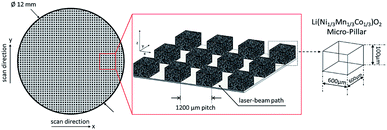
Fig. 1 shows a schematic diagram of a femtosecond laser structuring process for the generation of micro-pillars in thick film NMC electrodes. The electrodes were structured using a laser micromachining workstation (PS450-TO, Optec s.a., Belgium) equipped with an ultrafast fiber laser (Tangerine, Amplitude Systèmes, France). Free-standing micro-pillars were formed with a cubical shape of 600 μm × 600 μm × 100 μm by removing the composite material down to the current collector. During processing, the laser pulse duration was set to 380 fs. The wavelength was adjusted to 515 nm and a repetition rate of 500 kHz was applied. Free-standing micro-pillars were generated with a pitch distance of 1200 μm using an average laser power of 1.45 W. The laser beam was guided through a 3-fold beam expander and the process was carried out in air. Finally, laser-structured electrodes with a uniform porosity along the micro-pillars could be successfully manufactured. In comparison to laser ablation, embossing was supplementarily used for the adjustment of electrode porosity. During processing, an embossing tool was impressed into the manufactured electrode material (140 μm ± 6 μm) until a defined film thickness of 100 μm ± 3 μm was achieved. After relaxation, the electrodes offer porosities of 35% ± 3% and 54% ± 3%. Fig. 2 shows schematically two NMC electrodes with different geometrical arrangements. Both types of electrodes were used for studying the lithium distribution at high charging and discharging C-rates.
 |
| | Fig. 1 Schematic diagram of fs-laser generated 3D architectures (micro-pillars) in thick film NMC electrodes. | |
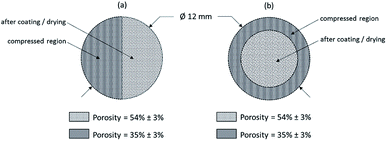 |
| | Fig. 2 Schematic diagram of NMC electrodes with variable porosity regions: (a) half-embossed NMC electrode and (b) NMC electrode with circular compression. The porosity regions were calculated to a value of 35% ± 3% (compressed region) and 54% ± 3% (after coating/drying). | |
Cell assembly
All cells were assembled in an argon-filled glove box (LABmaster sp, MBraun Inertgas-Systeme GmbH, Germany, H2O <0.1 ppm and O2 <0.1 ppm) using the Swagelok® cell design consisting of two plungers (stainless steel), three Swagelok® components (product number: SS-12M0-6, stainless steel), one spring (stainless steel), four sealing rings (polytetrafluoroethylene, PTFE), and 25 μm thick polyimide foil (PI-foil) which acts as an isolator in order to prevent a short circuit. Both electrodes, 350 μm thick metallic lithium foil (Sigma Aldrich Chemistry, USA) and the manufactured NMC thick film (MTI Corporation, USA) were placed between both plungers, separated by a 260 μm glass micro-fiber film (GF/A, GE Healthcare UK Limited, UK). The liquid electrolyte (LP30) was purchased from Sigma Aldrich Chemistry and contains a solution of one molar lithium hexafluorophosphate conducting salt (1 mol LiPF6) in ethylene carbonate (EC)/dimethyl carbonate (DMC), 1:1 by volume. Prior to cell assembly, all NMC electrodes were cut using an ultrafast laser into circular disks of 12 mm in diameter and were further dried in a vacuum oven (VT 6025, Thermo Scientific, Germany) at 120 °C for 24 h.
Electrochemical investigation
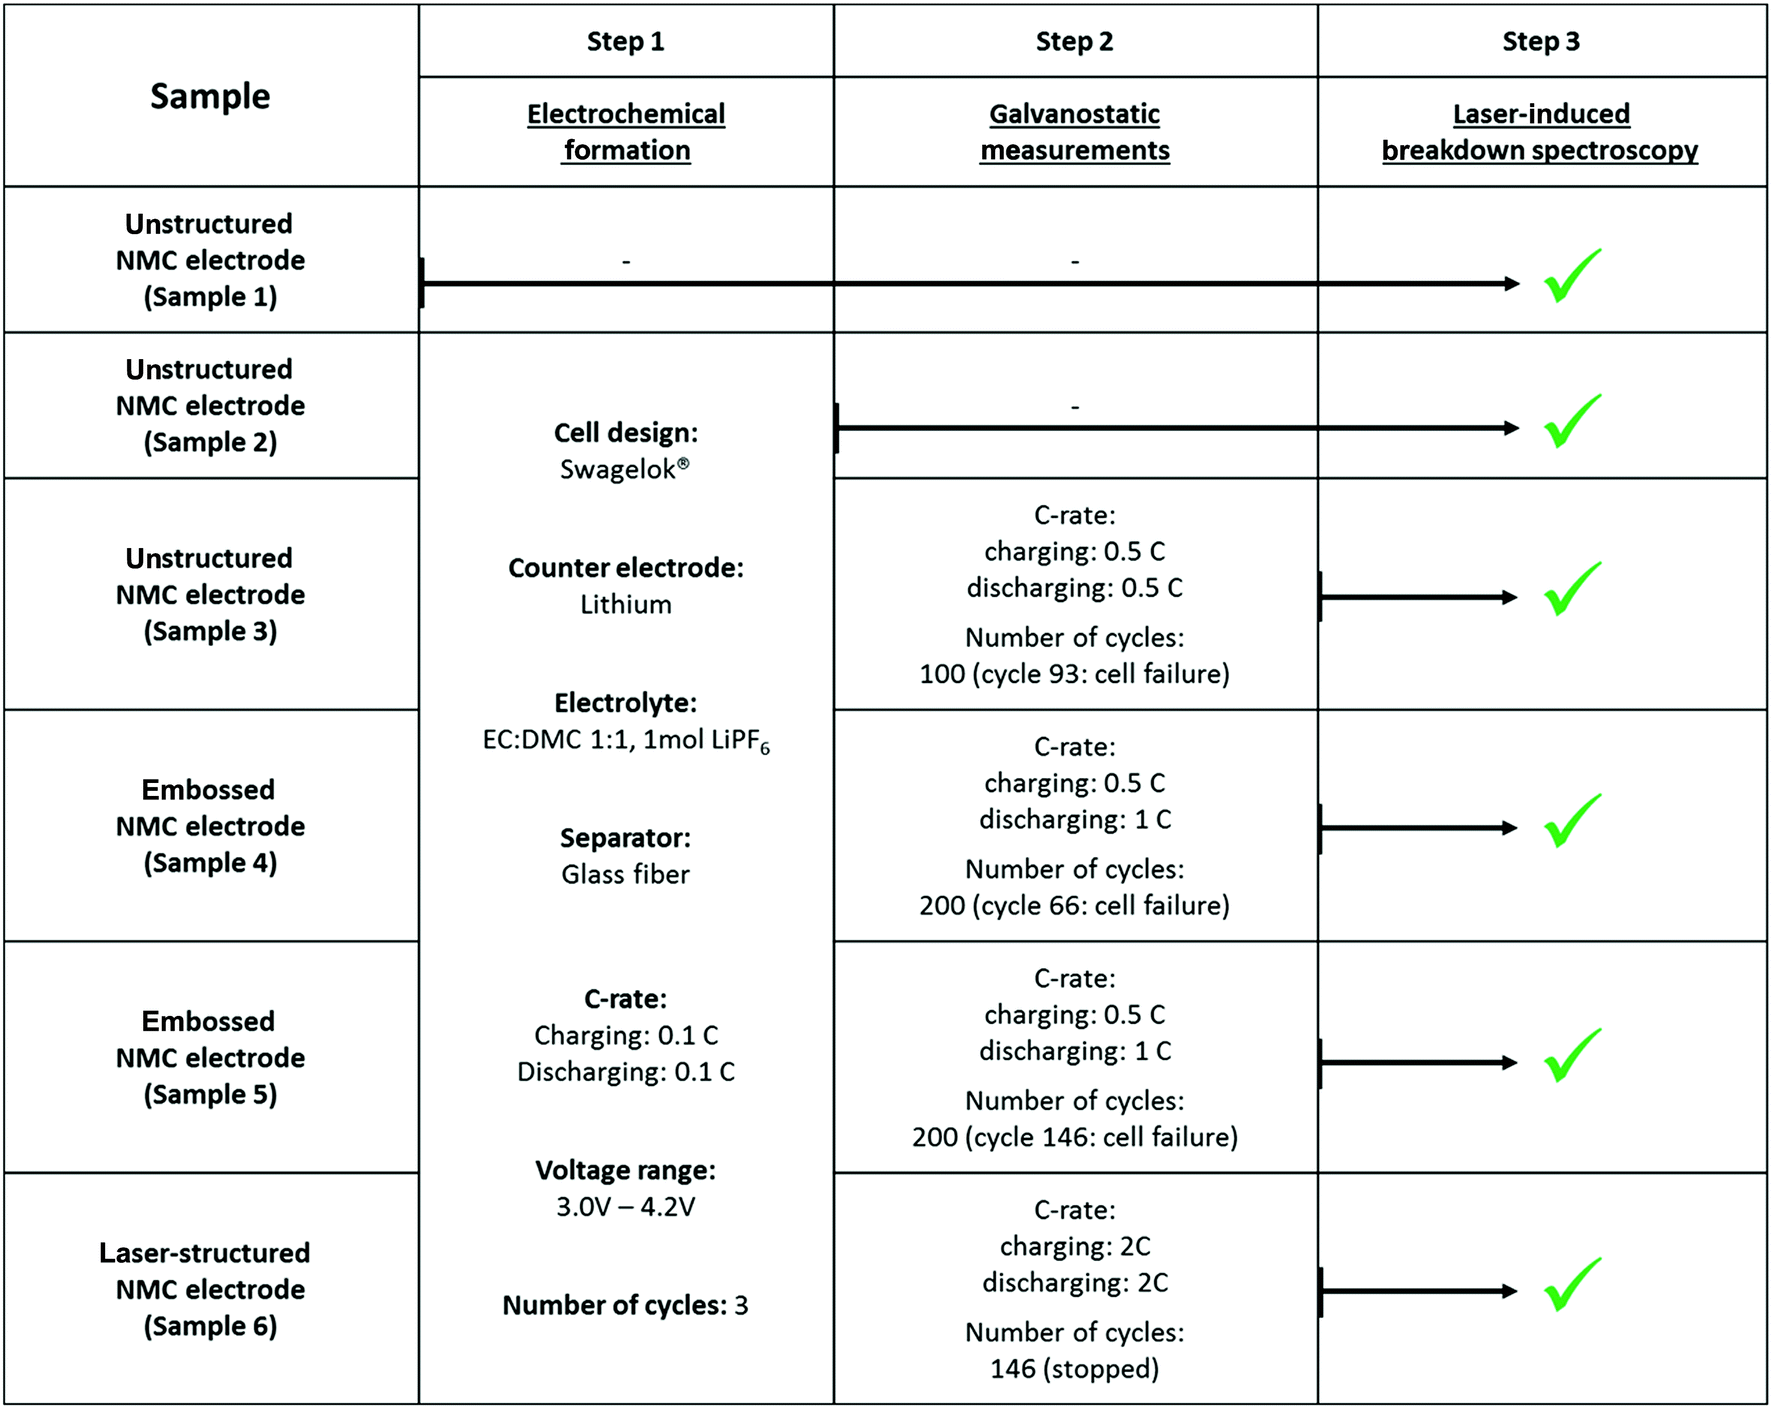
For the quantitative evaluation of the lithium concentration in unstructured, embossed, and laser-structured NMC electrodes, battery tests were carried out in a voltage range of 3.0–4.2 V using a BT2000 battery cycler (Arbin Instruments, USA). In total, five NMC electrodes with various surface topographies and porosity regions were electrochemically cycled as shown in Table 1. During the first step, electrochemical formation was performed on samples 2–6 applying a C-rate of 0.1C for three cycles. Subsequently, cells with samples 3–6 were selected for further electrochemical cycling (step 2). The C-rate for charging and discharging was varied from 0.5C to 2C. After electrochemical characterization, all cells were disassembled, washed two times for 30 minutes each in fresh DMC and subsequently investigated by LIBS.
Table 1 Electrochemical testing procedure and LIBS analysis for Swagelok® cells with unstructured, embossed, and laser-structured NMC thick film electrodes
LIBS instrumentation and chemical analysis
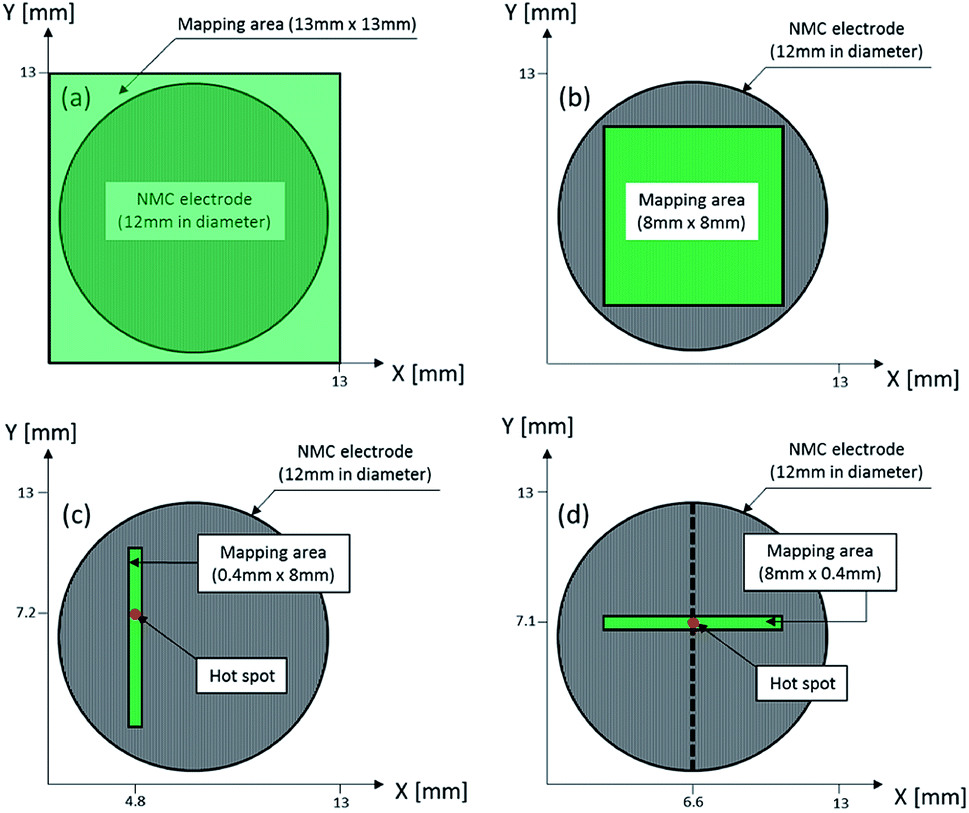
Within the scope of these investigations, a FiberLIBS System (SN013, SECOPTA analytics GmbH, Germany) was used for quantitative analysis of the lithium concentration within NMC thick film electrodes. The experimental setup of LIBS is described elsewhere.31 Briefly, a pulsed passive mode-locked diode pumped solid state Nd:YAG micro-chip laser was used, which operated at 1064 nm wavelength, delivering laser pulses of 1.5 ns at a repetition rate of 100 Hz. The laser-beam was focused with a 75 mm focal length lens onto an electrode sample surface generating laser-induced plasma. The plasma emission was collected and further directed through an optical fiber bundle into two AvaSpec fiber-optic spectrometers (AvaSpec-ULS2048XL-2-USB2, Avantes, Netherlands). Both spectrometers were developed in a symmetrical Czerny-Turner design and offer a spectral range from 229 to 498 nm and 569 to 792 nm, respectively. Equipped with a ruled grating of 1200 grooves per mm blazed at 250 nm, the output of the spectrometer was coupled to a back-thinned charge-coupled detector (CCD) including an electronic shutter function (S11155, Hamamatsu, Japan). The CCD sensors each have an image area of 2048 × 2048 pixels and a pixel width of 14 μm, and were used to detect the dispersed light from the laser-induced plasma. Spatially resolved 3D elemental imaging with LIBS was performed by scanning the electrodes across three axes (X, Y, Z). In the X- and Y-directions, the electrodes were analyzed by applying a dot matrix with a lateral resolution of 100 μm. For the characterization of the entire electrode surface, the measurement area was adjusted to 13 × 13 mm2, which corresponds to 131 × 131 = 17161 recorded spectra (Fig. 3a). In the Z-direction, elemental depth profiling was carried out layer-by-layer. Depending on the electrode porosity, ablation craters with a depth of 4–6 μm were formed after each laser pulse. Here, the measurement area was set depending on the investigation as depicted in Fig. 3b–d.
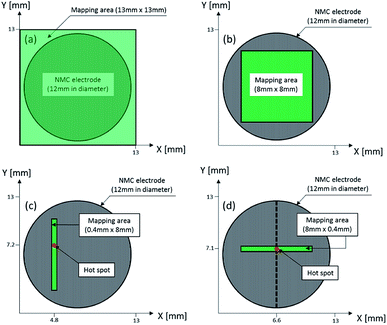 |
| | Fig. 3 Mapping dimensions for LIBS measurements of thick film NMC electrodes: (a) 13 mm × 13 mm, (b) 8 mm × 8 mm (c) 0.4 mm × 8 mm and (d) 8 mm × 0.4 mm. | |
Inductively coupled plasma-optical emission spectroscopy
Inductively coupled plasma-optical emission spectroscopy (ICP-OES, OPTIMA 4300 DV, PerkinElmer, USA) was performed as a chemical analysis technique for the quantitative investigation of lithium. During chemical characterization, approximately 3 mg of composite material was dissolved in a solution consisting of 5 ml nitric acid, 1 ml hydrofluoric acid, 1 ml sulfuric acid and 1 ml perchloric acid. The measurements were carried out for 35 minutes at a temperature of 210 °C, using a microwave oven (Speedwave Xpert, Berghof, Germany). The analysis of the elements was accomplished using four different calibration solutions and two internal standards (Na and Sc). The error of measurement for Li is 2.5%.
Results and discussion
LIBS calibration by partial least squares regression
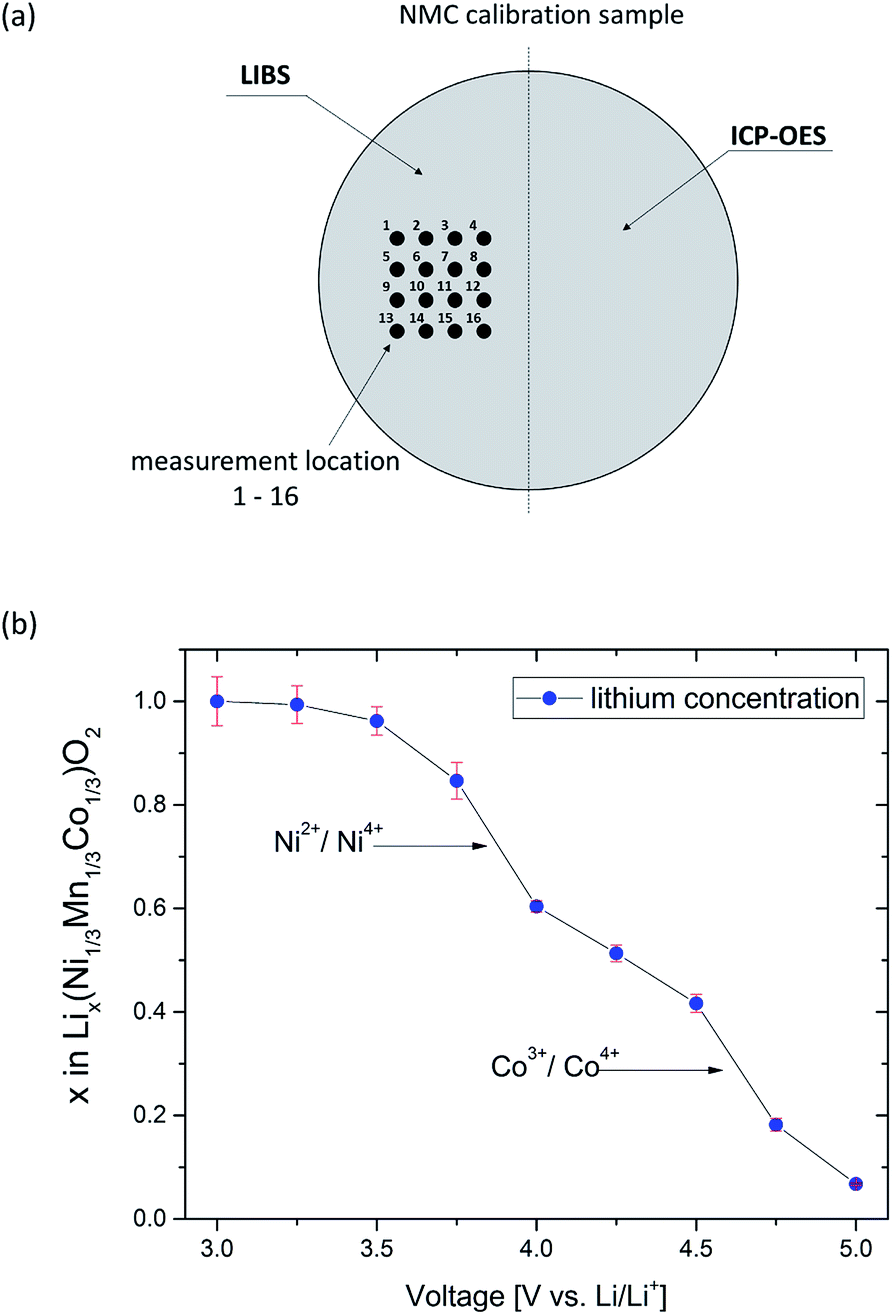
For quantitative investigation of lithium concentration and its distribution in electrochemically cycled NMC thick electrodes, the LIBS-system was calibrated by applying a multivariate calibration technique, “Partial Least Squares Regression”. Based on reference samples of known composition, this kind of calibration approach allows the identification of element concentration and distribution by rapid processing of the acquired data.33 In this work, nine individual NMC electrodes – all incorporating the same and known cathode composition – were respectively electrochemically cycled and held at various voltages in a range from 3.0–5.0 V without formation. A holding step was performed for achieving a homogeneous state-of-charge within each electrode. The homogeneity of lithium concentration and distribution at various states-of-charge (3.0 V and 5.0 V) is presented elsewhere.34 Due to the fact that electrolyte decomposition may appear at voltages above 4.5 V,35 the electrical current was recorded for each cell as a function of time. Based on the results for electrochemical titration at 5 V (not shown here), it could be observed that the electrical current increases after 60–80 hours. This rise in electrical current can be assigned to electrolyte decomposition. In order to avoid significant influence of electrolyte decomposition, all cells were held at the pre-set voltages for a defined time of 50 hours. Finally, the cells were disassembled, washed two times for 30 minutes each in fresh DMC and bisected by ultrafast laser cutting. One part of the electrode was chemically analyzed by ICP-OES, and the other part was used as a teaching-set for LIBS measurement (Fig. 4a). In a first approach, the teaching-set was configured by recording the lithium peak intensity at 610.4 nm for each calibration sample in the range from 3.0–5.0 V. Six laser pulses were applied at 16 different measurement locations for the quantitative investigation of the lithium amount x in Lix(Ni1/3Mn1/3Co1/3)O2 as a function of their pre-set voltage. The first laser pulse was used as a cleaning step. As shown in Fig. 4b, the lithium concentration x in Lix(Ni1/3Mn1/3Co1/3)O2 decreases when increasing the voltage up to 5.0 V. Furthermore, two characteristic drops in the titration curve can be identified. The first drop is located at a voltage of 3.8 V and the second one is located at 4.6 V. These changes in curvature slope correspond to electrochemical redox couples Ni2+/4+ and Co3+/4+, indicating that the lithium deintercalation from the host lattice mainly occurs at 3.6–3.8 V and 4.55–4.65 V, respectively.36 Based on the calibration procedure using ICP-OES, a standard deviation of x in Lix(Ni1/3Mn1/3Co1/3)O2 was achieved in the range of 0.002 (at 5.0 V)–0.047 (at 3.0 V).
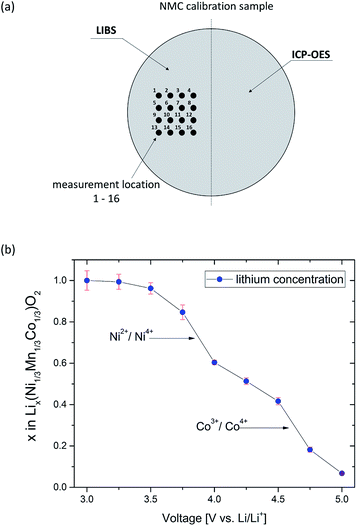 |
| | Fig. 4 Preparation steps prior to quantitative elemental imaging: (a) schematic diagram of a bisected calibration sample for subsequent LIBS and ICP-OES measurements and (b) adjustment of nine defined states-of-charge in the voltage range of 3.0–5.0 V by electrochemical titration. | |
3D elemental imaging of NMC thick films
Unstructured NMC electrodes.
For unstructured NMC electrodes, quantitative LIBS measurements were carried out on the electrodes after manufacturing, electrochemical formation and galvanostatic measurements, respectively (see Table 1). For each electrode (Fig. 5a, c, and e), 16 layers were recorded in a geometrical dimension of 13 mm × 13 mm (Fig. 3a). The ablation depth for each layer was measured to an average value of 5 μm. As shown in Fig. 5b, a homogeneous lithium distribution was achieved after electrode manufacturing. The mapping area for cross-sectional view was set to 8 mm × 8 mm (Fig. 3b). Along the Y-direction, the averaged lithium concentration x in Lix(Ni1/3Mn1/3Co1/3)O2 was plotted for all layers as a function of the X-direction. For layer 4, 6, and 8, the x in Lix-values of 1.090 ± 0.010, 1.086 ± 0.009, and 1.082 ± 0.012 could be measured. After electrochemical formation, no significant changes in lithium distribution could be detected, which indicates a uniform intercalation/deintercalation of lithium-ions during battery operation at low C-rates, i.e., C/10. In comparison to electrodes after manufacturing, the averaged lithium concentration x in Lix(Ni1/3Mn1/3Co1/3)O2 could now be measured to be 1.076 ± 0.012, 1.079 ± 0.014, and 1.071 ± 0.0095 for layer 4, 6, and 8 (Fig. 5d).
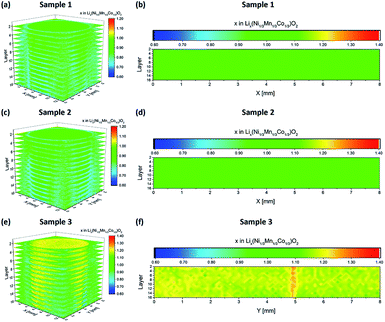 |
| | Fig. 5 Li concentration profiles (3D and cross sectional view) of unstructured NMC thick film electrodes achieved by LIBS. (a and b) After coating, (c and d) after electrochemical formation, and (e and f) after galvanostatic cycling (see Table 1). | |
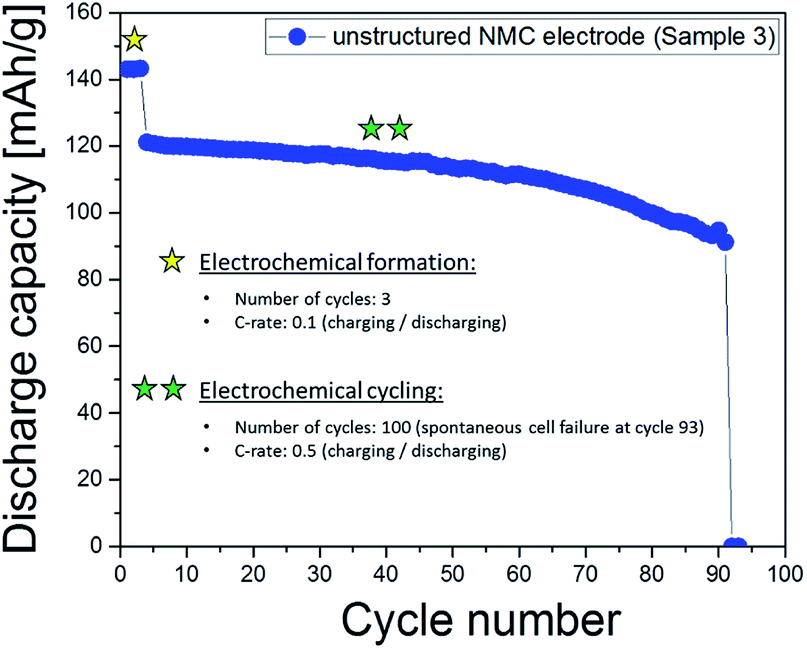
Fig. 5e shows an elemental map of lithium (mapping dimension shown in Fig. 3c), recorded from an unstructured electrode after spontaneous cell failure after cycle 93 (Fig. 6). The electrode indicates inhomogeneous lithium distribution with a local increased accumulation of lithium-ions at the electrode surface (X = 4.8 mm and Y = 7.2 mm). This enhanced lithium concentration – here also denoted as “hot spot” – can be detected in each layer, measured from the electrode surface down to layer 16 (Fig. 5f). One possible cause for this kind of hot spot with increased lithium concentration x in Lix(Ni1/3Mn1/3Co1/3)O2 (layer 4: x = 1.166 ± 0.005; layer 6: x = 1.168 ± 0.006; layer 8: x = 1.175 ± 0.007) can be explained by a local inhomogeneity in current density during electrochemical cycling. This in turn might be induced by inhomogeneities in porosity, material composition, material (active material, binder and conductive agents) distribution, and inhomogeneous liquid electrolyte wetting. In the manufacturing of lithium-ion batteries, electrolyte filling and warm aging processes are critical operation steps, which influence the electrochemical performance of a battery, especially by using electrodes with large footprint areas and thicknesses larger than or equal to 100 μm.17,20 Consequently, an adequate wetting of electrodes with liquid electrolyte is one of the essential process strategies for avoiding chemical degradation leading to the formation of the so-called hot spots.
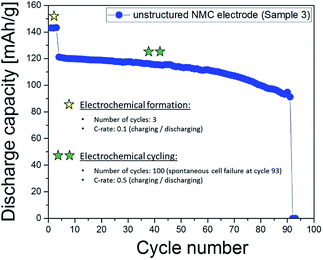 |
| | Fig. 6 Galvanostatic measurement of a cell with an unstructured NMC thick film electrode. The discharge capacity is plotted as a function of cycle number. The electrochemical procedure is shown in Table 1. | |
Embossed NMC electrodes.
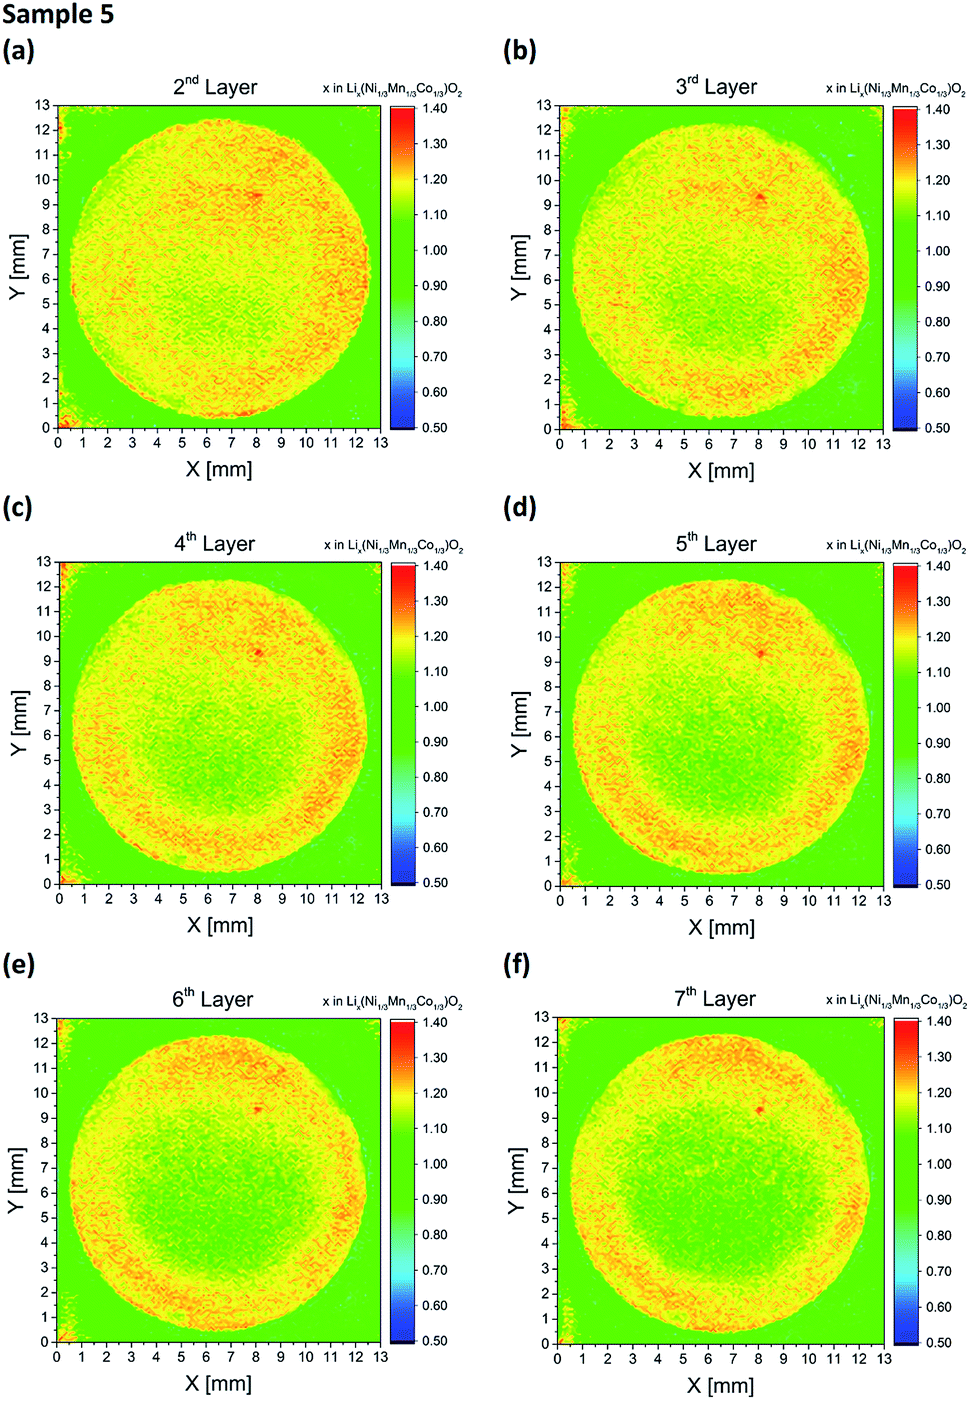
Two electrode designs were partially generated via embossing (Fig. 2a and b) for studying the impact of porosity variations within the electrode. As shown in Fig. 7, low and high porosity regions could be successfully manufactured, providing porosity values of 35% ± 3% for embossed electrodes and 54% ± 3% for the as-deposited electrodes. However, both types of electrodes (sample 4 and 5) suffered from spontaneous cell failure during battery operation at cycle 66 and cycle 146 (see Table 1). For quantitative investigation of lithium distribution post-mortem LIBS measurements were performed. 3D elemental imaging of lithium was performed by screening the entire electrode layer-by-layer. As illustrated in Fig. 8a, a total number of ten layers were recorded for sample 4. The mapping dimension was set to 13 mm × 13 mm (Fig. 3a). It can be clearly seen that embossing leads to material compaction with reduced open porosity at the surface, which in turn will also have an impact on the entire porosity. Additionally, an increase in lithium concentration was detected at the electrode surface (Fig. 8b), located at the interface between the low and high porosity region (X = 6.6 mm, Y = 7.1 mm). This local increase of lithium concentration was observed on each layer (Fig. 8c), recorded from the electrode surface down to layer 10. Here, the mapping dimension was adjusted to 8 mm × 0.4 mm (Fig. 3d). In addition, Fig. 8d illustrates an accumulation of lithium-ions, observed in the low porosity regions. The mapping dimension was set to 8 mm × 8 mm corresponding to Fig. 3b and the average concentration values for lithium are shown in Table 2. Depending on the porosity, two regions were defined: the first region (X = 0–3.5 mm) with low porosity (35% ± 3%) and the second region (X = 4.5–8 mm) with high porosity (54% ± 3%). Finally, Fig. 8e represents a trend for lithium concentration measured for an illustrated area of Fig. 8d (see inlay). For layers 2–6, the lithium concentration is plotted as an averaged value in the Y-direction for X = 2–6 mm. It could be observed that for X = 4.5–6 mm (high porosity regions) the lithium concentration is increased at the surface of the electrode (layer 1 and 2) while for low porosity regions (X = 2–3.5 mm) there is no change in lithium concentration detected within the measurement accuracy (see error bars in Fig. 8e). For NMC electrodes with circular compression (Fig. 2b), post-mortem LIBS measurements were performed of the entire electrode. As shown in Fig. 9, an inhomogeneous lithium distribution could be observed for all layers. Similar to sample 4 (Fig. 8, half-embossed NMC electrode), an increased lithium concentration could be localized at the interface between high and low porosity regions (X = 8.1 mm and Y = 9.4 mm). We could identify that the increased lithium concentration x in Lix(Ni1/3Mn1/3Co1/3)O2 (hot spot) stays almost constant from layer 2 (x = 1.34 in Lix(Ni1/3Mn1/3Co1/3)O2) up to layer 7 (x = 1.33 in Lix(Ni1/3Mn1/3Co1/3)O2). In the center of the electrode, the lithium concentration x in Lix(Ni1/3Mn1/3Co1/3)O2 reaches a minimum value of x = 1.06 in layer 2 and x = 0.98 in layer 7, while a lithium concentration of x = 1.2–1.3 could be detected in the low porosity regions. As mentioned before, a well-defined porosity is quite necessary for electrochemical cyclability, particularly for NMC thick films operating in cells under high charging and discharging conditions.
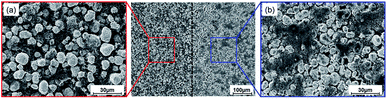 |
| | Fig. 7 SEM images of embossed electrodes: (a) electrode surface after manufacturing and (b) electrode surface after embossing. | |
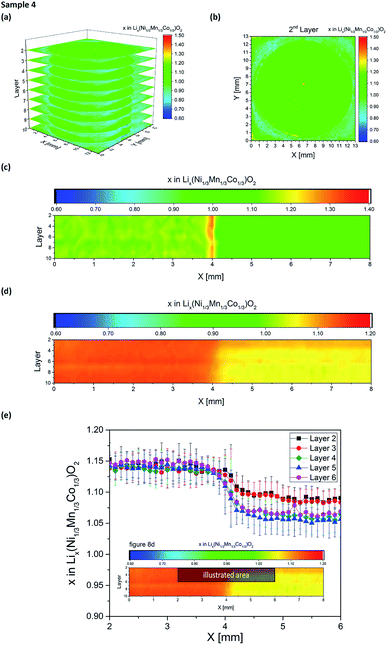 |
| | Fig. 8 Li elemental mapping achieved from quantitative LIBS measurements on embossed NMC electrodes (sample 4) after electrochemical cycling: (a) 3D image of the entire electrode surface from layer 2 to layer 10 (layer 1 not shown here), (b) 2D elemental map of layer 2, (c) LIBS depth-profile (average Y-values) for layers 2–10 with a mapping area of 8 mm × 0.4 mm, (d) LIBS depth-profile (average Y-values) for layers 2–10 with a mapping area of 8 mm × 8 mm and (e) gradient of lithium concentration (average Y-values) corresponding to (d) (illustrated area). The lithium concentration is plotted as a function of X [mm] for layers 2–6. | |
Table 2 Average lithium concentration as a function of the X-direction for layers 2–10 (Fig. 8d)
| Layer |
|
2 |
3 |
4 |
5 |
6 |
7 |
8 |
9 |
10 |
|
x in Lix(Ni1/3Mn1/3Co1/3)O2 |
Low porosity (X = 0 −3.5 mm) |
1.138 ± 0.027 |
1.135 ± 0.026 |
1.137 ± 0.023 |
1.139 ± 0.024 |
1.147 ± 0.025 |
1.129 ± 0.037 |
1.139 ± 0.039 |
1.143 ± 0.0392 |
1.144 ± 0.039 |
| High porosity (X = 4.5 −8 mm) |
1.090 ± 0.022 |
1.087 ± 0.022 |
1.062 ± 0.025 |
1.057 ± 0.028 |
1.066 ± 0.029 |
1.053 ± 0.038 |
1.052 ± 0.034 |
1.055 ± 0.036 |
1.056 ± 0.038 |
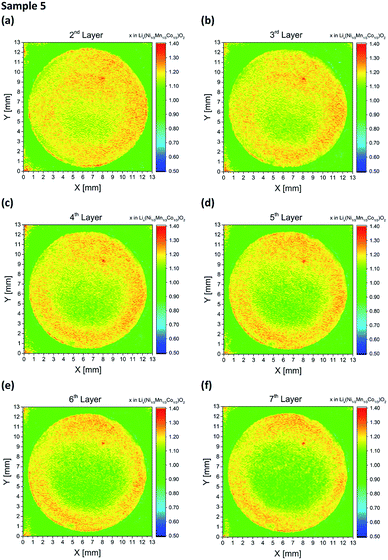 |
| | Fig. 9 Li elemental mapping achieved by LIBS of embossed NMC electrodes (sample 5) after electrochemical characterization: (a–f) Li maps for layers 2–7. | |
To summarize, these compressed electrode surfaces provide an intrinsic porosity variation, which induces a local change in lithium distribution, indicating a dramatic chemically-driven aging process during battery operation. It is obvious that embossing, which could be easily performed during conventional calendering in battery manufacturing, is not a suitable structuring technology for the generation of 3D electrodes, which were already successfully established by laser ablation.25–27
Laser-structured NMC electrodes.
For studying the impact of 3D NMC architectures on lithium distribution and chemical degradation, free-standing micro-pillars were generated by ultrashort (fs) laser ablation as shown in Fig. 10. Here, the composite material was removed down to the substrate, forming cubical micro-pillars with a geometrical shape of 600 μm × 600 μm × 100 μm (Fig. 10a). For this type of electrode architecture, both an intrinsic and artificial porosity were realized due to laser ablation. Each micro-pillar offers porosity values of 35% ± 3% and a film thickness of 100 μm ± 3 μm. The microscopic cross-sectional images (Fig. 10b) clearly show that no significant damage of the current collector occurs during fs-laser structuring. Additionally, the pitch distance between each micro-pillar was set to 1200 μm. For this electrode design LIBS could be performed on individual 3D pillars. In a first approach, laser-structured electrodes were characterized by LIBS after manufacturing and fs-laser structuring. Fig. 11a and b clearly show that the lithium distribution is quite homogeneous in each free-standing micro-pillar and supplementary in very good accordance compared to unstructured electrodes after fabrication and prior to electrochemical cycling. After electrode manufacturing, all micro-pillars are completely lithiated, offering a lithium concentration of x = 1.07 ± 0.030. After battery operation (2C for charging and discharging), the lithium distribution in free-standing micro-pillars changed (Fig. 11c and d). Due to this type of surface and bulk analysis, it was possible to verify the 3D functionality of the fs-laser generated micro-features: the lithium concentration is significantly increased along the contour of each 3D micro-pillar. For the investigated micro-pillar shown in Fig. 11c, the maximum lithium concentration x in Lix(Ni1/3Mn1/3Co1/3)O2 was measured at the surface to be 1.06, which indicates that free-standing micro-pillars lead to an increase of lithium mobility during battery operation under high power conditions. However, in the center of the micro-pillar, the lithium concentration x reaches a minimum value of 0.93. Thus, the lithium depleted region offers a circular area of 200 mm in diameter, which corresponds to 40% of the cubic micro-pillar. Due to the result in Fig. 11a and c a micro-pillar shape of 400 μm × 400 μm × 100 μm is proposed for an optimized electrode architecture, providing a uniform lithium distribution under high power conditions. Finally, Fig. 11d shows a cross-sectional view of the micro-pillar, measured by LIBS. It can be shown so far that the lithium concentration further decreases in the middle of the free-standing micro-pillar from x = 0.93 (pillar surface, X = 600 μm) down to x = 0.88 (layer 12, X = 600 μm). Depending on the C-rate (here 2C for charging and discharging) only a part of the micro-pillar is activated during battery operation. For layer 2, 4 and 6, x in Lix(Ni1/3Mn1/3Co1/3)O2 values of 0.96, 0.93, and 0.93 (for X = 400 μm) and 0.98, 0.95, and 0.93 (for X = 800 μm) could be measured. All these results clearly show that 3D architectures need to be optimized regarding their lateral dimensions but also regarding their height as a function of the C-rate and intrinsic porosity in order to boost the battery performance for high power operation.
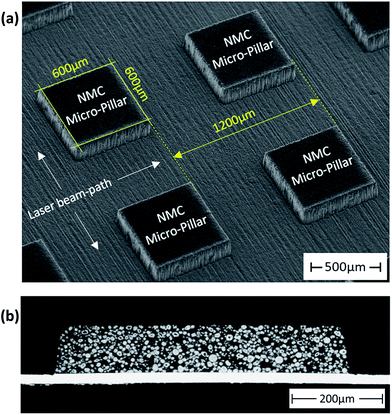 |
| | Fig. 10 SEM and microscope images of a laser-structured NMC thick film electrode: (a) top-view (SEM) and (b) cross-sectional view (microscope image). | |
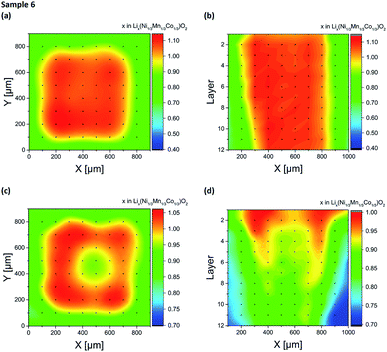 |
| | Fig. 11 Li elemental maps and Li depth-profiles of laser-generated micro-pillars in NMC thick film electrodes: (a and c) Li elemental maps of free-standing micro-pillars before and after electrochemical cycling (C-rate for charging and discharging: 2C–2C), (b and d) Li elemental depth-profiles of NMC micro-pillars before and after electrochemical characterization (C-rate for charging and discharging: 2C–2C). | |
Conclusions
In this work, various types of NMC electrodes were manufactured by embossing and ultrafast laser structuring. The electrochemical performance was studied by galvanostatic measurements, and laser-induced breakdown spectroscopy (LIBS) was applied for the investigation of lithium distribution and its concentration within each type of NMC electrode. Additionally, the impact of electrode porosity on chemical degradation and battery lifetime was investigated. For unstructured NMC thick film electrodes, a local increase in lithium concentration, a so-called hot spot, could be detected after spontaneous cell failure. For electrodes with varying porosity on the macro-scale, a correlation between lithium distribution and enhanced cell degradation could be detected. In comparison to embossing, femtosecond laser patterning technology was proven to have a positive impact on battery performance and battery lifetime. Especially for high C-rates, this becomes an important issue leading to a measurable variation of lithium distribution along the surface of each cubic micro-pillar. In comparison to the former discussed hot spot formation, this type of lithium increase is quite smooth, occurs on the surface along lateral dimensions of about 400 μm, and does not have a negative impact on the cell lifetime. It could be clearly demonstrated by LIBS that the lithium concentration is also significantly increased along the contour of free-standing microstructures, which indicates that 3D architectures provide additional Li pathways leading to a significant increase of lithium mobility during battery operation under high power conditions. An optimized micro-pillar dimension can be derived from elemental mapping studies. Micro-pillars with a lateral dimension of about 300–400 μm seem to be optimal in order to avoid donut-like lithium distributions in high power operations which has to be verified in ongoing research.
Conflicts of interest
There are no conflicts to declare.
Acknowledgements
We are grateful to our colleagues H. Besser and J. Anhalt for their technical assistance during laser materials processing and LIBS. This project has received funding from the German Research Foundation (DFG, project No. 392322200). Finally, the support for laser materials processing from the Karlsruhe Nano Micro Facility (KNMF, http://www.knmf.kit.edu/), a Helmholtz research infrastructure at the Karlsruhe Institute of Technology (KIT), is gratefully acknowledged.
References
- J. M. Foster, X. Huang, M. Jiang, S. J. Chapman, B. Protas and G. Richardson, J. Power Sources, 2017, 350, 140–151 CrossRef CAS.
- Y. Gao, J. C. Jiang, C. P. Zhang, W. G. Zhang, Z. Y. Ma and Y. Jiang, J. Power Sources, 2017, 356, 103–114 CrossRef CAS.
- M. Mathew, Q. H. Kong, J. McGrory and M. Fowler, J. Power Sources, 2017, 349, 94–104 CrossRef CAS.
- J. Schmitt, A. Maheshwari, M. Heck, S. Lux and M. Vetter, J. Power Sources, 2017, 353, 183–194 CrossRef CAS.
- R. Wagner, N. Preschitschek, S. Passerini, J. Leker and M. Winter, J. Appl. Electrochem., 2013, 43, 481–496 CrossRef CAS.
- S. J. An, J. L. Li, Z. J. Du, C. Daniel and D. L. Wood, J. Power Sources, 2017, 342, 846–852 CrossRef CAS.
- C. F. Chen, P. Barai, K. Smith and P. P. Mukherjee, Electrochim. Acta, 2016, 204, 31–49 CrossRef CAS.
- J. de Hoog, J. M. Timmermans, D. Ioan-Stroe, M. Swierczynski, J. Jaguemont, S. Goutam, N. Omar, J. Van Mierlo and P. van den Bossche, Appl. Energy, 2017, 200, 47–61 CrossRef CAS.
- N. Nitta, F. X. Wu, J. T. Lee and G. Yushin, Appl. Energy, 2015, 18, 252–264 CAS.
- B. Scrosati, J. Hassoun and Y. K. Sun, Energy Environ. Sci., 2011, 4, 3287–3295 RSC.
- M. M. Thackeray, C. Wolverton and E. D. Isaacs, Energy Environ. Sci., 2012, 5, 7854–7863 RSC.
- I. V. Thorat, D. E. Stephenson, N. A. Zacharias, K. Zaghib, J. N. Harb and D. R. Wheeler, J. Power Sources, 2009, 188, 592–600 CrossRef CAS.
- D. Andre, S. J. Kim, P. Lamp, S. F. Lux, F. Maglia, O. Paschos and B. Stiaszny, J. Mater. Chem. A, 2015, 3, 6709–6732 RSC.
- K. Amine, R. Kanno and Y. H. Tzeng, MRS Bull., 2014, 39, 395–405 CrossRef CAS.
- A. Manthiram, B. Song and W. Li, Energy Storage Materials, 2017, 6, 125–139 CrossRef.
- M. Singh, J. Kaiser and H. Hahn, J. Electroanal. Chem., 2016, 782, 245–249 CrossRef CAS.
- W. Pfleging, Nanophotonics, 2017, 7, 549–573 Search PubMed.
- J. W. Long, B. Dunn, D. R. Rolison and H. S. White, Chem. Rev., 2004, 104, 4463–4492 CrossRef CAS.
- S. Ferrari, M. Loveridge, S. D. Beattie, M. Jahn, R. J. Dashwood and R. Bhagat, J. Power Sources, 2015, 286, 25–46 CrossRef CAS.
- W. Pfleging and J. Pröll, J. Mater. Chem. A, 2014, 2, 14918–14926 RSC.
- W. Xiong, Q. Y. Xia and H. Xia, Funct. Mater. Lett., 2014, 7, 1430003 CrossRef CAS.
- C. Meyer, H. Bockholt, W. Haselrieder and A. Kwade, J. Mater. Process. Technol., 2017, 249, 172–178 CrossRef CAS.
- H. H. Zheng, G. Liu, X. Y. Song, P. Ridgway, S. D. Xun and V. S. Battaglia, J. Electrochem. Soc., 2010, 157, A1060–A1066 CrossRef CAS.
- H. H. Zheng, L. Tan, G. Liu, X. Y. Song and V. S. Battaglia, J. Power Sources, 2012, 208, 52–57 CrossRef CAS.
- M. Mangang, H. J. Seifert and W. Pfleging, J. Power Sources, 2016, 304, 24–32 CrossRef CAS.
- J. Pröll, H. Kim, A. Piqué, H. J. Seifert and W. Pfleging, J. Power Sources, 2014, 255, 116–124 CrossRef.
- J. H. Rakebrandt, P. Smyrek, Y. Zheng, H. J. Seifert and W. Pfleging, Proc. SPIE, 2017, 10092, 100920M1–100920M7 CrossRef.
- H. Hou and V. Zorba, IEEE (CLEO), 2014, 1–2 Search PubMed.
- H. M. Hou, L. Cheng, T. Richardson, G. Y. Chen, M. Doeff, R. Zheng, R. Russo and V. Zorba, J. Anal. At. Spectrom., 2015, 30, 2295–2302 RSC.
- V. Zorba, J. Syzdek, X. L. Mao, R. E. Russo and R. Kostecki, Appl. Phys. Lett., 2012, 100, 234101-1–234101-5 CrossRef.
- P. Smyrek, J. Pröll, H. J. Seifert and W. Pfleging, J. Electrochem. Soc., 2016, 163, A19–A26 CrossRef CAS.
- P. Smyrek, Y. Zheng, H. J. Seifert and W. Pfleging, Proc. SPIE, 2018, 10520, 1052017-1–1052017-7 Search PubMed.
- J. M. Andrade, G. Cristoforetti, S. Legnaioli, G. Lorenzetti, V. Palleschi and A. A. Shaltout, Spectrochim. Acta, Part B, 2010, 65, 658–663 CrossRef.
- P. Gotcu, W. Pfleging, P. Smyrek and H. J. Seifert, Phys. Chem. Chem. Phys., 2017, 19, 11920–11930 RSC.
- L. L. Zhang, Y. L. Ma, X. Q. Cheng, P. J. Zuo, Y. Z. Cui, T. Guan, C. Y. Du, Y. Z. Gao and G. P. Yin, Solid State Ionics, 2014, 263, 146–151 CrossRef CAS.
- K. M. Shaju, G. V. S. Rao and B. V. R. Chowdari, Electrochim. Acta, 2002, 48, 145–151 CrossRef CAS.
|
| This journal is © The Royal Society of Chemistry 2019 |
Click here to see how this site uses Cookies. View our privacy policy here. 
 Open Access Article
 This Open Access Article is licensed under a Creative Commons Attribution-Non Commercial 3.0 Unported Licence
 *ab,
Thomas
Bergfeldt
ab,
Hans Jürgen
Seifert
a and
Wilhelm
Pfleging
*ab,
Thomas
Bergfeldt
ab,
Hans Jürgen
Seifert
a and
Wilhelm
Pfleging