
 Open Access Article
 This Open Access Article is licensed under a
 Creative Commons Attribution 3.0 Unported Licence
Charge carrier dynamics in tantalum oxide overlayered and tantalum doped hematite photoanodes†
Tero-Petri
Ruoko‡
 *a,
Arto
Hiltunen
a,
Tomi
Iivonen
b,
Riina
Ulkuniemi
c,
Kimmo
Lahtonen
c,
Harri
Ali-Löytty
c,
Kenichiro
Mizohata
d,
Mika
Valden
c,
Markku
Leskelä
b and
Nikolai V.
Tkachenko
a
*a,
Arto
Hiltunen
a,
Tomi
Iivonen
b,
Riina
Ulkuniemi
c,
Kimmo
Lahtonen
c,
Harri
Ali-Löytty
c,
Kenichiro
Mizohata
d,
Mika
Valden
c,
Markku
Leskelä
b and
Nikolai V.
Tkachenko
a
aChemistry and Advanced Materials, Laboratory of Chemistry and Bioengineering, Tampere University of Technology, P.O. Box 541, FI-33101 Tampere, Finland. E-mail: tero-petri.ruoko@liu.se
bDepartment of Chemistry, University of Helsinki, P.O. Box 55, FI-00014 Helsinki, Finland
cSurface Science Group, Laboratory of Photonics, Tampere University of Technology, P.O. Box 692, FI-33101 Tampere, Finland
dDepartment of Physics, University of Helsinki, P.O. Box 43, FI-00014 Helsinki, Finland
First published on 14th January 2019
Abstract
We employ atomic layer deposition to prepare 50 nm thick hematite photoanodes followed by passivating them with a 0.5 nm thick Ta2O5-overlayer and compare them with samples uniformly doped with the same amount of tantalum. We observe a three-fold improvement in photocurrent with the same onset voltage using Ta-overlayer hematite photoanodes, while electrochemical impedance spectroscopy under visible light irradiation shows a decreased amount of surface states under water splitting conditions. The Ta-doped samples have an even higher increase in photocurrent along with a 0.15 V cathodic shift in the onset voltage and decreased resistivity. However, the surface state capacitance for the Ta-doped sample is twice that of the reference photoanode, which implies a larger amount of surface hole accumulation. We further utilize transient absorption spectroscopy in the sub-millisecond to second timescale under operating conditions to show that electron trapping in both Ta2O5-passivated and Ta-doped samples is markedly reduced. Ultrafast transient absorption spectroscopy in the sub-picosecond to nanosecond timescale shows faster charge carrier dynamics and reduced recombination in the Ta-doped hematite photoanode resulting in the increased photoelectrochemical performance when compared with the Ta2O5-overlayer sample. Our results show that passivation does not affect the poor charge carrier dynamics intrinsic to hematite based photoanodes. The Ta-doping strategy results in more efficient electron extraction, solving the electron trapping issue and leading to increased performance over the surface passivation strategy.
1 Introduction
Photoelectrochemical water splitting with stable metal oxide materials produces environmentally friendly hydrogen gas that can be transported over large distances to be burned in conventional gas power plants or converted directly into electricity using fuel cells. This solution allows to store solar energy directly into chemical bonds, thus potentially solving the problems associated with intermittent and localized solar electricity production.Hematite (α-Fe2O3) has been regarded as one of the most promising candidates for photoelectrochemical water splitting ever since it was first used for this purpose by Hardee and Bard in 1976.1 Hematite has numerous advantages as a photoanode material, such as a near optimal band gap of 2.2 eV that results in a theoretical solar-to-hydrogen efficiency of 12.9%,2 high chemical stability in non-acidic conditions, natural abundance, and low production costs.3,4 However, the efficiencies of hematite photoanodes remain low due to a few intrinsic drawbacks: (i) a flat band potential that is too low for water reduction, (ii) poor electron mobility, and (iii) a small hole diffusion length of 2–20 nm.5–8 Furthermore, surface states at the hematite–electrolyte interface can also act as recombination centers that drastically decrease the photoanode performance.9
Metal oxide surfaces are spontaneously hydroxylated in aqueous conditions.10 Iandolo et al.11 showed that hematite surfaces are populated by OH- and O-terminations of the iron oxide lattice, both of which act as surface states. The hydroxyl-terminated surface states are occupied mid-gap states that act as surface recombination centers at low applied bias voltages. On the other hand, the oxo-terminated states are located energetically on the top of the valence band, and take part in the oxygen evolution reaction (OER) at medium biases. Passivation of the hematite surface states has been shown to increase the performance of hematite photoanodes.4 Numerous different methods have been employed to passivate hematite surfaces, including high temperature annealing,12 acid treatment,13 deposition of possibly passivating catalysts such as cobalt phosphate (Co-Pi), IrOx or NiFeOx,14–19 and depositing thin metal oxide overlayers, such as TiO2,20–22 Ga2O3,14,17 or Al2O3.14,17–19,23–25 Out of the metal oxide passivating layers used for hematite photoanodes, TiO2 has yielded inconclusive results, varying from no improvement20,23 to improvement only after high temperature annealing22 or a solution deposition process.26 On the other hand, Ga2O3 (ref. 14) and to some extent also Al2O3 (ref. 27) are susceptible to dissolution in basic electrolytes. For these reasons we chose to study the effects of Ta2O5 as an overlayer and dopant in hematite photoanodes.
Ta2O5 is a large band gap (3.9 eV)28 metal oxide which is often used in anti-reflective coatings for solar cells and sensors. Due to its high-permittivity and excellent chemical stability it has also found applications in the semiconductor industry, such as in dielectric layers for transistors and storage capacitors.29 The band levels of Ta2O5 straddle the water oxidation and reduction potentials,28 making it a potential candidate for use as an overall water splitting photocatalyst.30 However, due to the large band gap it cannot be excited with visible light irradiation, greatly limiting the obtainable photocurrent. Ta2O5 has previously been used as a dopant in hematite photoanodes, but the results have been inconclusive. Ta-doping increases the conductivity of hematite,31 but photoelectrochemical improvements due to the doping have varied from non-existent,32 to a 3.5 time improvement for water oxidation,33 reaching all the way to a 32 time improvement in photocurrent over pristine hematite in the presence of scavengers.34 Ta2O5 was recently used as a surface passivation layer for ZnO photoanodes, leading to nearly two-fold improved photoelectrochemical performance.35 The chemical stability of Ta2O5 promises more stable passivating layers in non-neutral solutions than Ga2O3 or Al2O3. Ta2O5 was recently utilized as an overlayer for hematite photoanodes, which resulted in approximately a three-fold increase in the photocurrent over pristine nanostructured hematite photoanodes.36
Herein, we utilized 50 nm thick hematite photoanodes made by atomic layer deposition (ALD). The deposition method and sample thickness were chosen to have a uniform sample surface, while keeping the sample absorbance relatively low in order to characterize the charge carrier dynamics using transient absorption spectroscopy (TAS). The Ta2O5-passivated samples were prepared by depositing an ultrathin (roughly 0.5 nm) overlayer by ALD, whereas Ta-doped samples were prepared by applying one Ta2O5 deposition cycle once every hundred hematite deposition cycles. This resulted in the same number of Ta-precursor cycles for both overlayer and doped samples. We observed a three-fold improvement in photocurrent with the same onset voltage using Ta2O5-overlayer hematite photoanodes. Electrochemical impedance spectroscopy (EIS) under visible light irradiation showed a decreased amount of surface states under water splitting conditions, indicating that the surface has indeed been passivated. However, the Ta-doped samples showed an even larger increase in photocurrent along with a 0.15 V cathodic shift in the onset voltage and decreased resistivity. Remarkably, the surface state capacitance for the Ta-doped hematite was two times larger than for the reference photoanode. We utilized TAS in the sub-millisecond to second timescale under water splitting conditions to show that electron trapping in both Ta2O5-passivated and Ta-doped samples was markedly reduced. Ultrafast TAS in the sub-picosecond to nanosecond timescale indicated faster charge carrier dynamics in the Ta-doped hematite photoanode to be a probable reason for the increased photoelectrochemical performance.
2 Experimental
Hematite photoanodes were grown on fluorine doped tin oxide (FTO) coated glass substrates (Sigma-Aldrich TEC7, ∼7 Ω sq−1) using the FeCl3 + H2O deposition process37 in a F-120 ALD reactor (ASM Microchemistry) operated in the cross-flow configuration.38 The reference and overlayer hematite samples were grown at 400 °C using 1000 ALD-cycles, after which the samples were annealed at 600 °C for 60 minutes in air. The resulting layer thickness was 50 nm. The Ta2O5-overlayer was grown by applying 10 cycles of the Ta(OC2H5)5 + H2O deposition process at 300 °C on the annealed hematite surface.39 The deposition temperature of the overlayer was lower in order to avoid the thermal decomposition of Ta(OC2H5)5, which becomes significant at temperatures above 325 °C. The resulting overlayer thickness was 0.5 nm. The Ta-doped samples were grown by repeating the Ta(OC2H5)5 + H2O cycle once after every 99 FeCl3 + H2O cycles at 300 °C for a total of 1000 cycles, followed by annealing at 600 °C for 60 minutes in air. All as-prepared samples were finally annealed at 300 °C for 60 minutes in air to remove possible organic contaminants. The ALD deposition process is presented schematically in Fig. 1. Note that Fig. 1 does not represent the final sample structure due to the rough FTO substrate and the annealing steps inducing diffusion of tantalum within the samples.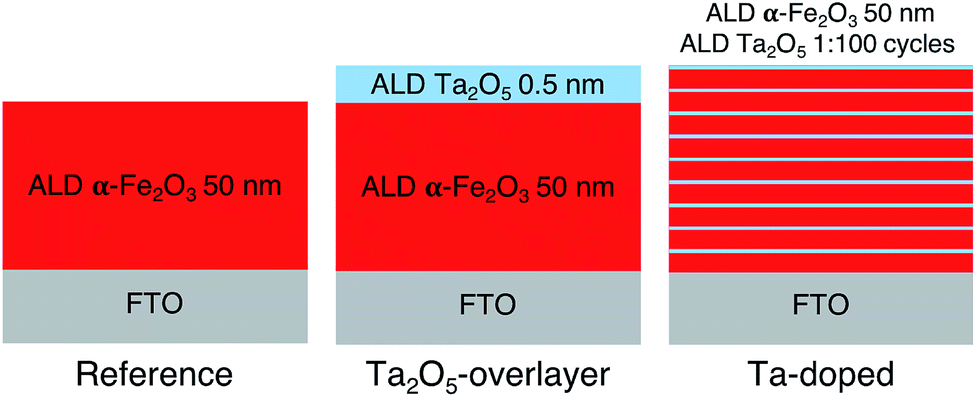 | ||
| Fig. 1 Schematic representation of the ALD deposition processes for the reference, Ta2O5-overlayer, and Ta-doped hematite photoanodes. | ||
X-ray photoelectron spectroscopy (XPS) measurements were performed utilizing a non-monochromatized Al Kα X-ray source (hν = 1486.6 eV) and an Argus hemispherical electron spectrometer (Omicron Nanotechnology GmbH) installed in a multifunctional UHV system with a base pressure below 1 × 10⁻¹⁰ mbar.40 The binding energy scale of the XPS spectrometer was calibrated according to the metallic Cu 2p3/2 at 932.40 eV and Ag 3d5/2 at 368.00 eV. The surface elemental concentrations and chemical states of compounds were identified by analyzing high-resolution XPS spectra using CasaXPS software (Version 2.3.18 PR 1.0). After a Shirley-type background subtraction, the peaks were least-squares fitted with a combination of symmetric Gaussian–Lorentzian line shapes. The relative atomic concentrations were calculated using Scofield photoionization cross sections41 and the experimentally measured transmission function of the Argus analyser.
Depth profiles for the hematite photoanodes were calculated using combined data from time-of-flight elastic recoil detection analysis (ToF-ERDA) and Rutherford backscattering spectroscopy (RBS) measurements. The ion beam measurements were done at the Accelerator Laboratory at University of Helsinki using a 5 MV tandem accelerator.42 For the ToF-ERDA measurements, a 50 MeV 127I9+ ion beam was used whereas the RBS measurements were done using a 8 MeV 12C+ ion beam.
Field emission scanning electron microscopy images were taken with a Carl Zeiss Ultra 55 with an acceleration voltage of 4 kV. The absorption spectra of the hematite photoanodes were measured with a Shimadzu UV-3600 UV-Vis-NIR spectrophotometer in transmission mode.
All measurements with bias voltages were carried out in a three electrode photoelectrochemical cell (PECC-2, Zahner) in 0.1 M NaOH (pH ≈ 12.8). The bias voltages were set using a potentiostat (CompactStat, Ivium Technologies) or a two channel source-monitoring unit (E5272A, Agilent Technologies) using a Ag/AgCl reference electrode (RE-5B, BASi, 3 M NaCl) and a platinum wire counter electrode. Electrochemical impedance measurements were scanned in the frequency range of 10 kHz to 10 mHz with a 10 mV AC signal. All voltages are reported relative to the reversible hydrogen electrode (RHE) scale, calculated using ERHE = E° + EAg/AgCl + 0.059pH, where E° is the reference potential of the Ag/AgCl electrode (0.206 VSHE at 25 °C), EAg/AgCl is the measured potential versus the Ag/AgCl electrode. Current density–voltage and electrochemical impedance measurements were performed under simulated sunlight obtained with a class AAA solar simulator (Sciencetech SS150-AAA) adjusted to one sun total intensity with a calibrated Si reference cell (Oriel 91150V) with electrolyte-side illumination.
Transient absorption in the sub-ms to s timescales was studied using the flash-photolysis method in transmission mode. The third harmonic (F015, Solar TII, 355 nm, 0.2 mJ cm−2, electrolyte-side illumination) of a Nd:YAG laser (LF117, Solar TII, 10 ns pulse width, 0.25 Hz repetition rate) was used as the excitation pump. A stabilized halogen light source (SLS201/M, Thorlabs, 9 W) was used as the probe beam. The monochromatic (CM110, Digikröm) transient signal was detected with a silicon photoreceiver (2051-FS, New Focus) and recorded with a digitizing oscilloscope (TDS5032B, Tektronix). An in-lab program was used to manage the experiment. The transient decays were averaged over 200–1000 laser shots.
Transient absorption in the sub-ps to ns timescales was studied using the pump–probe method in transmission mode. The fundamental laser pulses were generated with a Ti:Sapphire laser (Libra F, Coherent Inc., 800 nm, ∼100 fs pulse width, repetition rate 1 kHz). 90% of the fundamental beam energy was directed to an optical parametric amplifier (Topas C, Light Conversion Ltd.) to produce the desired wavelength excitation pump pulses (355 nm, approximately 0.5 mm diameter at the sample, attenuated to 0.3 mJ cm−2 with neutral density filters). Roughly 10% of the fundamental laser beam energy was directed through a motorized translational stage (delay line) to a 1 mm thick water cuvette for white continuum generation of probe pulses. The probe light was split into the reference and signal beams. The measurement system (ExciPro, CDP Inc.) was equipped with a Si CCD pair for monitoring the transient absorption in the visible range. A chopper synchronized with the fundamental laser pulses was used to block every second pump pulse, and the absorbance change was calculated from consecutive pulses. The spectra were averaged over 10![[thin space (1/6-em)]](https://www.rsc.org/images/entities/char_2009.gif) 000 excitation pulses for each delay time.
000 excitation pulses for each delay time.
3 Results and discussion
The ALD-grown hematite creates a uniform layer on the rough FTO substrate, as shown in the scanning electron microscope (SEM) images of the photoanode surfaces in Fig. 2. The deposition of a 0.5 nm Ta2O5 overlayer does not change the surface morphology of the photoanode. However, the introduction of the Ta2O5 precursor during hematite film growth as a dopant leads to the formation of a rougher surface texture with larger crystallites of up to 500 nm in diameter. A disturbance of hematite nanorod growth upon Ta-doping,33 as well as a preferential crystal growth along the {001} facet have been previously reported.34 Thus, we conclude that the Ta-dopant disturbs the uniform hematite growth, leading to the formation of larger crystallites.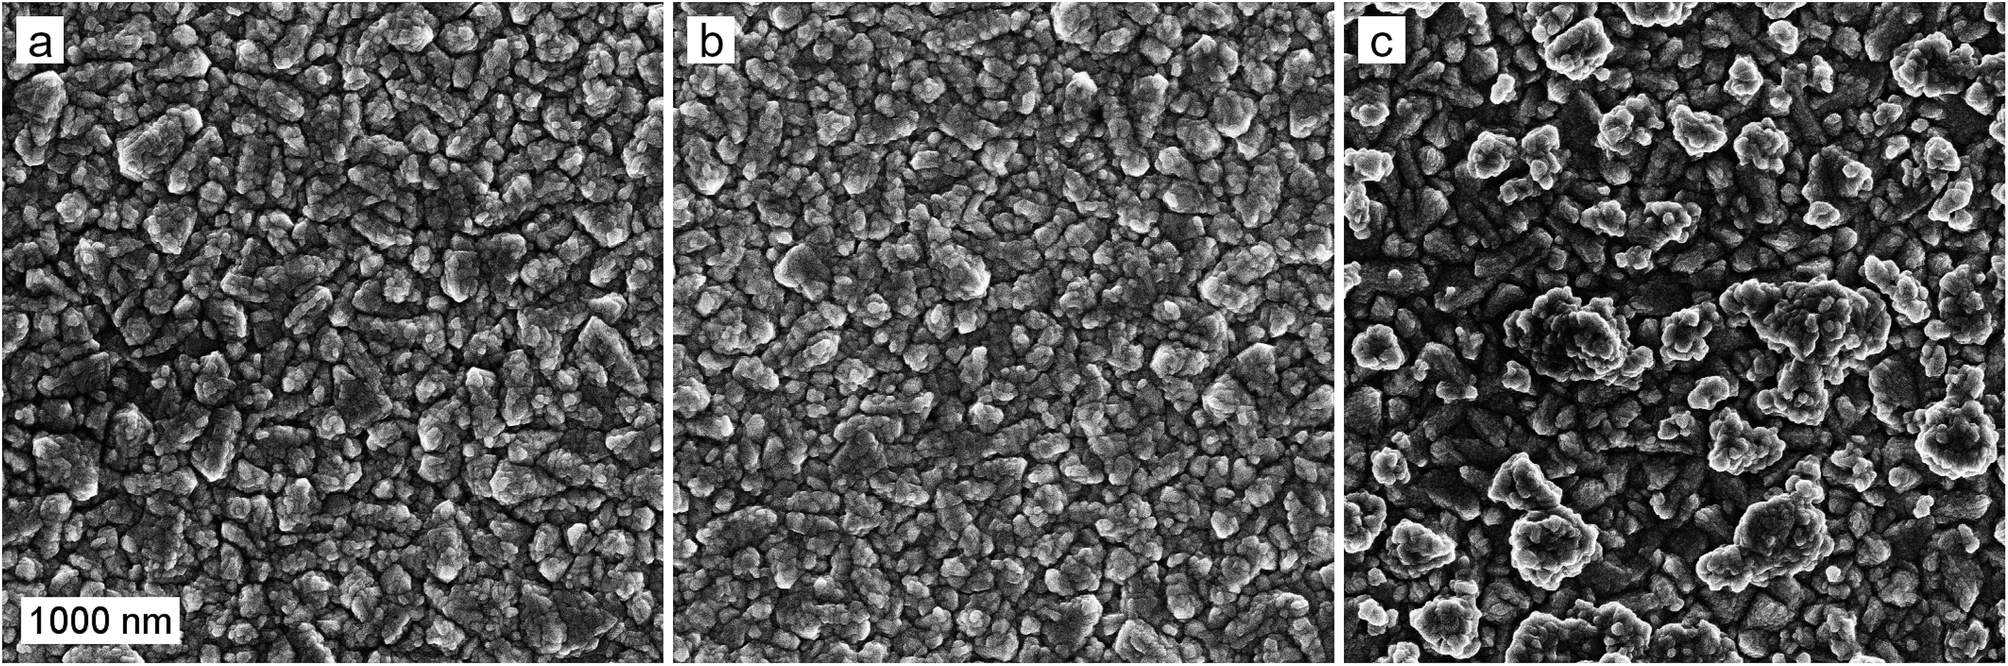 | ||
| Fig. 2 SEM micrographs of the (a) reference, (b) Ta2O5-overlayer, and (c) Ta-doped hematite photoanodes. The scale bar represents 1000 nm. | ||
X-ray photoelectron spectroscopy (XPS) was employed for the analysis of Ta addition on the chemical composition of the hematite surfaces. The relative surface composition of elements and chemical species is presented in Table S1.†Fig. 3 depicts the Fe 2p and Ta 4f spectra of the samples (spectra with fitted components are presented in Fig. S1†). The spectral features of Fe 2p were similar for all samples, and the binding energies of the Fe 2p3/2 peak at 710.4 eV and the satellite peak at 719.5 eV are characteristic to the oxidation state of Fe3+ in, for example, hematite (α-Fe2O3).43 For the Ta-doped and Ta2O5-overlayer hematite samples the binding energy of Ta 4f7/2 at 25.5 eV can be attributed to Ta5+ in accordance with the value observed by Zhang et al.34 Neither Fe nor Ta species were observed at lower oxidation states than 3+ or 5+, respectively, which indicates a low amount of oxygen vacancies. No change in the Ta 4f peak position was observed despite the change in the Ta/Fe ratio of the Ta-doped and Ta2O5-overlayer hematite samples from 0.16 to 0.58, respectively. The high Ta/Fe ratio of the Ta-doped sample compared to the bulk ratio (0.01) indicates annealing induced surface segregation of tantalum and the formation of a Ta diffusion profile through the sample, however, the even higher ratio in the Ta2O5-overlayer hematite suggests the formation of a surface layer.
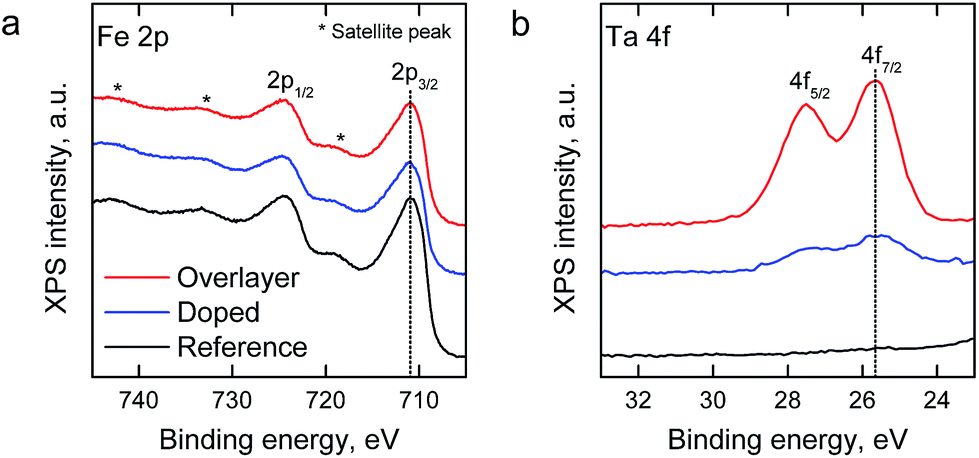 | ||
| Fig. 3 (a) Fe 2p and (b) Ta 4f XPS spectra of the hematite photoanodes. | ||
We determined the elemental depth distribution within the hematite photoanodes using time-of-flight elastic recoil detection analysis (ToF-ERDA) and Rutherford backscattering spectroscopy (RBS). The elemental depth profiles and the tantalum distribution for the hematite photoanodes are presented in Fig. 4 and S2.†
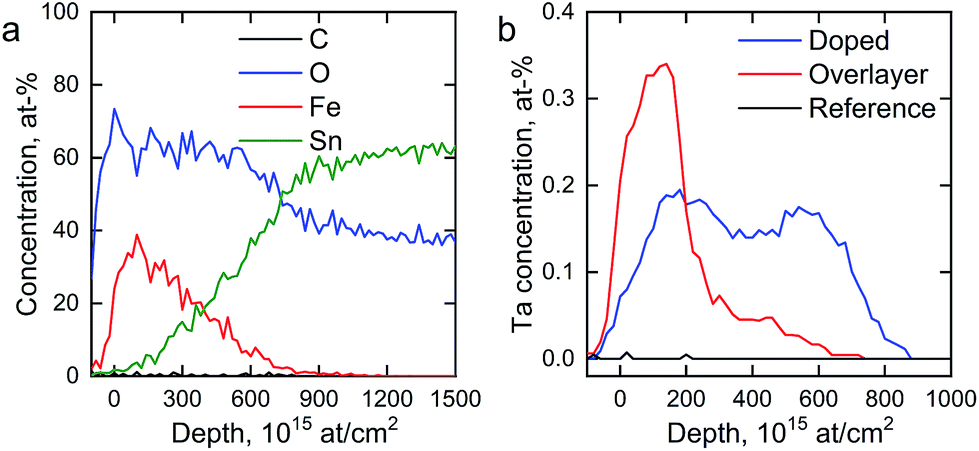 | ||
| Fig. 4 (a) ToF-ERDA elemental depth profile of the reference photoanode and (b) Ta distribution in the hematite photoanodes. | ||
Diffusion of tin from the FTO substrate towards the surface can be seen for all samples in Fig. S2,† however, tin does not diffuse all the way to the surface. The Tof-ERDA results show very little carbon within the films, indicating that the carbon that was observed in the XPS measurements is a surface contaminant from the atmosphere. Tantalum is not observed for the reference photoanode. The Ta2O5-overlayer hematite has a very narrow distribution of tantalum with an extended tail, showing that the Ta2O5 deposition forms a clearly defined overlayer with tantalum diffusing slightly into the hematite layer in the post-deposition annealing. On the other hand, the tantalum distribution in the Ta-doped hematite photoanode is more uniform, suggesting that the annealing step has dispersed the tantalum throughout the hematite layer. A slight surface enrichment can also be seen in the Ta-doped hematite photoanode, as was suggested by the XPS results.
The absorption spectra of the reference and Ta2O5-overlayer hematite presented in Fig. 5a are almost identical, supporting the fact that the hematite layer thickness is identical for both films. Ta2O5 has a band gap of 3.9 eV,28 leading to an overlapping absorption with the glass substrate at around 315 nm. The increase in absorption for the doped sample is a result of the rougher surface of the photoanode scattering incident light, leading to a seeming increase in absorption already at 800 nm. However, the Ta-doped photoanode absorbance is roughly the same as for the other photoanodes when the scattering is taken into consideration.
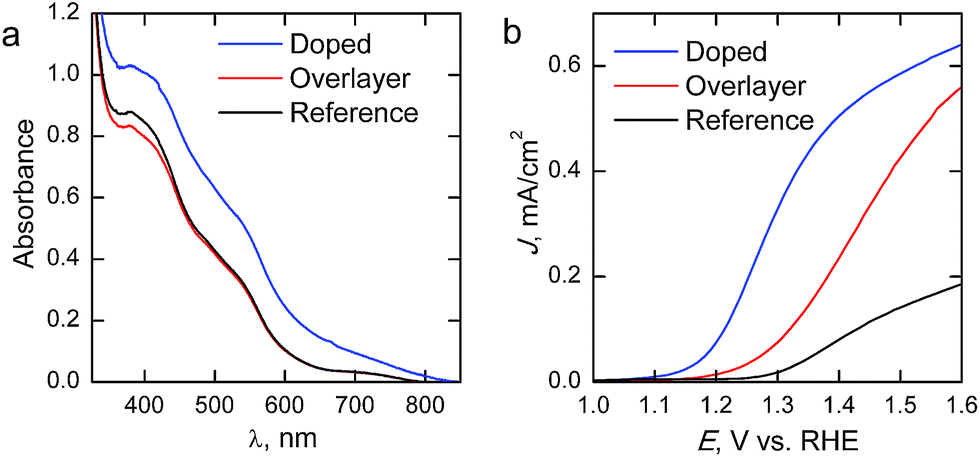 | ||
| Fig. 5 (a) Absorption spectra and (b) photocurrent density–voltage curves of the hematite photoanodes under 1 sun AM1.5G illumination. | ||
Current density–voltage curves under 1 sun AM1.5G illumination are presented in Fig. 5b. The reference hematite films give a photoresponse similar to what has been previously reported for ALD-grown hematite films of similar thickness,20 allowing us to conclude that the photoanodes work as expected. Passivating the surface with 10 cycles (∼0.5 nm) of Ta2O5 results in a three-fold improvement on the photocurrent over the bare hematite photoanode in the whole potential range, while no changes are observed in the onset potential. In a recent paper Forster et al.36 concluded that the optimum Ta2O5 overlayer thickness lies between 0.5 and 2 nm, which also resulted in approximately a three-fold improvement on the photocurrent of nanostructured hematite photoanodes. The improvements in photocurrent are attributed to a passivation of surface states that act as recombination centers. However, our results show that Ta-doping with the same number of ALD-cycles leads to an even larger improvement in photoelectrochemical performance. The Ta-doping approach results in a larger increase in the photocurrent than the Ta2O5-overlayer, along with a 0.15 V cathodic shift in the onset potential, leading to significantly higher photocurrents in the whole potential range shown. Furthermore, the slope of the photocurrent rise after the onset potential is steeper for the Ta-doped sample, which indicates lower resistivity. The decreased resistivity is presumably due to the Ta-doping inducing preferential growth along the {001} facet of hematite, which has previously been reported to lead up to a one order of magnitude increase in conductivity.34
We performed electrochemical impedance spectroscopy (EIS) measurements in order to characterize the surface states present in our materials. Representative Nyquist plots of the materials held at 1.40 V vs. RHE under 1 sun AM1.5G illumination are presented in Fig. 6a. The reference hematite exhibits two clear semicircles, which indicates the presence of two capacitances in the system. The higher frequency (left side) semicircle is only weakly bias dependent, whereas the lower frequency (right side) semicircle first grows with increased bias voltages before disappearing at higher potentials. For the Ta2O5-overlayer hematite two semicircles are also observed, but both semicircles have a much smaller diameter than for the reference hematite. On the other hand, at this applied potential the Ta-doped hematite only exhibits one semicircle, which almost exactly matches with the high frequency semicircle observed for the reference hematite film. However, two clear semicircles are observed for this sample at lower applied potentials.
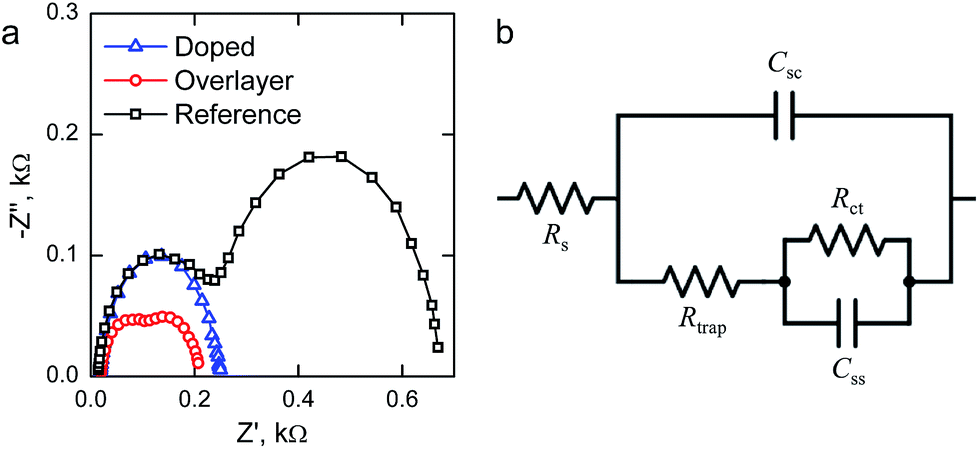 | ||
| Fig. 6 (a) Representative Nyquist plots of the hematite photoanodes determined under 1 sun AM1.5G illumination at 1.40 V vs. RHE and (b) the equivalent circuit used to fit the measured impedance spectra. | ||
To fit the EIS measurements we used the equivalent circuit that has been recently employed for hematite photoanodes by the groups of Hamann and Bisquert, shown in Fig. 6b.9,25,44,45 The equivalent circuit is composed of five elements: the series resistance between the FTO and hematite Rs, the space-charge region capacitance of bulk hematite Csc, the charge trapping resistance to surface states Rtrap, the surface state chemical capacitance Css, and the charge transfer resistance from the surface states to solution Rct.9,11,25
The surface state capacitance (Css) and charge transfer resistance (Rct) of the hematite photoanodes are presented in Fig. 7 as a function of applied bias voltage. The Css has a nearly Gaussian dependence on the bias voltage just above the onset potential, indicating that water oxidation occurs through surface states and via direct hole transfer from the valence band at moderate and highly anodic bias voltages, respectively.9,11Css begins to rise at the same voltage as the photocurrent onset, and reaches a maximum at the potential at which the photocurrent rises most steeply, indicative of capacitive charging of the photoanode surface.45 The Ta2O5-overlayer hematite has a lower surface state capacitance than the reference hematite while the photocurrent is three times larger, indicating that the surface has been efficiently passivated. On the other hand, the Css of the Ta-doped hematite photoanode is more than two times larger than for the reference hematite, even though it exhibits the highest photocurrent values. This is a clear indication that the Ta-doping has not passivated the surface, yet it performs with the highest efficiency. The Rct of all of the photoanodes decreases concomitantly with the increase in Css until the surface state capacitance drops due to hole transfer from the valence band becoming prevalent. The Rct for the Ta-doped hematite is an order of magnitude lower at all bias voltages where the surface state capacitance is observed. The charge transfer resistance in our equivalent circuit is attributed to both electron trapping and detrapping to and from the surface states.9 We believe that the increased performance of the Ta-doped hematite can be attributed to decreased recombination, enabled by the higher conductivity of the material more efficiently extracting electrons away from the photoanode.
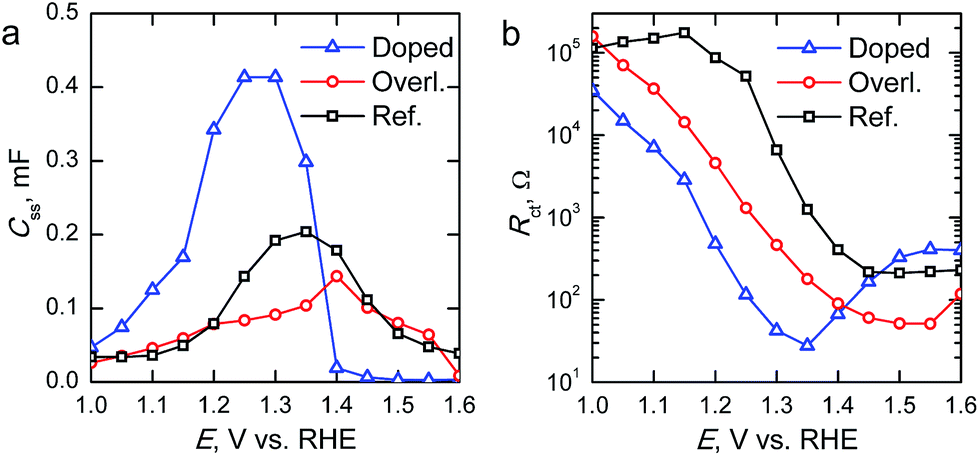 | ||
| Fig. 7 (a) Surface state capacitances (Css) and (b) charge transfer resistances (Rct) of the hematite photoanodes determined under 1 sun AM1.5G illumination. | ||
The chemical nature of the surface states observed under illumination with EIS for hematite photoanodes has been convincingly attributed to the formation of a high valence Fe(IV)![[double bond, length as m-dash]](https://www.rsc.org/images/entities/char_e001.gif) O species by the Hamann group.25,45,46 They showed that the formation of this oxidised surface species resulted in the formation of a new absorption band centered at 572 nm when the photoanode was kept under anodic bias voltages.25 Transient absorption spectroscopy (TAS) performed under operating conditions has been used to show ultrafast sub-picosecond electron trapping into a surface species on the hematite surface, with the trapping extending well into the millisecond timescale.47,48 This trapping is observed as a bleaching (i.e. reduced absorption compared to the ground state) at 575 nm when an anodic bias voltage is applied. We believe that this bleaching occurs when a photogenerated electron is trapped into the surface state seen in the EIS measurements. We have illustrated earlier that an increase in this electron trapping results in the formation of an increased amount of long-lived holes in the hematite surface, resulting in increased photoelectrochemical performance.48 Thus, we performed sub-millisecond to second timescale TAS measurements under operating conditions to elucidate on the differences in charge carrier dynamics and electron trapping between our photoanodes.
O species by the Hamann group.25,45,46 They showed that the formation of this oxidised surface species resulted in the formation of a new absorption band centered at 572 nm when the photoanode was kept under anodic bias voltages.25 Transient absorption spectroscopy (TAS) performed under operating conditions has been used to show ultrafast sub-picosecond electron trapping into a surface species on the hematite surface, with the trapping extending well into the millisecond timescale.47,48 This trapping is observed as a bleaching (i.e. reduced absorption compared to the ground state) at 575 nm when an anodic bias voltage is applied. We believe that this bleaching occurs when a photogenerated electron is trapped into the surface state seen in the EIS measurements. We have illustrated earlier that an increase in this electron trapping results in the formation of an increased amount of long-lived holes in the hematite surface, resulting in increased photoelectrochemical performance.48 Thus, we performed sub-millisecond to second timescale TAS measurements under operating conditions to elucidate on the differences in charge carrier dynamics and electron trapping between our photoanodes.
The transient absorption decays of the hematite photoanodes at 575 nm at selected bias voltages are presented in Fig. 8 and the corresponding biexponential decay component spectra at 1.60 V vs. RHE are presented in Fig. S3.† The decays for the reference hematite photoanode have two components: a negative bleach that disappears completely within 100 ms and a positive transient absorption on longer timescales that is only visible at bias voltages above the photocurrent onset potential. The lifetimes of the components at 1.60 V vs. RHE are 6.4 ms and 405 ms for the bleach and positive signals, respectively. The fast bleach is attributed to prolonged electron trapping into the surface states that we are able to observe with EIS, whereas the positive transient absorption is attributed to long-lived holes in the hematite surface that partake in the water oxidation reaction.47,48 The bleach is a localised band with a minimum at 575 nm, whereas the positive transient absorption is observed in the whole monitored region. The transient absorption decays and decay component spectra of the reference hematite are a good match to those we have published earlier for TiO2-doped hematite photoanodes, even though the electron trapping lifetime of our reference hematite is longer than for the TiO2-doped samples (6.4 ms vs. 0.3 ms, respectively).48 We attribute this difference to the faster electron extraction dynamics from the surface states due to the preferable band alignment of the TiO2-doped material.49 However, the water oxidation dynamics are practically identical (exponential lifetimes 405 ms and 400 ms).
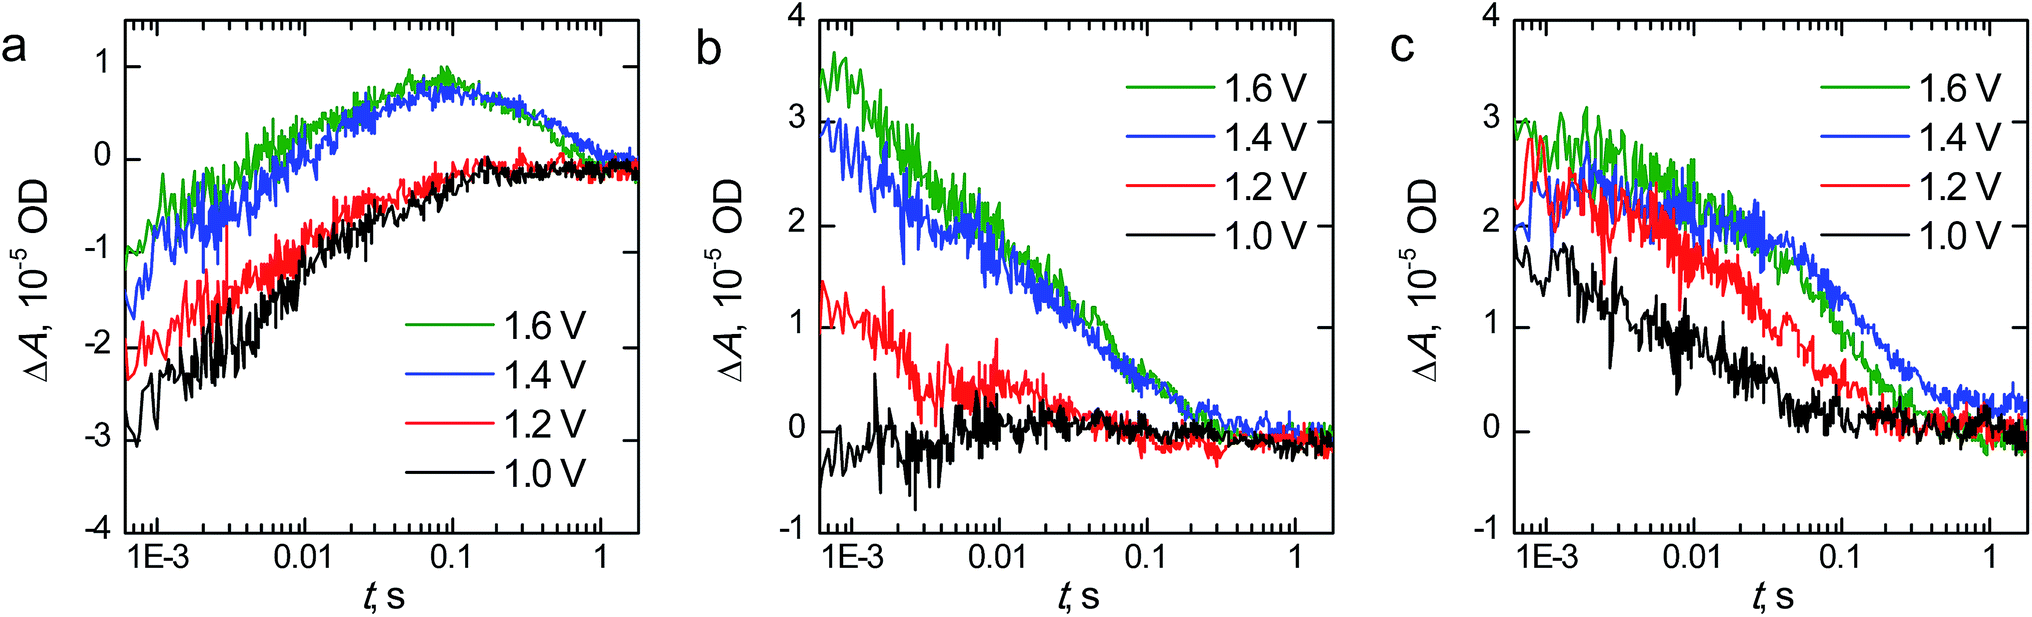 | ||
| Fig. 8 Sub-millisecond to second timescale transient absorption decays at 575 nm of (a) reference, (b) Ta2O5-overlayer, and (c) Ta-doped hematite photoanodes held at selected bias voltages vs. RHE. ΔA is the change in absorbance in dimensionless optical density (OD) units. | ||
In this timescale the transient absorption amplitude for the Ta2O5-overlayer hematite sample is zero at potentials below the photocurrent onset voltage and increases with higher voltages, indicating that all of the transient absorption signal observed originates from long-lived carriers within the depletion region. No negative transient absorption is observed. However, there is a slight dip still visible at 575 nm in the decay component spectra shown in Fig. S3.† This is further evidence that the bleach component observed for the reference hematite sample originates from trapping of photogenerated electrons into the surface states that we observe with EIS. Since the Ta2O5-overlayer passivates these surface states, they are not oxidised due to increased anodic bias voltage, and thus cannot act as trap states for electrons. The transient absorption kinetics are also different when compared to the reference hematite sample. The transient absorption decay at 575 nm is almost an order of magnitude faster, with bi-exponential fit resulting in lifetimes of 3.0 and 65 ms for the fast and slow decay components, respectively. This indicates that water oxidation occurs faster on the passivated hematite surface. The water photo-oxidation kinetics on hematite surfaces are known to be sluggish.50 The hole lifetime in nanostructured TiO2 thin films was measured under similar conditions to be ∼50 ms by Cowan et al.,50 which is close to the lifetime of our Ta2O5-overlayer hematite. Thus, in addition to the reduced recombination due to the surface state passivation, some of the improved photoelectrochemical performance of the Ta2O5-overlayer hematite films may be due to a photocatalytically more favourable surface with a smaller activation energy barrier.50 Tantalum, as a non-3d high valency metal, may improve the catalytic activity via modulating the oxygen evolution reaction energetics in 3d metal oxides, such as hematite.51
The fast component in the transient absorption decays of the Ta-doped hematite is the fastest of the samples with a lifetime of 1.4 ms and smallest in amplitude. This is indicative of reduced recombination of the long-lived surface states.48 Furthermore, the longer component assigned to the reaction of long-lived surface holes with a lifetime of 95 ms is four times faster than for the reference hematite sample. We attribute this to the surface of the material having enough tantalum to influence the water photo-oxidation kinetics, making the reaction faster as was observed for the Ta2O5-overlayer hematite. This is further supported by the similarities between the decay component spectra between the Ta-doped and Ta2O5-overlayer hematite. The Ta-doped hematite exhibits a positive transient absorption even at 1.0 V vs. RHE. This is presumably due to the observed anodic shift both in the photocurrent and surface state capacitance leading to accumulation of surface holes at lower potentials. The decay at 1.0 V vs. RHE does not have a long-lived component, indicating that the long-lived holes decay rapidly due to electron back recombination.52 As a conclusion, TAS measurements under operating conditions indicate the reason to the increased photoelectrochemical performance of the Ta-doped hematite to be due to reduced recombination and charge trapping to defect states.
Although the Ta-doped hematite does have a dip in the transient absorption centered around 575 nm that is very similar to the surface passivated Ta2O5-overlayer hematite (see Fig. S3†), the EIS measurements show that it has the largest surface state capacitance. We would expect that the bleaching in TAS would be more pronounced with samples where the surface state capacitance is larger if the electron trapping occurs to the same surface states that are observed with EIS. From our results it seems that this is not the case here. However, it is also possible that the higher conductivity of the Ta-doped hematite also increases the rate of photoelectron detrapping. We have previously shown that electron trapping in hematite occurs already in the sub-nanosecond timescale.48 Forster et al. showed that an Al2O3-overlayer significantly increased the rate of photoelectron detrapping in oxygen deficient hematite photoanodes,27 although the same group did not observe significant changes in the detrapping rate with Ta2O5-overlayered hematite.36 Thus, it is possible that the limited time-scale of our measurement system may miss the trapping in the Ta-doped hematite.
We next turn to transient absorption spectroscopy in the sub-picosecond to nanosecond timescale to probe the ultrafast charge carrier relaxation and recombination processes. The transient absorption spectra are presented as contour plots in Fig. 9. The normalized transient absorption spectra at selected delay times are shown in Fig. S4† and the transient absorption decays at wavelengths with the largest transient absorption and bleach signals are shown in Fig. S5.† On this timescale the transient absorption signal is composed of a superposition of the absorptions of photogenerated electrons, holes, and the ground state bleach. All three samples exhibit a strong positive transient absorption band centered around 585 nm, with a diffuse low energy tail and a sharp high energy edge around the band gap energy. This transient absorption has previously been assigned to originate dominantly from the absorption of photoexcited electrons.53 However, recent investigations of hematite photoanodes under applied bias voltages have revealed a positive absorption at the same wavelength that is formed due to a high valence iron-oxo species, as discussed earlier. Furthermore, our previous results show that ultrafast electron trapping into oxidized surface states inverts the positive absorption ∼580 nm into a bleaching signal that we can observe still in the millisecond timescale in Fig. 8.48 Thus, we conclude that the main component of the positive transient absorption is due to photogenerated holes in hematite.54 All three samples also exhibit a transient bleach signal below 550 nm, attributed to the bleaching of the ground state absorption due to mostly photogenerated electrons, with a secondary weak positive transient absorption band that is split around 500 nm. However, it seems that the bleach intensity grows in the order of reference, Ta2O5-overlayer, and Ta-doped hematite. The major differences between the samples in the transient absorption spectra lie in the range between 450–550 nm. The transient absorption decays at selected wavelengths from this region are presented in Fig. 10. The four exponential decay component spectra of the different lifetime components are shown in Fig. S6.†
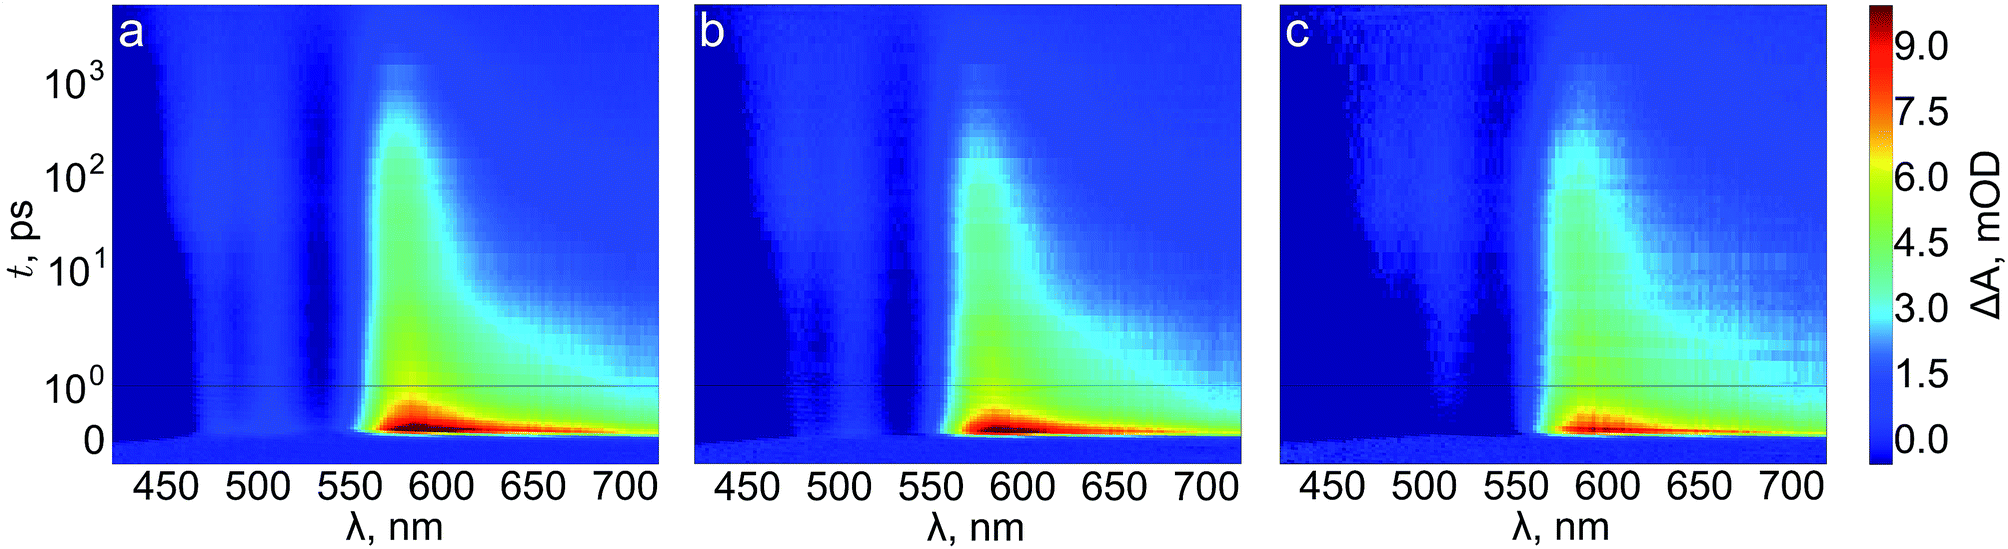 | ||
| Fig. 9 Transient absorption contour plots of (a) reference, (b) Ta2O5-overlayer, and (c) Ta-doped hematite photoanodes in air. | ||
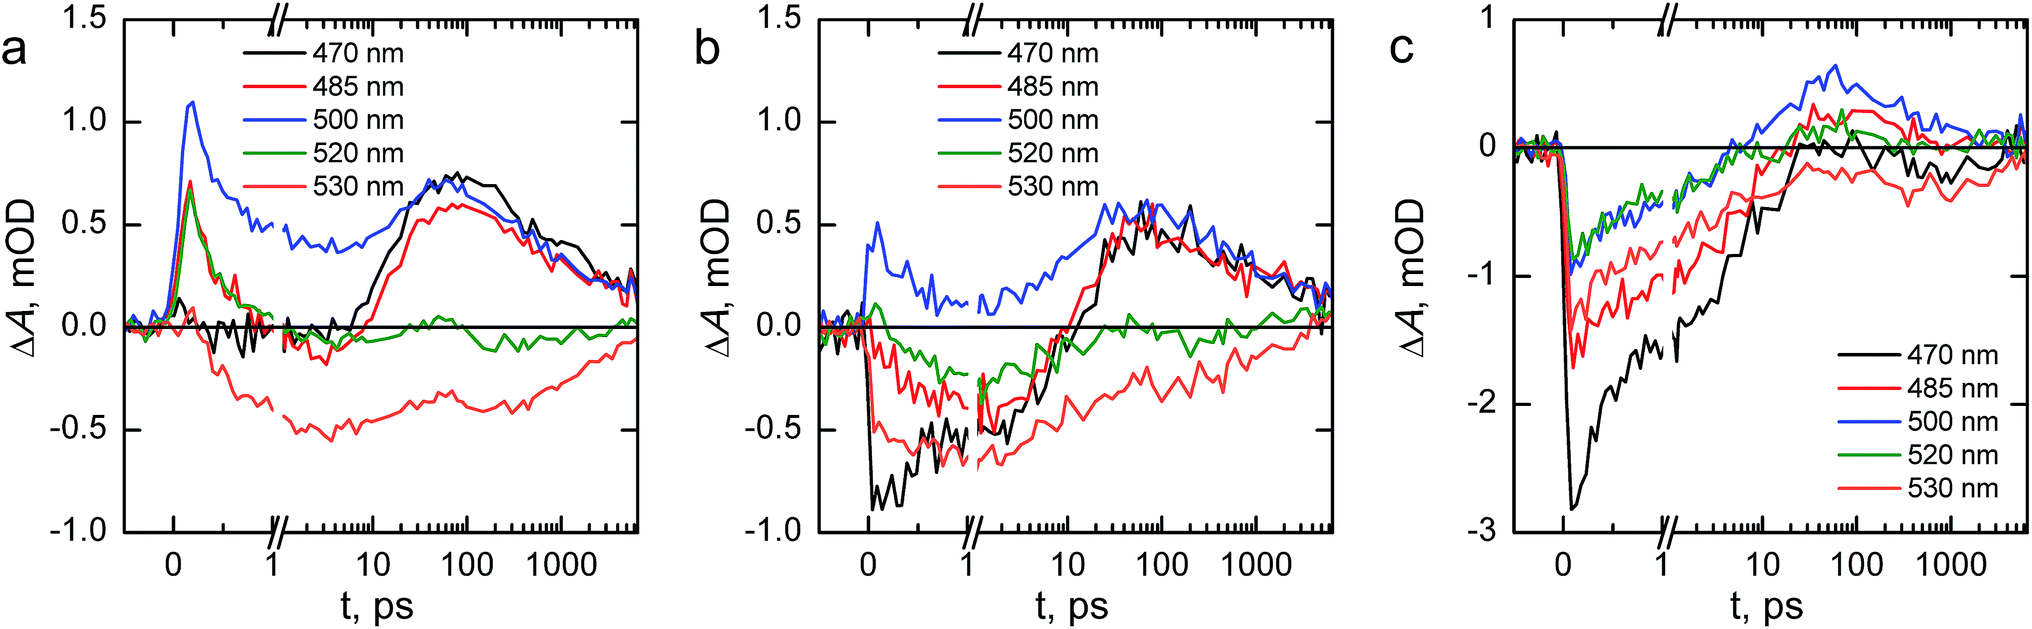 | ||
| Fig. 10 Transient absorption decays at selected wavelengths of (a) reference, (b) Ta2O5-overlayer, and (c) Ta-doped hematite photoanodes in air. The timescale is linear until 1 ps and logarithmic for longer delay times. | ||
We will first consider the ultrafast dynamics in the reference hematite photoanode in Fig. 10a. The initial relaxation of hot electrons takes place with a lifetime of 0.21 ps,55,56 with the decay amplitude amounting to approximately 50% of the transient absorption immediately after excitation (see Fig. S5 and S6†). This initial decay is mainly observed at wavelengths with positive transient absorption above 570 nm, although a small bleach recovery is observed at wavelengths below 450 nm with this lifetime. The fast relaxation is presumably due to the formation of polarons in the hematite bulk, partially trapping the charge carriers.57 The generation of itinerant photoexcited electrons56 that are free to travel in the conduction band is most clearly observed in the bleach that is formed with a lifetime of 1.6 ps at 530 nm, with a simultaneous decay observed over most of the spectrum above 500 nm. The free conduction electrons are trapped by midgap states,55 which is seen as a reduction in the bleach at 530 and 520 nm and a formation of a positive transient absorption at 500, 485, and 470 nm with a lifetime of 46 ps. Interestingly, the 470 nm signal shows almost zero transient absorption until the formation increases its transient absorption. Finally, the remaining free and midgap trapped electrons decay into the ground state with a lifetime of 2.4 ns.
The ultrafast dynamics of the Ta2O5-overlayer hematite exhibit a few noted differences when compared with the reference hematite. Only the signal at 500 nm has a positive transient absorption immediately after excitation, having the same 0.21 ps decay component associated with the relaxation of hot electrons. At 470 and 530 nm a bleach is formed immediately after excitation, with further bleaching with a lifetime of 2.1 ps assigned to the formation of free conduction band electrons observed at 530, 520, and 485 nm. Thus, the formation of free electrons in the Ta2O5-overlayer hematite is more rapid and observed over a wider energetic range. The trapping of the conduction band electrons by midgap states occurs with a slower lifetime of 61 ps, with nearly identical amplitudes as for the reference hematite. Furthermore, the decay of the free and trapped electrons occurs with a lifetime of 3.4 ns, markedly slower than for the reference hematite. We attribute the faster generation and slower recombination dynamics of electrons to a reduction in surface state assisted recombination.
However, the transient absorption dynamics for the Ta-doped hematite are drastically different from the reference and Ta2O5-overlayer hematite photoanodes. The bleach at 470 nm is now three times larger in amplitude than for the Ta2O5-overlayer hematite, whereas for the reference hematite no bleach was observable at this wavelength. All other wavelengths in the 450–550 nm range are also bleached immediately after excitation, most clearly visible in the raw and decay component spectra immediately after excitation as shown in Fig. S7.† The bleach recovery has two recovery components with lifetimes of 0.38 and 7.7 ps. We interpret this strong bleach immediately after excitation as indication that even the hot electrons are free to travel in the Ta-doped hematite, instead of being excitonically bound. The 0.38 ps component would then be the thermalization lifetime of the free hot electrons, whereas 7.7 ps is the lifetime of the trapping of these free electrons by the midgap states that form a positive transient absorption at 485 and 500 nm. A small component with a lifetime of 270 ps is observed to reduce the transient absorption at all wavelengths in this range, followed by a decay with a lifetime of 5.9 ns. The observation that free electrons are more freely generated and decay with the longest lifetime in the Ta-doped hematite suggests that the Ta-doping increases the conductivity in the hematite bulk substantially. This conductivity increase alters the ultrafast charge carrier dynamics and separation, leading to noticeable improvements in photoelectrochemical performance.
4 Conclusions
We employed atomic layer deposition to prepare 50 nm thick hematite photoanodes followed by passivating them with a 0.5 nm thick Ta2O5-overlayer samples and compared them with samples uniformly doped with same amount of tantalum oxide deposition cycles. The passivating of hematite surface states resulted in a three-fold improvement in photocurrent with the same onset voltage, while electrochemical impedance spectroscopy under visible light irradiation showed a decreased amount of surface states under water splitting conditions. The Ta-doped samples had the same increase in photocurrent along with a 0.15 V cathodic shift in the onset voltage and decreased resistivity. The surface state capacitance for the Ta-doped sample was double that of the reference photoanode, which implies a larger amount of surface hole accumulation to surface states to which electrons may be trapped into. We utilized transient absorption spectroscopy in the sub-millisecond to second timescale under operating conditions that indicated that electron trapping in both Ta2O5-passivated and Ta-doped samples was markedly reduced. Ultrafast transient absorption spectroscopy in the sub-picosecond to nanosecond timescale illustrated increased electron mobility with free electrons forming immediately after excitation. Furthermore, the recombination in the Ta-doped hematite photoanode was reduced, resulting in the increased photoelectrochemical performance when compared with the Ta2O5-overlayer sample. Our results show that the commonly employed passivation strategy does not affect the poor charge carrier dynamics intrinsic to hematite based photoanodes. The large effect on the water splitting performance that electron trapping into surface states has in hematite based photoanodes has only recently been observed. Our Ta-doping strategy results in more efficient electron extraction, solving the electron trapping issue and leading to increased performance over the surface passivation strategy.Conflicts of interest
There are no conflicts to declare.Acknowledgements
T.-P. R. was supported by the Finnish Cultural Foundation. H. A. was supported by the Jenny and Antti Wihuri Foundation. This work was supported by the Academy of Finland, decision numbers 141481, 286713, and 309920. The research was also supported by the Finnish Centre of Excellence in Atomic Layer Deposition.References
- K. L. Hardee and A. J. Bard, J. Electrochem. Soc., 1976, 123, 1024–1026 CrossRef CAS.
- A. Murphy, P. Barnes, L. Randeniya, I. Plumb, I. Grey, M. Horne and J. Glasscock, Int. J. Hydrogen Energy, 2006, 31, 1999–2017 CrossRef CAS.
- K. Sivula, F. Le Formal and M. Grätzel, ChemSusChem, 2011, 4, 432–449 CrossRef CAS PubMed.
- K. Sivula, J. Phys. Chem. Lett., 2013, 4, 1624–1633 CrossRef CAS PubMed.
- R. K. Quinn, R. Nasby and R. Baughman, Mater. Res. Bull., 1976, 11, 1011–1017 CrossRef CAS.
- J. H. Kennedy and K. W. Frese, J. Electrochem. Soc., 1978, 125, 709–714 CrossRef CAS.
- M. P. Dare-Edwards, J. B. Goodenough, A. Hamnett and P. R. Trevellick, J. Chem. Soc., Faraday Trans. 1, 1983, 79, 2027–2041 RSC.
- K. Itoh and J. O. Bockris, J. Appl. Phys., 1984, 56, 874–876 CrossRef CAS.
- L. Bertoluzzi, P. Lopez-Varo, J. A. J. Tejada and J. Bisquert, J. Mater. Chem. A, 2016, 4, 2873–2879 RSC.
- A. Hellman and R. G. Pala, J. Phys. Chem. C, 2011, 115, 12901–12907 CrossRef CAS.
- B. Iandolo and A. Hellman, Angew. Chem., Int. Ed., 2014, 126, 13622–13626 CrossRef.
- O. Zandi and T. W. Hamann, J. Phys. Chem. Lett., 2014, 5, 1522–1526 CrossRef CAS PubMed.
- Y. Yang, M. Forster, Y. Ling, G. Wang, T. Zhai, Y. Tong, A. J. Cowan and Y. Li, Angew. Chem., Int. Ed., 2016, 55, 3403–3407 CrossRef CAS PubMed.
- T. Hisatomi, F. Le Formal, M. Cornuz, J. Brillet, N. Tétreault, K. Sivula and M. Grätzel, Energy Environ. Sci., 2011, 4, 2512–2515 RSC.
- M. Barroso, C. A. Mesa, S. R. Pendlebury, A. J. Cowan, T. Hisatomi, K. Sivula, M. Grätzel, D. R. Klug and J. R. Durrant, Proc. Natl. Acad. Sci. U. S. A., 2012, 109, 15640–15645 CrossRef CAS PubMed.
- C. Du, M. Zhang, J.-W. Jang, Y. Liu, G.-Y. Liu and D. Wang, J. Phys. Chem. C, 2014, 118, 17054–17059 CrossRef CAS.
- L. Steier, I. Herraiz-Cardona, S. Gimenez, F. Fabregat-Santiago, J. Bisquert, S. D. Tilley and M. Grätzel, Adv. Funct. Mater., 2014, 24, 7681–7688 CrossRef CAS.
- R. Liu, Z. Zheng, J. Spurgeon and X. Yang, Energy Environ. Sci., 2014, 7, 2504–2517 RSC.
- T. Wang, Z. Luo, C. Li and J. Gong, Chem. Soc. Rev., 2014, 43, 7469–7484 RSC.
- O. Zandi, B. M. Klahr and T. W. Hamann, Energy Environ. Sci., 2013, 6, 634–642 RSC.
- X. Yang, R. Liu, C. Du, P. Dai, Z. Zheng and D. Wang, ACS Appl. Mater. Interfaces, 2014, 6, 12005–12011 CrossRef CAS PubMed.
- X. Li, P. S. Bassi, P. P. Boix, Y. Fang and L. H. Wong, ACS Appl. Mater. Interfaces, 2015, 7, 16960–16966 CrossRef CAS PubMed.
- F. Le Formal, N. Tétreault, M. Cornuz, T. Moehl, M. Grätzel and K. Sivula, Chem. Sci., 2011, 2, 737–743 RSC.
- F. Le Formal, K. Sivula and M. Grätzel, J. Phys. Chem. C, 2012, 116, 26707–26720 CrossRef CAS.
- B. Klahr and T. Hamann, J. Phys. Chem. C, 2014, 118, 10393–10399 CrossRef CAS.
- M. G. Ahmed, I. E. Kretschmer, T. A. Kandiel, A. Y. Ahmed, F. A. Rashwan and D. W. Bahnemann, ACS Appl. Mater. Interfaces, 2015, 7, 24053–24062 CrossRef CAS PubMed.
- M. Forster, R. J. Potter, Y. Ling, Y. Yang, D. R. Klug, Y. Li and A. J. Cowan, Chem. Sci., 2015, 6, 4009–4016 RSC.
- W.-J. Chun, A. Ishikawa, H. Fujisawa, T. Takata, J. N. Kondo, M. Hara, M. Kawai, Y. Matsumoto and K. Domen, J. Phys. Chem. B, 2003, 107, 1798–1803 CrossRef CAS.
- C. Chaneliere, J. Autran, R. Devine and B. Balland, Mater. Sci. Eng., R, 1998, 22, 269–322 CrossRef.
- P. Zhang, J. Zhang and J. Gong, Chem. Soc. Rev., 2014, 43, 4395–4422 RSC.
- V. Aroutiounian, V. Arakelyan, G. Shahnazaryan, G. Stepanyan, J. A. Turner and O. Khaselev, Int. J. Hydrogen Energy, 2002, 27, 33–38 CrossRef CAS.
- C. Jorand-Sartoretti, B. D. Alexander, R. Solarska, I. A. Rutkowska, J. Augustynski and R. Cerny, J. Phys. Chem. B, 2005, 109, 13685–13692 CrossRef PubMed.
- Y. Fu, C.-L. Dong, Z. Zhou, W.-Y. Lee, J. Chen, P. Guo, L. Zhao and S. Shen, Phys. Chem. Chem. Phys., 2016, 18, 3846–3853 RSC.
- X. Zhang, H. Li, S. Wang, F.-R. F. Fan and A. J. Bard, J. Phys. Chem. C, 2014, 118, 16842–16850 CrossRef CAS.
- C. Li, T. Wang, Z. Luo, D. Zhang and J. Gong, Chem. Commun., 2015, 51, 7290–7293 RSC.
- M. Forster, R. J. Potter, Y. Yang, Y. Li and A. J. Cowan, ChemPhotoChem, 2018, 2, 183–189 CrossRef CAS.
- J. A. Klug, N. G. Becker, S. C. Riha, A. B. Martinson, J. W. Elam, M. J. Pellin and T. Proslier, J. Mater. Chem. A, 2013, 1, 11607–11613 RSC.
- T. Suntola, Thin Solid Films, 1992, 216, 84–89 CrossRef CAS.
- K. Kukli, M. Ritala and M. Leskelä, J. Electrochem. Soc., 1995, 142, 1670–1675 CrossRef CAS.
- K. Lahtonen, M. Lampimäki, P. Jussila, M. Hirsimäki and M. Valden, Rev. Sci. Instrum., 2006, 77, 083901 CrossRef.
- J. H. Scofield, J. Electron Spectrosc. Relat. Phenom., 1976, 8, 129–137 CrossRef CAS.
- J. Jokinen, J. Keinonen, P. Tikkanen, A. Kuronen, T. Ahlgren and K. Nordlund, Nucl. Instrum. Methods Phys. Res., Sect. B, 1996, 119, 533–542 CrossRef CAS.
- M. C. Biesinger, B. P. Payne, A. P. Grosvenor, L. W. Lau, A. R. Gerson and R. S. C. Smart, Appl. Surf. Sci., 2011, 257, 2717–2730 CrossRef CAS.
- B. Klahr, S. Gimenez, F. Fabregat-Santiago, T. Hamann and J. Bisquert, J. Am. Chem. Soc., 2012, 134, 4294–4302 CrossRef CAS PubMed.
- B. Klahr, S. Gimenez, F. Fabregat-Santiago, J. Bisquert and T. W. Hamann, Energy Environ. Sci., 2012, 5, 7626–7636 RSC.
- O. Zandi and T. W. Hamann, Nat. Chem., 2016, 8, 778–783 CrossRef CAS PubMed.
- S. R. Pendlebury, X. Wang, F. Le Formal, M. Cornuz, A. Kafizas, S. D. Tilley, M. Grätzel and J. R. Durrant, J. Am. Chem. Soc., 2014, 136, 9854–9857 CrossRef CAS PubMed.
- T.-P. Ruoko, K. Kaunisto, M. Bärtsch, J. Pohjola, A. Hiltunen, M. Niederberger, N. V. Tkachenko and H. Lemmetyinen, J. Phys. Chem. Lett., 2015, 6, 2859–2864 CrossRef CAS PubMed.
- D. Monllor-Satoca, M. Bärtsch, C. Fàbrega, A. Genç, S. Reinhard, T. Andreu, J. Arbiol, M. Niederberger and J. R. Morante, Energy Environ. Sci., 2015, 8, 3242–3254 RSC.
- A. J. Cowan, C. J. Barnett, S. R. Pendlebury, M. Barroso, K. Sivula, M. Grätzel, J. R. Durrant and D. R. Klug, J. Am. Chem. Soc., 2011, 133, 10134–10140 CrossRef CAS PubMed.
- B. Zhang, X. Zheng, O. Voznyy, R. Comin, M. Bajdich, M. García-Melchor, L. Han, J. Xu, M. Liu, L. Zheng, F. P. García de Arquer, C. T. Dinh, F. Fan, M. Yuan, E. Yassitepe, N. Chen, T. Regier, P. Liu, Y. Li, P. De Luna, A. Janmohamed, H. L. Xin, H. Yang, A. Vojvodic and E. H. Sargent, Science, 2016, 352, 333–337 CrossRef CAS PubMed.
- F. Le Formal, S. R. Pendlebury, M. Cornuz, S. D. Tilley, M. Grätzel and J. R. Durrant, J. Am. Chem. Soc., 2014, 136, 2564–2574 CrossRef CAS PubMed.
- S. Sorenson, E. Driscoll, S. Haghighat and J. M. Dawlaty, J. Phys. Chem. C, 2014, 118, 23621–23626 CrossRef CAS.
- A. Hiltunen, T.-P. Ruoko, T. Iivonen, K. Lahtonen, H. Ali-Löytty, E. Sarlin, M. Valden, M. Leskelä and N. Tkachenko, Sustainable Energy Fuels, 2018, 2, 2124–2130 RSC.
- A. G. Joly, J. R. Williams, S. A. Chambers, G. Xiong, W. P. Hess and D. M. Laman, J. Appl. Phys., 2006, 99, 053521 CrossRef.
- L. Fu, Z. Wu, X. Ai, J. Zhang, Y. Nie, S. Xie, G. Yang and B. Zou, J. Chem. Phys., 2004, 120, 3406–3413 CrossRef CAS PubMed.
- J. Husek, A. Cirri, S. Biswas and L. R. Baker, Chem. Sci., 2017, 8, 8170–8178 RSC.
Footnotes |
| † Electronic supplementary information (ESI) available: XPS elemental analysis table and transient absorption fitting details, decay component spectra, and additional decays. See DOI: 10.1039/c8ta09501a |
| ‡ Present address: Laboratory of Organic Electronics, Department of Science and Technology, Linköping University, SE-60174 Norrköping, Sweden. |
| This journal is © The Royal Society of Chemistry 2019 |