
 Open Access Article
 This Open Access Article is licensed under a
 Creative Commons Attribution 3.0 Unported Licence
Size- and density-controlled photodeposition of metallic platinum nanoparticles on titanium dioxide for photocatalytic applications†
Camilla
Tossi
 *a,
Lassi
Hällström
a,
Jorma
Selin
a,
Marko
Vaelma
a,
Erich
See
a,
Jouko
Lahtinen
b and
Ilkka
Tittonen
a
*a,
Lassi
Hällström
a,
Jorma
Selin
a,
Marko
Vaelma
a,
Erich
See
a,
Jouko
Lahtinen
b and
Ilkka
Tittonen
a
aAalto University, Department of Electronics and Nanoengineering, Espoo, 02150, Finland. E-mail: camilla.tossi@aalto.fi
bAalto University, Department of Applied Physics, Espoo, 02150, Finland
First published on 27th March 2019
Abstract
Photodeposition has been demonstrated to be a reliable tool for the growth of co-catalyst nanoparticles on titanium dioxide. The current state of investigation on the technique, however, lacks a comprehensive study on the collective influence of different process parameters, preferring to confront the effect of a single parameter at a time. This paper presents a parametric study on photodeposition of platinum nanoparticles from liquid precursors on ALD-grown titanium dioxide, applicable to the fabrication of photocatalytic composite materials. In the described process, a systematic and rigorous statistical analysis of the photodeposition parameters is conducted, assessing the influential parameters that control and predict the size, density and loading of the deposited nanoparticles. The results are assessed by scanning electron microscopy, statistical analysis of micrographs, and X-ray photoelectron spectroscopy. This confirms the simplicity and the viability of photodeposition as a method for the self-assembly of metal nanoparticles from liquid precursors and provides all-round insight on the role of parameters such as the concentration of sacrificial reagents, the presence of H2SO4, and the concentration of the precursor solution, in the chemical and structural properties of the deposited nanoparticles.
Introduction
Since its water-splitting properties have been demonstrated by the pioneering work by Fujishima and Honda,1 titanium dioxide has been exhaustively studied2 to assess its photocatalytic properties. In combination with its low cost, chemical and thermal stability,3 earth-abundance4 and non-toxicity when in bulk form,5 the photocatalytic activity of TiO2![[thin space (1/6-em)]](https://www.rsc.org/images/entities/char_2009.gif) 6,7 makes it an attractive material for the production of hydrogen fuel8 and environmental remediation.9,10
6,7 makes it an attractive material for the production of hydrogen fuel8 and environmental remediation.9,10
The applicability of TiO2 is limited by its wide bandgap, which prevents the full exploitation of sunlight as a photocatalytic force,11,12 and also by the high recombination rate of charge carriers,13 which prevents efficient charge transfer to other media. One way of overcoming said limit is the addition of noble metals or other semiconductors as co-catalysts,14–16 thus facilitating the separation and the migration of photogenerated charge carriers,17 lowering the activation energy of reactions in water electrolysis,18 and suppressing photocorrosion in order to increase the stability of the semiconductor.17
A straightforward method for adding co-catalysts is the deposition of metal nanoparticles on TiO2: noble metals can additionally provide plasmonic enhancement to photocatalytic activity19 by the expansion of the light-absorption range, by hot electron injection and also thanks to resonant energy transfer from the nanoparticles to the supporting photocatalyst.
Nanoparticles can be deposited on semiconductors by various methods, e.g. electrodeposition,20 sputtering,21 impregnation,22 physical mixing23 and, as illustrated in the present work, photodeposition.
Photodeposition has been well established for decades as a technique for assembling metal nanoparticles.24,25 However, the interest of the scientific community in photodeposition has been steadily growing. One reason is the applicability in photocatalytic processes such as water splitting, decomposition of organic compounds and air purification from harmful hydrocarbons,26,27 and even drug synthesis;28 another reason is the smaller environmental impact and the lesser costs, compared to methods that require a high temperature or an electrical bias.
A reliable control26 of the photodeposition results is necessary to avoid under- or overloading the co-catalyst, since an excessive deposition can lead to the coverage of the photosensitive material, or to such nanoparticle sizes where the smaller surface area hinders the photocatalytic activity.17 Moreover, the size of the platinum nanoparticles can affect the selectivity of the photocatalytic process.29 However, the joint influence of the parameters at stake (presence of sacrificial reagents, pH of the precursor solutions, structural properties of the substrate materials, thermal treatments) continues to be a topic in need of further investigation.26 While a large body of work exists on the effects of Pt doping or deposition on TiO2 as far as the photocatalytic activity is concerned, less focus is aimed at the examination of the factors that jointly affect the fabrication.30
The method hereby presented is pairing an efficient and fast recipe for the assembly of metal co-catalysts on anatase TiO231 with a rigorous and straightforward statistical analysis of the experimental results of photodeposition of platinum on a TiO2 substrate, tracking the influence of a full set of parameters with a small number of samples in order to still achieve a sufficient control over the size and the load of the nanoparticles. The photodeposited samples show densely packed platinum nanoparticles which are less than 10 nanometers in diameter. The statistical analysis determines the process parameters that more heavily influence the size and the density of the nanoparticles. In the present work, chloroplatinic acid (H2PtCl6) is used as a precursor,32,33 and the examined parameters are the concentration of methanol (used as a hole scavenger), addition of H2SO4 as a reducing agent, the precursor concentration, the purge time (to eliminate the dissolved oxygen), the intensity and duration of the illumination, and a thermal treatment of the substrates prior to the photodeposition.
The technique can also apply to TiO2 nanostructures, favoring the localization of the noble metal particles,34 or nanopatterning, by selecting the exposed areas using an electron beam lithography mask.35,36 It is also implemented on other promising semiconductors, such as ZnO,37 WO338 or CdS39 nanostructures, side by side with techniques aimed to improve the performances of semiconductors, such as crystal facet engineering40 and other optimizations of the shape and crystallinity in thin films and nanoparticles alike.
Experimental
Reagents and materials
Chloroplatinic acid, fluorine-doped tin-oxide (FTO) coated glass and methanol were acquired from Sigma Aldrich. In addition, glass cover slips with Teflon spacers (LifterSlip Microarray Glass Coverslips 22 × 5 mm2) were purchased from Arrayit Corporation.Substrate preparation
Photodeposition surfaces were prepared by atomic layer deposition (ALD) of TiO2 onto FTO-coated glass slides, using a Beneq TFS-500 ALD reactor (Fig. 1a(2)). The growth was carried out with 4500 pulses from water and titanium tetrachloride (TiCl4) precursors at 250 °C, resulting in a 250 nm layer of anatase crystals (Fig. 1c(1)). After the deposition, the sample substrate was covered with photoresist to ensure surface cleanliness during storage. To remove the photoresist, the sample was ultrasonicated in acetone, followed by subsequent rinses in acetone, isopropyl alcohol, and de-ionized water (DIW) to remove any remaining organic solvents and then dried with a stream of N2.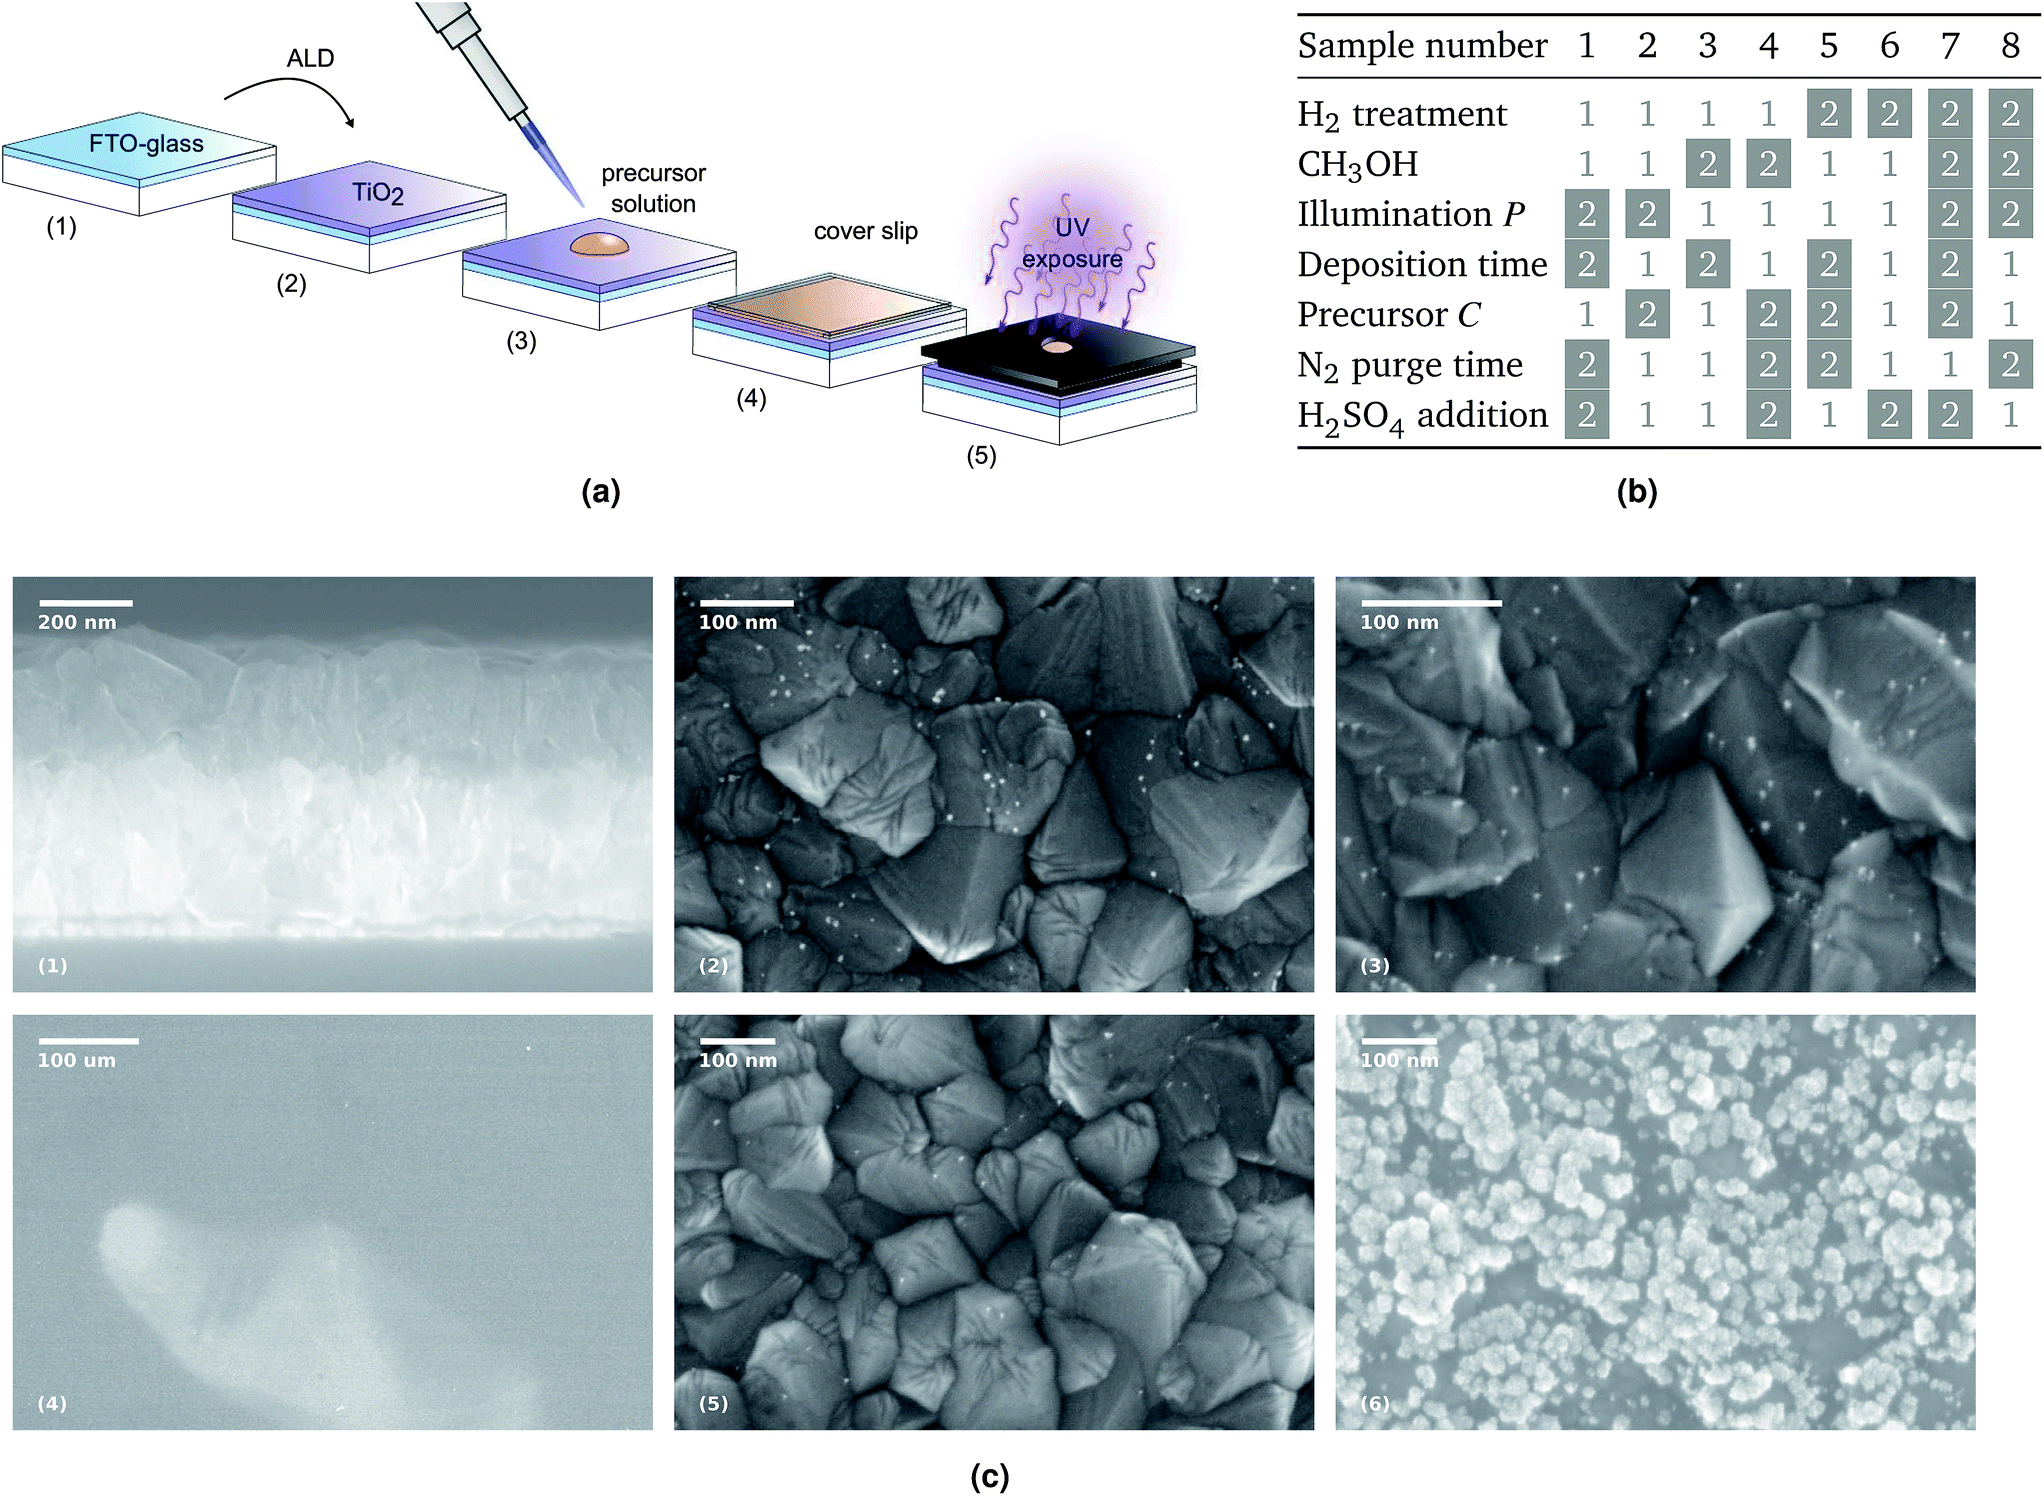 | ||
| Fig. 1 (a) Sample preparation and exposure: the H2 thermal treatment, when applied, takes place between steps (2) and (3). The illuminated area of the sample is 0.15 cm2 out of 5.5 cm2. (b) The eight combinations of parameters for each sample: the white boxes refer to value 1 in Table 1, while the gray boxes refer to value 2. (c) SEM micrographs: on the top, from left to right, are the section of the FTO-coated glass after the TiO2 deposition, and the surfaces of samples 5 and 8 after the platinum photodeposition, showing the nanoparticles in white. On the bottom, three micrographs from sample 7, showing the clear-colored platinum oxide well visible already at a low magnification, and higher magnifications of the darker area, where a few metallic particles are visible, and of the clear area, with the characteristic growth patters for platinum oxide. | ||
Prior to photodeposition, half of the samples underwent H2 thermal treatment in a PEO-601/ATV furnace in a forming gas atmosphere with a flow rate of 3 L min−1 and composed at 5% of hydrogen and at 95% of nitrogen. The samples were heated at a rate of 10 °C min−1 to a temperature of 400 °C, held for 2 hours, then cooled with an N2 purge. The samples were finally stored in N2 atmosphere until the photodeposition.
Precursor solutions
In order to produce a 10 mg mL−1 stock solution, 50 μL of 8 wt% solution of H2PtCl6 were diluted with 370 μL of DIW. To create the sample solutions, DI water was adjusted if needed according to the process parameters by adding H2SO4 to a concentration of 0.1 mM and then purged with N2 gas for 30 minutes to remove any dissolved oxygen. Afterwards, the DI water, precursor stock, and sacrificial donor (methanol) were combined in the different concentrations to form the sample solution. Once a solution was prepared, 20 μL were taken and placed on the cleaned TiO2 substrate surface (Fig. 1a(3)), then covered with a cover-slip mounted on Teflon spacers to create a 20 μL cavity (Fig. 1a(4)). Teflon tape was then used to seal the edges of the cover slip, sealing it to the substrate surface.Sampling method
The process design method developed by G. Taguchi41 was used to determine the sampling required to explore the seven parameters mentioned in the introduction, with two levels for each parameter as illustrated in Table 1. Assuming that the parameters bear no influence on each other, but only affect the final result, eight is the minimum number of samples necessary to ensure that all the other parameters are represented in equal amounts, providing however unique combinations of every value of every parameters, which in turn enables to recognize the effects of the parameters. This is illustrated in the table in Fig. 1b, and this sampling scheme is called an orthogonal array. The choice of the processing parameters is discussed in the introduction and it was based on literature26,33,42–54 and on experimental tests that explored subsets of parameters in order to ascertain the lack of relative influence and the conditions that would lead to a successful photodeposition. The concentration values chosen for the methanol reagent are based on the study by Pan et al.52 in order to aim for a methanol content three orders of magnitude larger than the chloroplatinic acid, thus obtaining a solution rich in donor electrons. The concentration of H2PtCl6 stems from the work conducted by Herrmann et al.,33 who assessed that a concentration higher than 2 mM, corresponding to value 1 in Table 1, led to a constant deposition rate.| Parameters | Value 1 | Value 2 |
|---|---|---|
| H2 thermal treatment | No | Yes |
| MeOH concentration [vol%] | 5 | 10 |
| Illumination power [μW] | 35 | 70 |
| Deposition time [min] | 60 | 120 |
| Precursor concentration [mg mL−1] | 1 | 2 |
| N2 purge time [min] | 15 | 30 |
| H2SO4 addition | Yes | No |
Photodeposition
The sealed sample was secured to a sample holder with a built-in 4.4 mm diameter aperture. The sample holder was then placed facing a light source, as shown in Fig. 1a(5). A 1000 W Oriel model 66021 xenon lamp and Oriel MS257 monochromator set at 360 nm were used to expose the sample. The light intensity at the sample surface was moderated by altering the distance between the sample stage and the monochromator output. The optical intensity of the light was measured with a S130VC Slim Sensor detector coupled to a Thorlabs PM100D power-meter. The two positions selected for this experiment resulted in optical intensities of 70 and 35 μW, which correspond to irradiances of 460 and 230 μW cm−2, respectively. After the photoexposure, the samples were cleaned by subsequent rinses in DI water, acetone, and isopropyl alcohol, followed by a final DI water rinse, and then dried with N2.Characterization
Characterization by surface imaging was carried out by a Zeiss Supra 40 field emission scanning electron microscope (SEM). The SEM micrographs were processed by applying a bandpass filter to increase the contrast between the TiO2 substrate and the nanoparticles in order to render a binary image: subsequently, mathematical analysis was performed in an effort to acquire the size, density and nearest neighbor distances of the particles, as well as to eliminate false particles (such as crystal edges). The details of the image analysis process can be found in the ESI.†X-ray photoelectron spectroscopy (XPS) measurements were made using Kratos Axis Ultra system, equipped with a monochromatic Al Kα X-ray source. The spectra were measured with a 20 eV/40 eV pass energy and a 0.1 eV energy step. The energy scale was calibrated to give 284.8 eV as the binding energy for the C 1s peak corresponding to adventitious carbon.
Results and discussion
The expected reaction between a metal in solution and TiO2 is reductive photodeposition:26 Mn+1(aq) + ne− → M(s), where oxygen vacancies in the semiconductor substrate act as traps for the photogenerated electrons55 allowing the adsorption of positive metal ions to the TiO2 surface and their subsequent reduction49 to a solid phase. This basic reaction can therefore be supported by either encouraging the creation of oxygen vacancies, or favoring the attraction between the substrate and the metallic ions. Both factors are influenced by the choice of the precursor compound and by the following process parameters.The pH of the precursor solution affects the reaction kinetics: a basic or neutral solution favors the formation of metal oxides,42,43 while a pH lower than the isoelectric point (IEP) of TiO2 makes the surface adsorb positively charged ions44 such as H+, attracting the platinum hexachloride ions to bond to the surface. In the present study, the solution was acidic in all cases, due to H2PtCl6 being an acid salt, with a pH ranging from 2 to 4 according to the concentration of chloroplatinic acid and to the presence of sulfuric acid. According to Wenderich et al.,26 the latter is likely to act as a reducing agent but since its concentration is low, it does not have the effect of dissolving the Pt nanoparticles as they grow.56
The concentration of the precursor affects linearly the photodeposition rate for small concentrations before being overcome by the changes in the rate caused by other factors. Namely, the incident photon flux has a linear effect on the photodeposition rate until the precursor is depleted of metallic ions. The photodeposition time, instead, affects the size of the deposited particles45 as the metallic particles become favorable sites for further deposition.46,47
The presence of oxygen vacancies increments with the concentration of sacrificial donors in the solution: the donors scavenge the photogenerated holes from the semiconductor,48 resulting to a longer lifetime for the electrons,49 which are now more likely to participate in the reductive photocatalysis. A high concentration of the sacrificial donor also yields lower valence states for platinum, favoring the deposition of metal rather metal oxide.50,51 However, if high amounts of oxygen are dissolved in the precursor solution, a competing electron scavenging reaction takes place: therefore purging the solution from the oxygen leads to an increased reaction rate and prevents oxidation reactions from taking place on the photocatalyst surface.52 An H2 thermal treatment is also accounted in the parameters in order to create oxygen vacancies on the TiO2 surface,57,58 which increase the electrical n-type conductivity59–61 and the charge carrier lifetime,62 and act as nucleation sites for the nanoparticles.63
Image analysis and statistical outcome
Fig. 2 shows the mean particle size and the particle density for all the eight samples: it is evident that there are no strong variations in the size from sample to sample, while dramatic changes are observed in the density. The variations are more clearly summarized in Fig. 3, which highlights the collective effects of the examined process parameters to both the size and density of the particles. The distribution of the particles appears uniform, which suggests that in this case the crystal orientation of the TiO2 is not playing a major role in the preferred deposition sites, despite it being relevant in other photodeposition studies.64,65 | ||
| Fig. 2 Measured mean particle size and particle density in the eight samples. | ||
 | ||
| Fig. 3 Changes in the group mean values for the studied parameters: for each parameter the first and the second column represents the group mean of samples fabricated with value 1 and value 2 from Table 1, respectively. | ||
The details of the quantitative analysis are presented in Section 2 of the ESI:† the statistical significance of the measured effects was tested using analysis of variance (ANOVA), the numerical results of which are presented in Tables S2–S5.† As a test of null hypothesis, probability values (p-values) smaller than 0.05 indicate that a parameter has a statistically significant effect. Concerning the particle size, H2 treatment, methanol concentration and light intensity were found to be influent factors, with respective p-values of 0.035, 0.012, and 0.047. For particle density, H2 treatment and precursor concentration had a statistically significant effect, bearing p-values of 0.020 and 0.016 respectively.
The average particle diameter was in the 3–6 nm range for all samples, and the median of the particle diameter was slightly smaller than the mean particle diameter: this is compatible with the fact that the size of the particles follows a log-normal distribution, which is typical of particle growth by means of gas evaporation, coagulation and other random processes66 and Fig. S3† demonstrates the distribution of the particle sizes.
The standard deviations for the mean particle diameter were between 1 nm and 3 nm, which are close to 50% of the average diameter: such a high variation is due to the small sizes of the platinum particles, as it increases the error during the image analysis. The particle density displayed a wider range, from 120 to 5000 particlesper μm2, with clear trends, as portrayed in Fig. 3. It is also possible to assess a random distribution of the nanoparticles by verifying that the distribution of the nearest neighbor distances follows a Poisson distribution, as shown in Fig. S4 in the ESI.†
The presence of platinum oxides is not expected in any of the samples, due to the pH of the precursor solution, which is lower than 5. However, samples numbered by 1, 4, 6 and 7 show signs of a peculiar mycelia-like particle formation in parts of the illuminated area (Fig. 1c(6) is an example), which is typical of oxidized platinum.67 X-ray photo-electron spectroscopy (XPS) was conducted as a posterior investigation, confirming the prevalence of platinum oxide and platinum hydroxide on 5 and 6, while revealing mostly metallic platinum and a smaller proportion of platinum oxide on samples 1, 3, 4 and 7. An estimate is displayed in Table 2, showing the relative percentage of areas in which the different platinum phases are present, and further details are available in the ESI.†
| Sample number | Metallic Pt | Pt oxide | Pt hydroxide |
|---|---|---|---|
| 1 | 86% | 4% | 10% |
| 2 | 1% | 63% | 36% |
| 3 | 85% | 15% | 0 |
| 4 | 75% | 4% | 21% |
| 5 | 19% | 29% | 53% |
| 6 | 10% | 12% | 79% |
| 7 | 78% | 6% | 17% |
| 8 | 10% | 23% | 74% |
Influence of the process parameters
H2 thermal pre-treatment, which increased the oxygen vacancies on the TiO2 substrate, decreased both the particle size and the particle density. While the mechanism behind this is still being explored, this is in-line with previous results that show that Pt ions prefer deposition sites other than oxygen vacancies.68 At the same time, the less evident effect on the particle size is coherent with the fact that the average size is expected to be influenced by the conditions of the solution and of the illumination, as anticipated in the introduction.Increasing the intensity of the incident light resulted in a smaller particle size. While this may initially seem surprising, increasing the incident flux would in turn increase the number of small Pt particles formed at nucleation sites, thus creating several different locations at which the growth reaction could proceed, causing the growth to be spread out across the sample, creating smaller particles undetectable by this analysis. Further, nucleated Pt particles act as recombination sites.69,70 Thus, a large number of Pt growth sites would inhibit the reaction. The influence on the intensity on the density, however, does not appear to be statistically relevant.
Higher methanol concentration resulted in larger particles, which is expected. According to literature, the kinetics of photodeposition in the presence of the sacrificial reagent develop as follows:38 at first there is adsorption of [PtCl6]−2 to the semiconductor in darkness, followed by a two-phase consumption of the metal from the solution, first at a slow rate and then at a faster rate until the precursor solution is depleted. Furthermore the UV-illumination has produced methanol radicals, electrons are provided for the reduction reaction, helping it to proceed more readily, and the favored locations for it to take place are the particles that have already been deposited.68 In absence of methanol the photodeposition rate remains in the slow phase and complete depletion does not happen. In addition, the absence of methanol has been demonstrated to encourage the formation of platinum oxides, which corroborates the observation of smaller metallic particles as well as the presence of oxide on samples that have both higher pH and low methanol concentration.
Higher precursor concentrations resulted in smaller particle densities. As mentioned, the photodeposition rate of platinum is not limited by low precursor concentration, except at very low concentrations.43 A concentration of 1 mg mL−1 was sufficient to provide ions for the reaction, so the higher particle density due to lower precursor concentration could be a result of decreased interactions between platinum ions. In general, due to the metal atoms adsorption, the upward shift of conduction band edge will improve the reducing capacity of TiO2 already when a single platinum atom succeeds in depositing on the semiconductor.71 This would lead to an increased adsorption on the TiO2 surface. Alternatively, at high precursor concentrations, particle nucleation may occur faster, which would allow the smaller and less stable particles to dissolve, resulting in larger particles which, in turn, brings an overall decrease in the particle density.
Within the confines of the present experiment, the changes in N2 purge time and methanol concentration did not have a significant effect on the final density. While the statistical analysis did not show that the addition of H2SO4 had a significant effect on the size and density results, the presence of the acid in the solution is nevertheless important, as it favors metallic platinum, as previously mentioned, and further elaborated upon in the Section 3 of the ESI.†
Applicability to gold photodeposition
The procedure was successfully conducted not only with a platinum precursor, but also using gold(III)chloride trihydrate (HAuCl4·3H2O) in order to deposit gold nanoparticles,32,46,72 with the only process difference of shorter deposition times. The results were straightforward, especially thanks to the lack of a competing metal oxide deposition and to the larger particle size, and strikingly similar to their platinum counterpart in terms of the effects of the deposition parameters. Further elaboration on the gold-deposited samples can be found in Section 4 of the ESI.†Conclusions
From the results hereby presented, it is evident that the procedure yields successful results in metal photodeposition, and clearly shows the influence of the process parameters on the final results. Based on the particle analysis, in order to achieve small but densely packed metallic platinum nanoparticles, one should aim for low light intensity, low sacrificial agent content, low precursor concentration, addition of H2SO4, and acidic pH. The acidic pH should be selected in all cases, in order to achieve metallic nanoparticles, as platinum nanoparticles have shown to be more photocatalytically active than platinum oxides.67 The H2 thermal treatment should not be conducted, since it was shown to decrease the particle density more drastically than the particle size. Platinum particle sizes remained relatively small for all of the samples, regardless of the parameters used. This is a welcome result, as the small particle size has been proven to have a profound effect on the photocatalytic activity while large co-catalyst particles can shadow the active sites on the surface of the photocatalyst, and serve as recombination sites, causing electron–hole pairs to recombine rather than contribute to the reaction.69,73 Because of their slow growth during photodeposition, the size of the platinum particles is easy to control by altering the deposition time and the amount of precursor, while the overall changes appear to be more drastic in regard to the density of the nanoparticles, showing that the deposition parameters deeply affect the total load of the co-catalyst on the photocatalyst surface.This study provides a straightforward instrument for selecting, from a list of process conditions, the influential parameters on size and density of photodeposited particles, which allows for the optimization of the co-catalyst loading; furthermore, it can be expanded to comprehend factors that are normally investigated separately from the strict photodeposition (e.g. the crystal form of the substrate and its growth procedure). The success of the procedure can also contribute to wet-synthesis processes of novel structures,74 as well as in situ photodeposition during a photoelectrochemical process such as water-splitting, hydrocarbon reduction to CO2, all methods that benefit from the use of methanol as a sacrificial reagent.75
Conflicts of interest
There are no conflicts to declare.Acknowledgements
The authors acknowledge the financial support from the Academy of Finland projects 285972 and 319018, from the Vilho, Yrjö ja Kalle Väisälä Foundation grant issued by the Finnish Academy of Arts and Sciences and from the Aalto University ELEC Doctoral School. Further thanks go to Christoffer Kauppinen for the use of the PEO furnace. The present work was conducted in the Micronova Nanofabrication Center and in the Nanomicroscopy Center at Aalto University.References
- A. Fujishima, Nature, 1972, 238, 37–38 CrossRef CAS PubMed.
- A. Fujishima and X. Zhang, C. R. Chim., 2006, 9, 750–760 CrossRef CAS.
- M. D. Hernández-Alonso, F. Fresno, S. Suárez and J. M. Coronado, Energy Environ. Sci., 2009, 2, 1231–1257 RSC.
- Handbook of Mineralogy, http://www.handbookofmineralogy.org/, accessed 25 July 2018.
- N. I. for Occupational Safety and Health, Current Intelligence Bulletin 63: Occupational Exposure to Titanium Dioxide, 2011.
- T. Ohno, K. Sarukawa and M. Matsumura, New J. Chem., 2002, 26, 1167–1170 RSC.
- G. L. Chiarello, A. Di Paola, L. Palmisano and E. Selli, Photochem. Photobiol. Sci., 2011, 10, 355–360 RSC.
- Z. Li, W. Luo, M. Zhang, J. Feng and Z. Zou, Energy Environ. Sci., 2013, 6, 347–370 RSC.
- J. Nowotny, Energy Environ. Sci., 2008, 1, 565–572 RSC.
- A. Fujishima, X. Zhang and D. A. Tryk, Surf. Sci. Rep., 2008, 63, 515–582 CrossRef CAS.
- M. D. Hernández-Alonso, R. Portela and J. M. Coronado, in Design of Advanced Photocatalytic Materials for Energy and Environmental Applications, Springer, 2013, pp. 67–84 Search PubMed.
- V. Luca, S. Djajanti and R. F. Howe, J. Phys. Chem. B, 1998, 102, 10650–10657 CrossRef CAS.
- A. Di Paola, E. García-López, G. Marcì and L. Palmisano, J. Hazard. Mater., 2012, 211, 3–29 CrossRef PubMed.
- A. Kudo and Y. Miseki, Chem. Soc. Rev., 2009, 38, 253–278 RSC.
- C. Li, S. Zhang, B. Zhang, D. Su, S. He, Y. Zhao, J. Liu, F. Wang, M. Wei and D. G. Evans, et al. , J. Mater. Chem. A, 2013, 1, 2461–2467 RSC.
- A. Mills, P. A. Duckmanton and J. Reglinski, Chem. Commun., 2010, 46, 2397–2398 RSC.
- J. Ran, J. Zhang, J. Yu, M. Jaroniec and S. Z. Qiao, Chem. Soc. Rev., 2014, 43, 7787–7812 RSC.
- J. Yang, D. Wang, H. Han and C. Li, Acc. Chem. Res., 2013, 46, 1900–1909 CrossRef CAS PubMed.
- P. Zhang, T. Wang and J. Gong, Adv. Mater., 2015, 27, 5328–5342 CrossRef CAS PubMed.
- J.-G. Kang and Y. Sohn, J. Mater. Sci., 2012, 47, 824–832 CrossRef CAS.
- A. Murata, N. Oka, S. Nakamura and Y. Shigesato, J. Nanosci. Nanotechnol., 2012, 12, 5082–5086 CrossRef CAS PubMed.
- K. Maeda, R. Abe and K. Domen, J. Phys. Chem. C, 2011, 115, 3057–3064 CrossRef CAS.
- G. R. Bamwenda, S. Tsubota, T. Nakamura and M. Haruta, J. Photochem. Photobiol., A, 1995, 89, 177–189 CrossRef CAS.
- W. Clark and A. Vondjidis, J. Catal., 1965, 4, 691–696 CrossRef CAS.
- B. Kraeutler and A. Bard, J. Am. Chem. Soc., 1978, 100, 4317–4318 CrossRef CAS.
- K. Wenderich and G. Mul, Chem. Rev., 2016, 116, 14587–14619 CrossRef CAS PubMed.
- S. Jin and F. Shiraishi, Chem. Eng. J., 2004, 97, 203–211 CrossRef CAS.
- V. Kitsiou, G. A. Zachariadis, D. A. Lambropoulou, D. Tsiplakides and I. Poulios, J. Environ. Chem. Eng., 2018, 6, 2409–2416 CrossRef CAS.
- C. Dong, C. Lian, S. Hu, Z. Deng, J. Gong, M. Li, H. Liu, M. Xing and J. Zhang, Nat. Commun., 2018, 9, 1252 CrossRef PubMed.
- L. Hou, M. Zhang, Z. Guan, Q. Li and J. Yang, J. Nanopart. Res., 2018, 20, 60 CrossRef.
- J. Li and D. Xu, Chem. Commun., 2010, 46, 2301–2303 RSC.
- C. Yogi, K. Kojima, T. Takai and N. Wada, J. Mater. Sci., 2009, 44, 821 CrossRef CAS.
- J.-M. Herrmann, J. Disdier and P. Pichat, J. Phys. Chem., 1986, 90, 6028–6034 CrossRef CAS.
- J. Taing, M. H. Cheng and J. C. Hemminger, ACS Nano, 2011, 5, 6325–6333 CrossRef CAS PubMed.
- S. Juodkazis, A. Yamaguchi, H. Ishii, S. Matsuo, H. Takagi and H. Misawa, Jpn. J. Appl. Phys., Part 1, 2001, 40, 4246 CrossRef CAS.
- H. Ishii, S. Juodkazis, S. Matsuo and H. Misawa, Chem. Lett., 1998, 27, 655–656 CrossRef.
- C. Jaramillo-Páez, J. Navío, M. Hidalgo and M. Macías, Catal. Today, 2018, 313, 12–19 CrossRef.
- K. Wenderich, K. Han and G. Mul, Part. Part. Syst. Charact., 2017, 35, 1700250 CrossRef.
- J. Dong, L. Duan, Q. Wu and W. Yao, Int. J. Hydrogen Energy, 2018, 43, 2139–2147 CrossRef CAS.
- Y. Guo, I. Siretanu, Y. Zhang, B. Mei, X. Li, F. Mugele, H. Huang and G. Mul, J. Mater. Chem. A, 2018, 6, 7500–7508 RSC.
- P. J. Ross, Taguchi techniques for quality engineering: loss function, orthogonal experiments, parameter and tolerance design, McGraw Hill Professional, 1996 Search PubMed.
- C. Xi, Z. Chen, Q. Li and Z. Jin, J. Photochem. Photobiol., A, 1995, 87, 249–255 CrossRef CAS.
- F. Zhang, J. Chen, X. Zhang, W. Gao, R. Jin and N. Guan, Catal. Today, 2004, 93, 645–650 CrossRef.
- R. Beranek, Adv. Phys. Chem., 2012, 786759 Search PubMed.
- J. Murcia, J. Navío and M. Hidalgo, Appl. Catal., B, 2012, 126, 76–85 CrossRef CAS.
- M. Hidalgo, J. Murcia, J. Navío and G. Colón, Appl. Catal., A, 2011, 397, 112–120 CrossRef CAS.
- L.-H. Chang, Y.-L. Yeh and Y.-W. Chen, Int. J. Hydrogen Energy, 2008, 33, 1965–1974 CrossRef CAS.
- J. Schneider, M. Matsuoka, M. Takeuchi, J. Zhang, Y. Horiuchi, M. Anpo and D. W. Bahnemann, Chem. Rev., 2014, 114, 9919–9986 CrossRef CAS PubMed.
- J. F. Fernando, M. P. Shortell, C. J. Noble, J. R. Harmer, E. A. Jaatinen and E. R. Waclawik, ACS Appl. Mater. Interfaces, 2016, 8, 14271–14283 CrossRef CAS PubMed.
- C. Sungbom, M. Kawai and K. Tanaka, Bull. Chem. Soc. Jpn., 1984, 57, 871–872 CrossRef CAS.
- J. Lee and W. Choi, J. Phys. Chem. B, 2005, 109, 7399–7406 CrossRef CAS PubMed.
- X. Pan, M.-Q. Yang, X. Fu, N. Zhang and Y.-J. Xu, Nanoscale, 2013, 5, 3601–3614 RSC.
- J. Rosa, A. Robin, M. Silva, C. Baldan and M. Peres, J. Mater. Process. Technol., 2009, 209, 1181–1188 CrossRef CAS.
- Z. Jiang, Z. Zhang, W. Shangguan, M. A. Isaacs, L. J. Durndell, C. M. A. Parlett and A. F. Lee, Catal. Sci. Technol., 2016, 6, 81–88 RSC.
- M. Salari, K. Konstantinov and H. K. Liu, J. Mater. Chem., 2011, 21, 5128–5133 RSC.
- Y. Sugawara, T. Okayasu, A. P. Yadav, A. Nishikata and T. Tsuru, J. Electrochem. Soc., 2012, 159, F779–F786 CrossRef CAS.
- H. Liu, H. Ma, X. Li, W. Li, M. Wu and X. Bao, Chemosphere, 2003, 50, 39–46 CrossRef CAS PubMed.
- M. Mehta, N. Kodan, S. Kumar, A. Kaushal, L. Mayrhofer, M. Walter, M. Moseler, A. Dey, S. Krishnamurthy, S. Basu and A. P. Singh, J. Mater. Chem. A, 2016, 4, 2670–2681 RSC.
- A. Janotti, J. Varley, P. Rinke, N. Umezawa, G. Kresse and C. Van de Walle, Phys. Rev. B: Condens. Matter Mater. Phys., 2010, 81, 085212 CrossRef.
- E. Yagi, R. R. Hasiguti and M. Aono, Phys. Rev. B: Condens. Matter Mater. Phys., 1996, 54, 7945 CrossRef CAS.
- M. K. Nowotny, L. R. Sheppard, T. Bak and J. Nowotny, J. Phys. Chem. C, 2008, 112, 5275–5300 CrossRef CAS.
- J. Zhuang, W. Dai, Q. Tian, Z. Li, L. Xie, J. Wang, P. Liu, X. Shi and D. Wang, Langmuir, 2010, 26, 9686–9694 CrossRef CAS PubMed.
- E. Wahlström, N. Lopez, R. Schaub, P. Thostrup, A. Rønnau, C. Africh, E. Lægsgaard, J. K. Nørskov and F. Besenbacher, Phys. Rev. Lett., 2003, 90, 026101 CrossRef PubMed.
- M. Chamtouri, B. Kenens, R. Aubert, G. Lu, T. Inose, Y. Fujita, A. Masuhara, J. Hofkens and H. Uji-i, ACS Omega, 2017, 2, 4032–4038 CrossRef CAS PubMed.
- M.-V. Sofianou, N. Boukos, T. Vaimakis and C. Trapalis, Appl. Catal., B, 2014, 158–159, 91–95 CrossRef CAS.
- L. Kiss, J. Söderlund, G. Niklasson and C. Granqvist, Nanotechnology, 1999, 10, 25 CrossRef.
- A. V. Vorontsov, E. N. Savinov and J. Zhensheng, J. Photochem. Photobiol., A, 1999, 125, 113–117 CrossRef CAS.
- H. Nakamatsu, T. Kawai, A. Koreeda and S. Kawai, J. Chem. Soc., Faraday Trans. 1, 1986, 82, 527–531 RSC.
- M. Maicu, M. Hidalgo, G. Colón and J. A. Navío, J. Photochem. Photobiol., A, 2011, 217, 275–283 CrossRef CAS.
- B. Sun, A. V. Vorontsov and P. G. Smirniotis, Langmuir, 2003, 19, 3151–3156 CrossRef CAS.
- C. Jin, Y. Dai, W. Wei, X. Ma, M. Li and B. Huang, Appl. Surf. Sci., 2017, 426, 639–646 CrossRef CAS.
- A. Fernandez, A. Caballero, A. Gonzalez-Elipe, J. Herrmann, H. Dexpert and F. Villain, et al. , J. Phys. Chem., 1995, 99, 3303–3309 CrossRef CAS.
- R. Reichert, Z. Jusys and R. J. Behm, J. Phys. Chem. C, 2015, 119, 24750–24759 CrossRef CAS.
- E. P. Melián, C. R. López, A. O. Méndez, O. G. Díaz, M. N. Suárez, J. D. Na Rodríguez, J. Navío and D. F. Hevia, Int. J. Hydrogen Energy, 2013, 38, 11737–11748 CrossRef.
- C. R. López, E. P. Melián, J. O. Méndez, D. E. Santiago, J. D. Na Rodríguez and O. G. Díaz, J. Photochem. Photobiol., A, 2015, 312, 45–54 CrossRef.
Footnote |
| † Electronic supplementary information (ESI) available. See DOI: 10.1039/c8ta09037h |
| This journal is © The Royal Society of Chemistry 2019 |