 Open Access Article
Local structure and vibrational dynamics in indium-doped barium zirconate†
Laura
Mazzei
 a,
Adrien
Perrichon
b,
Alessandro
Mancini
c,
Göran
Wahnström
a,
Lorenzo
Malavasi
c,
Stewart F.
Parker
a,
Adrien
Perrichon
b,
Alessandro
Mancini
c,
Göran
Wahnström
a,
Lorenzo
Malavasi
c,
Stewart F.
Parker
 d,
Lars
Börjesson
a and
Maths
Karlsson
 *b
*b
aDepartment of Physics, Chalmers University of Technology, SE-412 96 Göteborg, Sweden
bDepartment of Chemistry and Chemical Engineering, Chalmers University of Technology, SE-412 96 Göteborg, Sweden. E-mail: maths.karlsson@chalmers.se; Tel: +46 733873207
cDepartment of Chemistry, University of Pavia, INSTM, 27100 Pavia, Italy
dISIS Facility, STFC Rutherford Appleton Laboratory, Oxfordshire OX11 0QX, UK
First published on 26th November 2018
Abstract
Barium zirconate (BaZrO3), when substituted with trivalent acceptor ions to replace Zr4+, is a proton conducting material of interest for several electrochemical applications. The local coordination environments, and vibrational dynamics, of the protons are known to critically influence the material's proton conducting properties, however, the nature of the static and dynamic structure around the protons and, especially, how it is affected by the dopant atoms for high doping concentrations, remains to be elucidated. Here we report results from X-ray powder diffraction, infrared (IR) spectroscopy, inelastic neutron scattering (INS) and ab initio molecular dynamics (AIMD) simulations on a hydrated sample of BaZrO3 substituted with 50% In3+. The investigation of the momentum-transfer (Q) dependence of the INS spectrum is used to aid the analysis of the spectra and the assignment of the spectral components to fundamental O–H bend and O–H stretch modes and higher-order transitions. The AIMD simulations show that the INS spectrum is constituted of the overlapping spectra of protons in several different local structural environments, whereas the local proton environments for specific protons are found to vary with time as a result of thermally activated vibrations of the perovskite lattice. It is argued that, converse to more weakly doped systems, such as 20% Y-doped BaZrO3, the dopant–proton association effect does not hinder the diffusion of protons due to the presence of percolation paths of dopant atoms throughout the perovskite lattice.
1 Introduction
Proton conducting perovskites are of considerable interest for application as electrolytes in various electrochemical devices, such as hydrogen sensors, electrochromic displays and solid oxide fuel cells (SOFCs),1–5 and over the last decades, a large number of compounds have been synthesized.4–6 Among the candidate electrolytes for SOFCs, acceptor-doped barium zirconates, of the general formula BaZr1−xMxO3−x/2 (M = trivalent cation, 0 < x < 1), as well as their fully substituted compounds, e.g. Ba2In2O5, have garnered particular attention because of their high proton conductivity, particularly in the intermediate-temperature range (500–900 K) targeted for cost-effective SOFC operation, and their excellent chemical stability.Generally, the protons in oxides are not native members of the oxygen lattice, rather they are often referred to as protonic or –OH defects, which can be incorporated into the material by heat treatment in a humid atmosphere. At sufficiently high temperatures, typically above 300 K, the protons can diffuse throughout the lattice through a two-stage mechanism that involves the transferring (hopping) of a proton from one oxygen to another, neighboring, one and a reorientational motion of the –OH group between such a transfer.6–13 However, fundamental questions encompassing the defect chemistry of these materials remain, especially in regard to the local coordination environment and dynamics of protons and in general the role of dopant atoms for the proton transport properties.
In the low doping regime, say x ≤ 0.2, for which BaZr1−xMxO3−x/2 accommodates a complete solubility for several dopant atoms, studies by quasielastic neutron scattering (QENS),9,14,15 nuclear magnetic resonance combined with conductivity measurements,16 muon spectroscopy,17 luminescence spectroscopy,18 and computer simulations19–23 on various proton conducting oxide materials suggest an attractive interaction between the protons and dopant atoms, such that the dopant atoms act as more or less well-localized trapping centers that impede long-range proton transport. For higher dopant levels, x > 0.2, the solubility limit depends on the type of dopant atom and on the synthesis route. For Y3+-doped BaZrO3, for example, the reported solubility limit varies between less than 20% and up to, at least, 50%, depending on the synthesis method used,24–26 whereas In3+ has been found to be soluble in virtually any amount in BaZrO3.24,27–31
A straightforward way to investigate the local coordination and vibrational dynamics of protons in proton conducting oxides is provided by infrared (IR) vibrational spectroscopy. The strong IR response of the O–H stretch vibration, ν(O–H), not only manifests the presence of protons bounded to the oxygen atoms of the host lattice, but the frequency (energy) of the vibrational mode is closely linked to the protons' local coordination environment. For a free O–H molecular ion, for example, the ν(O–H) band is located at about 450 meV, but for a hydrated oxide, the ν(O–H) band is usually broadened towards lower energies and, sometimes, also very structured. The extension of the ν(O–H) band towards lower frequencies is a clear indicator of the presence of hydrogen bonds between the protons and neighboring oxygen atoms, whereas the generally broad nature of the ν(O–H) band results from a distribution in the strength of such hydrogen bonds in the material. By comparing experimentally determined IR spectra over the ν(O–H) band region with computer simulations of the vibrational frequencies for protons located in various local structural arrangements of the oxide structure, different parts of a broad ν(O–H) band can be assigned and, hence, insight into the nature of proton sites and vibrational dynamics gained.
We showed in a series of preceding IR spectroscopy experiments on BaZr1−xInxO3−x/2 with x = 0.10, 0.25, 0.50 and 0.75, that in the region commonly associated to O–H stretch vibrations the spectra are generally characterized by three relatively distinct bands at 250, 290, and 520 meV, respectively, and a broad band between ca. 310 and 450 meV.29,32 The IR spectra were compared with the ν(O–H) vibrational frequency as determined by ab initio calculations on a system corresponding to 12.5% In-doped BaZrO3, with the proton located in various structural arrangements distinguished by non-symmetrical configurations, such as Zr–OH–In and Zr–OH–In–VO (where VO denotes an oxygen vacancy), and symmetrical configurations, such as Zr–OH–Zr and In–OH–In. The comparison of experimental and theoretical data suggests that protons in non-symmetrical sites find their spectral response to the low-frequency side of the broad band, whereas the spectral response of protons in symmetrical sites are found on its high-frequency side.29 The effect of a non-symmetrical environment around the proton is found to be a tilting of the proton toward a neighboring oxygen atom. In effect, the tendency for hydrogen-bond formation between the proton and nearest neighbor oxygen is enhanced, which decreases the ν(O–H) frequency. The calculations did not, however, reproduce the three bands as located at 250, 290, and 520 meV, respectively, which showed a trend of an increasing intensity with increasing In dopant concentration. This is an interesting fact pointing towards the presence of In-dopant-induced proton sites not captured in our previous ab initio calculations. Alternative explanations for the presence of the 250, 290, and 520 meV bands could be that they relate to higher-order transitions (overtones, or combinations), or, so-called, Evans' holes.33 The latter refers to an intensity loss in certain energy ranges of a broad IR absorption band, here the ν(O–H) band, caused by Fermi resonances, i.e. anharmonic coupling of the ν(O–H) band with an overtone or a combination of some, lower-frequency, lattice modes of the material. Whatever the case, a correct assignment of the ν(O–H) band region is crucial for developing a thorough understanding of the local coordination environment and vibrational dynamics of protons, which in turn is critical for establishing the atomic-scale origins of the proton conducting properties of these materials.
Here we report on a detailed study of the vibrational spectra of a fully hydrated sample of the composition BaZr0.5In0.5O3H0.5. The aim of the study is to provide a detailed assignment of the vibrational spectra and to obtain insight into the local coordination environment of protons and to correlate these spectroscopic results to the material's proton transport properties. The techniques used are powder X-ray diffraction (PXRD), IR spectroscopy, inelastic neutron scattering (INS), and ab initio molecular dynamics (AIMD) simulations based on density functional theory (DFT).
Analyses of the intensity and momentum transfer (Q) dependence of the INS signal provide unique information to characterize the proton sites, such as the hydrogen bond strength experienced by the protons and the relative occupation of the proton sites, as well as to assign the different contributions in the vibrational spectra to fundamental δ(O–H), i.e. O–H bend, and ν(O–H) modes and higher order transitions. This approach has been used for Rb2PtH6 (ref. 34) and KH2AsO4,35 but, to the best of our knowledge, never before for hydrated oxides. The choice of the AIMD method in the present study is motivated by its ability to inherently explore a large number of local structures in an automated way, through a restricted number of simulations. Analyses of the atomic trajectories from the AIMD simulations provide an estimate of the vibrational density of states (VDOS), that can be related to the proton vibrational dynamics, and thus to the experimental INS spectrum.
2 Experimental details
2.1 Sample preparation
A polycrystalline sample, weighing approximately 20 g, of the chemical composition BaZr0.5In0.5O2.75 was prepared by solid state sintering by mixing stoichiometric amounts of BaCO3, ZrO2, and In2O3, with the sintering process divided into two heat treatments: 1200 °C for 8 h, followed by 1325 °C for 48 h, with intermediate grinding and compacting of pellets between each heat treatment. The as-sintered powder sample was subsequently hydrated by letting it cool down over 36 h from 400 °C to 200 °C in a tube furnace with a flow of N2 saturated with water vapor. This hydrated sample is hereafter labeled as 50In/BZO.2.2 Thermogravimetric analysis
Thermogravimetric analysis (TGA) was performed on the nominally hydrated sample, using a F1 Iris spectrometer from Netzsch. About 150 mg of nominally hydrated 50In/BZO was placed in an alumina crucible and heated in a flow of N2 (25 mL min−1) from 25 °C to 950 °C at a rate of 5 °C min−1.2.3 Powder X-ray diffraction
Powder X-ray diffraction (PXRD) data were collected on the hydrated sample, as well as on a vacuum-dried (dehydrated) sample, using a Bruker D8 Advance diffractometer operating with CuKα1 radiation in the 2θ-range of 15–100°. The PXRD data was analyzed using the software CELLREF36 to refine the cell parameters. Dehydrated 50In/BZO was prepared by heating a portion of 50In/BZO to high temperatures (900 °C) in vacuum.2.4 Infrared spectroscopy
IR spectroscopy measurements were performed in diffuse reflectance mode on 50In/BZO over the frequency range 150–560 meV (≈1200–4500 cm−1), using a Bruker Alpha DRIFT spectrometer. About 200 mg of sample was used for the measurements. A measurement of a rough Au mirror was used as a reference spectrum. An absorbance-like spectrum was derived by taking the logarithm of the ratio between the reference and sample spectra. All measurements were performed at room temperature. The spectrometer was located inside an Ar-atmosphere glove box.2.5 Inelastic neutron scattering
For the INS measurements, approximately 19 g of 50In/BZO powder was loaded into an aluminum sachet, and the sachet into an indium wire sealed thin-walled aluminum can. The experiment was performed on the direct-geometry, time-of-flight, chopper spectrometer MERLIN37 below T = 10 K. Spectra were measured using four different incident energies; Ei = 200 meV (5 meV, 400 Hz), 400 meV (12 meV, 550 Hz), 600 meV (16 meV, 600 Hz), and 1000 meV (30 meV, 600 Hz), where the numbers within parentheses refer to the best resolution in energy and chopper frequency, respectively. The same sample was also measured on TOSCA38 at T = 10 K. For the present work, the key differences between the two spectrometers are that MERLIN allows access to the δ(O–H) region and beyond, enables both momentum (Q, Å−1) and energy (ω, meV) transfer to be measured independently, while TOSCA provides better energy resolution. The MERLIN time-of-flight spectra were first converted into INS maps I(Q,ω), i.e. scattering intensity as a function of both Q and ω,39 and the maps were subsequently analyzed using the software MSLICE.40 The thickness of the sample (3 mm), was chosen to achieve a total scattering of approximately 10%, for which multiple scattering is negligible.413 Theoretical considerations
The intensity I(Q,ω) of the signal measured in an INS experiment is directly linked to the dynamical structure factor, S(Q,ω). Since the present work focuses on the O–H vibrational dynamics and the INS spectrum is dominated by the incoherent contribution of hydrogen (H), the following description is limited to the specific case of the internal motion of H in a O–H moiety.The movement of a specific hydrogen atom l involved in a vibrational mode ν, of energy ωv, is described by the displacement vector ul,v, along the direction of the vibration. The INS intensity associated to this vibrational mode is closely related to the incoherent dynamical structure factor and it can be expressed as42
 | (1) |
The INS intensity for a powder sample is comparable with the average of the dynamical structure factor taken with respect to all the possible directions in space, leading to an intensity I(Q,ων)l(powder)(n) depending only on the scalar quantity Q. This can be written as
 | (2) |
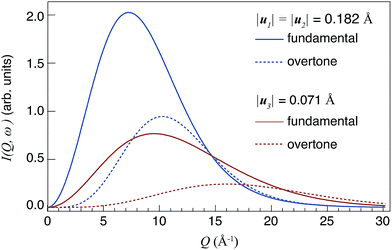 | ||
| Fig. 1 Theoretical Q profiles of I(Q,ωv) for fundamental modes (n = 1) and overtones (n = 2), respectively. The values of |u1|, |u2| and |u3| relate to the calculated root mean-square displacement of the δ(O–H) and ν(O–H) modes in 50In/BZO.29 | ||
| Fundamental (n = 1) | Overtones (n = 2) | |||
|---|---|---|---|---|
| v = 1 | v = 3 | v = 1 | v = 3 | |
| I max [arb. units] | 2.05 | 0.75 | 0.97 | 0.25 |
| Q max [Å−1] | 7.3 | 9.5 | 10.2 | 15 |
Considering the Q profiles calculated for the same n, one can observe that Imax[ν=1,n] > Imax[ν=3,n], i.e. Imax is larger for larger mean square displacements |u|. This effect reflects the fact that I(Q)(n) ∝ u2n, as it can be deduced from eqn (2). One should also observe that the intensity Imax decreases when n increases. Regarding the values of Qmax, it increases when |u| decreases, and it occurs at a higher Q value for higher-order transitions (n ≥ 2) compared to the corresponding fundamental modes (n = 1).
Because of the dependences of Qmax(n) on n and u, the study of Q profiles provides a means to distinguish between fundamental and higher-order transitions in the spectra.
4 Computational details
4.1 Ab initio molecular dynamics simulations
AIMD simulations were performed within the DFT framework, using a plane-wave pseudo-potential approach as implemented in VASP 5.3.43–46 The ionic core–valence interaction is described using the projected augmented wave method (PAW).47,48 For the exchange–correlation part we used the semi-local functional by Perdrew–Burke–Ernzerhof (PBE).49 Since the material is an electronic insulator and the AIMD simulations are performed at the Γ point, the Gaussian smearing method was chosen to describe partial occupancy of orbitals, with a small smearing width of σ = 0.05 eV. The atomic trajectories were obtained using the velocity Verlet algorithm, using a standard time step of dt = 0.50 fs. The temperature, set at T = 100 K during the simulations, was regulated using a canonical ensemble by coupling the system to a Nosé–Hoover thermostat.50–52 Structural models, which are described below, were first geometry optimized at T = 0 K and then thermalized by AIMD over 5 ps at T = 100 K. The generation part of the simulation was divided into four independent 5 ps long AIMD runs. This strategy was used in order to limit issues related to the weak coupling between the H sub-system and the Nosé–Hoover thermostat.4.2 Structural models
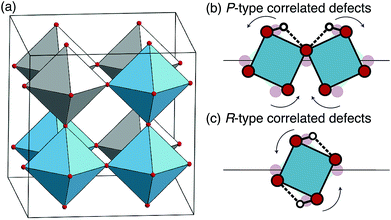
Structural models for the AIMD simulations were built considering a 2 × 2 × 2 supercell with respect to the ABO3 cubic perovskite cell, containing a total of 44 atoms: 8 A elements (8 Ba), 8 B elements (4 Zr and 4 In), 24 O and 4 H. With the AIMD simulations being performed within the GGA–PBE approximation, the theoretical cell parameter is found to be approximately 2% larger than the experimental value. Such a mismatch generates an average compressive residual pressure of about 20 kbar in the AIMD simulations. We performed tests on a few configurations using cell parameters adjusted to give, on average, a residual pressure of 0 kbar at the set temperature. We found that the computed VDOS, as determined from the MD trajectories and with the experimental and “zero-pressure” cell parameters, respectively, are in good qualitative agreement (cf. Fig. S1†). This suggests that, at T = 100 K, external pressure has little effect on the proton vibrational dynamics in 50In/BZO. Consequently, in order to have the same cell volume for each structural model, the cell parameter was set to the experimental value of a = 4.241 Å, refined from the PXRD data.For the distribution of the 4 Zr and 4 In atoms on the 8 available B sites, we note that there are only 6 possible inequivalent arrangements. The six configurations are shown in Table S1† in which we also report the number of Zr–O–Zr, In–O–In and Zr–O–In bonds and the presence/absence of a stacking plane containing only one type of cations (In or Zr). Since there is no experimental evidence of any kind of superstructure in 50In/BZO, we assumed a random distribution of Zr and In atoms over the B sites, i.e. without layering effects (stacking planes), and with a number of Zr–O–In bonds that is half of the total number of bonds. Only the arrangement shown in Fig. 2(a) (labeled as “III” in Table S1†) fulfils these conditions and was used for further investigations. Geometry optimization confirmed that the external pressure is isotropic for this configuration, with no cross-terms, i.e. the Bravais lattice is cubic.
As a development from our preceding AIMD simulations study on In-doped BaZrO3,29 in which we considered a dopant concentration of x = 3/8 yet a single proton (the electro-neutrality being ensured via a distant oxygen vacancy), we here consider a fully hydrated model with x = 4/8, i.e. a model containing 4 protons. The resulting structural models, which are more complex with respect to the one-proton scenario, are considered here in an effort to evaluate the impact of vicinal protons on the local proton environments and associated vibrational dynamics.
The localization of the protons over the perovskite lattice is a non-trivial problem when considering structural models with more than one proton and one dopant atom. In the present case, 4 protons are bonded to 4 of the 24 oxygen atoms and each of them located on one of the 4 sites surrounding an oxygen atom, which results in manifold configurations. In order to select inequivalent and chemically meaningful structural models, we first consider that the proton in an oxide lattice is known to strongly interact with its surrounding, both electrostatically and structurally. For convenience, we define the concept of a “shell”, centered on the proton, as a volume in which the proton strongly distorts the perovskite lattice. As an approximation, justified by the structural models obtained by geometry optimization, we arbitrarily limit the extension of these shells to the second closest neighbors of the protons. We then design two types of structural models: the first for which shells do not overlap (uncorrelated defects models), and the second for which shells overlap (correlated defects models). We further differentiate the correlated defects models into structures where two protons are “pairing” (P-type), i.e. where the two hydrogen bonds are accepted by the same oxygen atom, and structures where two shells induce a strong rotation (R-type) of a single BO6 octahedron (B = In, Zr). A scheme of these two scenarios is shown in Fig. 2(b) and (c), together with an illustration of a possible geometrical reorganization of the BO6 octahedra as an effect of the cooperation of defects.
4.3 Vibrational density of states
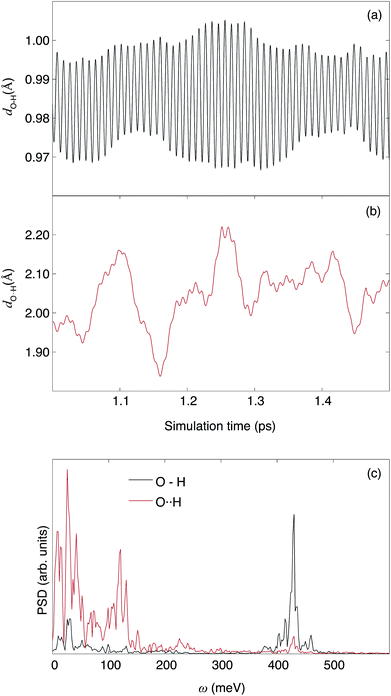
We emphasize that, while the structure at each step of the AIMD trajectory is obtained by quantum mechanical computation of the electronic density, the trajectory itself is obtained by propagating Newton's equation of motion on classical particles. The proton being treated as a classical particle even at T = 100 K, it has a finite velocity, thus it oscillates in its site around its stable position. While this motion is unphysical at such a low temperature, we take here advantage of it as a probe of the potential energy surface of the proton.The characteristic frequencies of the atomic motions, obtained by power spectral density (PSD) analysis of the atomic velocities, provide an estimate of the neutron weighted vibrational density of states (VDOS), I(ω), given by
 | (3) |
In the evaluation of eqn (3) the frequency leakage issue, originating from the discrete Fourier transformation, is here treated by weighting atomic velocities by the first eigenvector of the discrete prolate spheroidal sequences (dpss, or Slepian function).53 Optimal use of trajectories (vs. resolution) was achieved by using trajectory segments of 2048 fs together with the overlapping data segment method.53
5 Results
5.1 Average structural and thermogravimetric analysis
Fig. 3(a) shows the TG curve of the nominally hydrated sample upon heating from 25 °C to 950 °C, recalculated to the number of moles of hydrogen per formula unit perovskite. As can be seen, the water molar concentration agrees with the maximum value expected based on the hydration of oxygen vacancies created via acceptor doping, meaning that the sample is, within error, fully hydrated with no signs of additional hydrogen, such as physisorbed water molecules or other hydrogenated chemical species. | ||
| Fig. 3 (a) TG curve for the nominally hydrated 50In/BZO sample measured upon heating. (b) PXRD patterns for dehydrated (red) and hydrated (blue) samples at room temperature, together with Rietveld fits with the following error indices:54RwP = 2.34 (dehydrated), 2.75 (hydrated); χ2 = 1.56 (dehydrated), 1.47 (hydrated). Inset shows a close up of the (013) reflection. Notice the presence of two phases for the hydrated sample. | ||
Fig. 3(b) shows the diffractogram of both dehydrated and hydrated samples, together with Rietveld fits to the data. The diffractogram of the dehydrated sample confirms that the material is monophasic with an average-cubic structure with space group Pm![[3 with combining macron]](https://www.rsc.org/images/entities/char_0033_0304.gif) m. The PXRD pattern for the hydrated sample can be modeled by two phases in the material, one dehydrated phase and one hydrated phase, see inset in Fig. 3(b). The lattice parameters for the two phases were found to be 4.195(1) Å (dehydrated) and 4.241(1) Å (hydrated), in agreement with previous work.31,55–57
m. The PXRD pattern for the hydrated sample can be modeled by two phases in the material, one dehydrated phase and one hydrated phase, see inset in Fig. 3(b). The lattice parameters for the two phases were found to be 4.195(1) Å (dehydrated) and 4.241(1) Å (hydrated), in agreement with previous work.31,55–57
5.2 Infrared spectroscopy
Fig. 4 shows the room temperature IR spectrum of 50In/BZO over the energy range 180–600 meV (1452–4839 cm−1). The spectrum is featured by a broad, asymmetric, band between ca. 330 and 450 meV, two relatively distinct, more symmetric bands at around 250 and 300 meV, respectively, and a small band at around 530 meV, in full accordance with previous work.29,32,55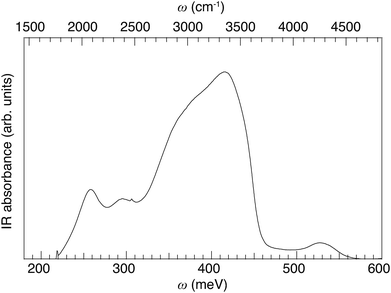 | ||
| Fig. 4 IR absorbance spectrum of 50In/BZO over the extended ν(O–H) band region, measured at room temperature. | ||
5.3 Inelastic neutron scattering
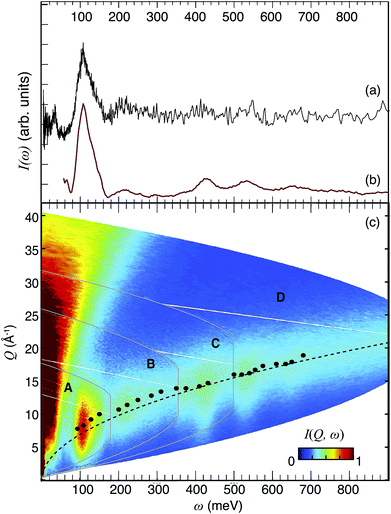 | ||
| Fig. 5 INS spectrum at T ≤ 10 K of 50In/BZO recorded with TOSCA (a) and MERLIN (b). (c) I(Q,ω) maps of 50In/BZO, as measured on MERLIN with four different energies of the incident neutrons, 200 meV (A), 400 meV (B), 600 meV (C), and 1000 meV (D). The intensity is shown according to the color-code bar. The black bullets represent the Qmax values for the different bands, as reported in Table 2. The dotted black line is the calculated hydrogen recoil line. The INS spectrum in (b) has been obtained by the integration of each map over the entire Q range. | ||
Fig. 5(c) shows I(Q,ω) maps of 50In/BZO, as obtained from the MERLIN experiment, with four different energies of the incident neutrons, 200 meV (A), 400 meV (B), 600 meV (C), and 1000 meV (D). Notice how the maximum of the INS signal occurs at larger Q values as the transition energy increases, as expected following our theoretical analysis of the INS intensity as described in Section 3.
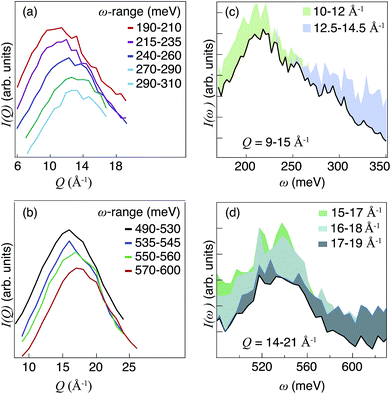 | ||
| Fig. 6 (a, b) I(Q) in different ω-ranges. The data sets are vertically separated for easier comparison. (c, d) I(ω) obtained by integration of I(Q,ω) over different Q intervals (see legend). | ||
The combined analyses of I(Q) and I(ω) suggest that the analyzed spectral range, 100–700 meV, can be divided into 22 distinct energy regions, each characterized by a different Q dependence. Fig. 7 shows I(ω) together with 22 Gaussian shaped components that were fit to the spectra.
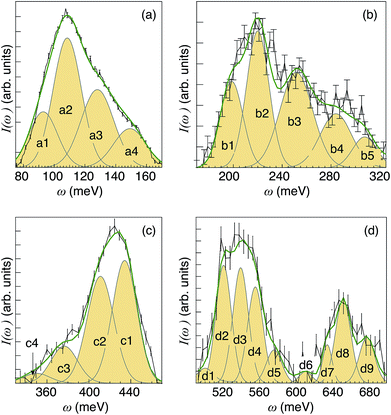 | ||
| Fig. 7 I(ω) spectra as obtained after integration over selected Q ranges of the INS maps shown in Fig. 5(c), together with peak-fitted Gaussian functions and the total fit (green line). (a) Corresponds to the integration over the Q range 6–12 Å−1, (b) 9–15 Å−1, (c) 11–17 Å−1, and (d) 14–21 Å−1. All spectra have been baseline corrected using a linear background. | ||
The low-energy region [Fig. 7(a)], as related to δ(O–H) fundamentals, can be divided into four components, marked as a1, a2, a3 and a4. The higher-energy region [Fig. 7(b)] can be divided in 5 components (b1, b2, b3, b4, and b5), which are assigned as first overtones and combinations of the δ(O–H) fundamentals. Note that the shape of the δ(O–H) band region in Fig. 7(b) resembles that in Fig. 7(a), which provides further support for the assignment to overtones. Further, looking at Table 1 in the Theoretical considerations section, for the fundamental wag modes (v = 1, n = 1) and overtones (v = 1, n = 2) the calculated values of Qmax are 7.3 and 10.2 Å−1, respectively. This means that  . Using this relation one can therefore estimate that the overtones of a1–a4 should be characterized by Qmax values of ca. 11.0 Å−1, 11.7 Å−1, 13.0 Å−1 and 14.1 Å−1. These results are in good agreement with the experimental Qmax values of the b1–b5 components as reported in Table 2.
| Band | ω [meV, (cm−1)] | Q max [Å−1] | Assignment |
|---|---|---|---|
| a1 | 93 (782) | 7.8 | δ(O–H) |
| a2 | 108 (903) | 8.3 | δ(O–H) |
| a3 | 128 (1089) | 9.2 | δ(O–H) |
| a4 | 150 (1210) | 10.0 | δ(O–H) |
| b1 | 200 (1573) | 10.7 | 2δ(O–H) |
| b2 | 222 (1790) | 11.4 | 2δ(O–H) |
| b3 | 250 (2057) | 12.15 | 2δ(O–H) |
| b4 | 285 (2218) | 12.8 | 2δ(O–H) |
| b5 | 310 (2460) | 13.4 | 2δ(O–H) |
| c4 | 350 (2742) | 13.9 | ν(O–H) |
| c3 | 375 (3025) | 13.9 | ν(O–H) |
| c2 | 410 (3307) | 14.2 | ν(O–H) |
| c1 | 432 (3549) | 14.7 | ν(O–H) |
| d1 | 500 (3992) | 16.0 | δ(O–H) + ν(O–H) |
| d2 | 520 (4194) | 16.0 | δ(O–H) + ν(O–H) |
| d3 | 540 (4355) | 16.2 | δ(O–H) + ν(O–H) |
| d4 | 555 (4476) | 16.7 | δ(O–H) + ν(O–H) |
| d5 | 575 (4678) | 17.3 | 2δ(O–H) + ν(O–H) |
| d6 | 610 (4920) | 17.6 | 2δ(O–H) + ν(O–H) |
| d7 | 634 (5162) | 17.6 | 2δ(O–H) + ν(O–H) |
| d8 | 650 (5283) | 17.9 | 2δ(O–H) + ν(O–H) |
| d9 | 680 (5485) | 18.9 | 2δ(O–H) + ν(O–H) |
Peaks in the range 340–480 meV [Fig. 7(c)] fall into the energy region expected for ν(O–H) fundamentals, hence the components marked as c1–c4 are assigned to such modes.26,29,32,58–61 Peaks at even higher energies, 500–700 meV [Fig. 7(d)], are assigned as higher-order transitions. Considerations of both the position and intensity of the fundamental modes suggest that bands d1–d4 and d5–d9 are assigned as binary and ternary combinations of fundamental δ(O–H) and ν(O–H) modes, respectively. A list of the 22 components, including Qmax and tentative assignments, are shown in Table 2, whereas the trend of Qmax against the vibrational energy ω is shown in Fig. 5. As expected, the Qmax values lie very close to the theoretical hydrogen recoil line, calculated as
5.4 Ab initio molecular dynamics simulations
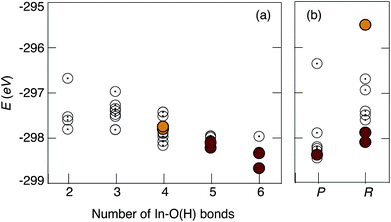
Concerning the uncorrelated defects models, the presented data are ordered as a function of increasing number of In–O(H) bonds present in the model. We remark that the models designed with more In–O(H) bonds are generally more stable, in full agreement with the current view on the attractive nature of the proton–dopant association, i.e. proton trapping, which is usually treated as an hindrance to proton diffusivity.9,16–23 However, due to the high doping concentration, in the present study the In atoms are percolated by design in the structural models. Therefore, the diffusion of the proton away from a dopant atom is not required even in long-range diffusion and, as such, the concept of proton trapping is not directly transferable to the highly doped 50In/BZO material as studied here.
Concerning the correlated defects models, the results suggest that structures with overlapping of more than two shells are generally, energetically, the least stable ones. Furthermore, while stronger hydrogen bonds are found in the correlated defects models, we found no clear relationship between the hydrogen bond strength and the total energy of the system. A total of 10 inequivalent structural models, of which 6 uncorrelated defects and 4 correlated defects, were selected on the basis of stability for AIMD simulations.
For the purpose of relating the computational results to the experimental INS spectrum, which is featured by inhomogeneous broadening, we shall in the following consider the ensemble of proton trajectories as a unique structural model. Accordingly, the proton vibrational spectra of the uncorrelated and correlated models, over the δ(O–H) and ν(O–H) regions, have been summed and normalized and are in very good agreement with the INS spectrum (Fig. 10). The variations in shape and frequency of the ν(O–H) and δ(O–H) bands between the two models reveal, in average, a higher tendency for the formation of strong hydrogen bonds in the correlated defects models. This result supports the idea that protons in close proximity may stabilise strong hydrogen bonds by the cooperative increase of structural distortions, that is consistent with the original design of the structural models.
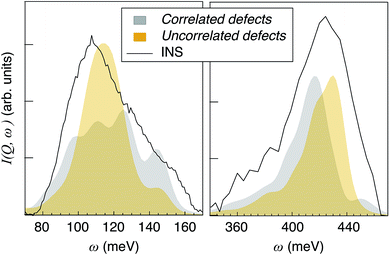 | ||
| Fig. 10 Sum of all the simulated VDOS for uncorrelated defects and correlated defects configurations, together with the INS spectrum, in the δ(O–H) (left) and ν(O–H) (right) regions. | ||
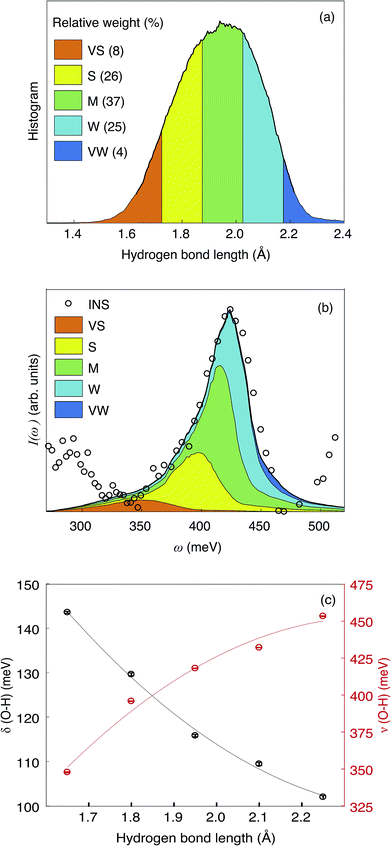
In Fig. 11(a) we show the distribution of the hydrogen bond lengths, as derived from the model summed over all proton trajectories. The distribution can be approximated by a normalized Gaussian function with parameters ![[d with combining macron]](https://www.rsc.org/images/entities/i_char_0064_0304.gif) O⋯H = 1.940(2) Å and FWHM = 0.371(4) Å. Previous computational work using DFT calculations have reported hydrogen bond lengths between 1.75 Å and 2.28 Å in hydrated In-doped BaZrO3 (ref. 29 and 62) and between 1.6 Å and 2 Å in hydrated Ba2In2O5.61 The excellent agreement between these numbers and the distribution of hydrogen bond lengths obtained in this work provides support and validation of our results.
O⋯H = 1.940(2) Å and FWHM = 0.371(4) Å. Previous computational work using DFT calculations have reported hydrogen bond lengths between 1.75 Å and 2.28 Å in hydrated In-doped BaZrO3 (ref. 29 and 62) and between 1.6 Å and 2 Å in hydrated Ba2In2O5.61 The excellent agreement between these numbers and the distribution of hydrogen bond lengths obtained in this work provides support and validation of our results.
The Gaussian shape of the distribution indicates that the ensemble of trajectories does not contain an unreasonably populated “exotic” local structure with either extremely weak or extremely strong hydrogen bond, whereas the large FWHM is due to the inhomogeneous broadening of the model of an ensemble of trajectories. For a more detailed analysis, we divide the hydrogen bond distribution into five domains: hydrogen bonds with bond length close to ![[d with combining macron]](https://www.rsc.org/images/entities/i_char_0064_0304.gif) O⋯H are referred to as medium (M) hydrogen bonds, whereas those with shorter or longer bond lengths are referred to as strong (S) and weak (W) hydrogen bonds, respectively. We also define very strong (VS) and very weak (VW) hydrogen bonds, with bond lengths lower than 1.725 Å and higher than 2.175 Å, respectively. Note the asymmetry of the distribution towards shorter bond lengths, with ca. 8% of the hydrogen bond being in the VS group, compared to ca. 4% in the VW group.
O⋯H are referred to as medium (M) hydrogen bonds, whereas those with shorter or longer bond lengths are referred to as strong (S) and weak (W) hydrogen bonds, respectively. We also define very strong (VS) and very weak (VW) hydrogen bonds, with bond lengths lower than 1.725 Å and higher than 2.175 Å, respectively. Note the asymmetry of the distribution towards shorter bond lengths, with ca. 8% of the hydrogen bond being in the VS group, compared to ca. 4% in the VW group.
The trajectories were filtered according to this grouping and the VDOS associated to the filtered trajectories (VDOSf) are shown in Fig. 11(b) and S1(b),† over the ν(O–H) and δ(O–H) region, respectively. Due to the “uneven sampling” of the filtered trajectories, the leakage issue from the PSD calculation cannot be properly compensated, which translates into an artificial broadening of the bands and a Lorentzian-like component to the lineshape. However, the spectral weight of each VDOSf is comparable to the relative population from the bond-length distribution, and the frequency of the bands are unaffected by the broadening effect. Furthermore, the artificial broadening does not exceed the experimental resolution, as seen by comparison with the INS spectrum. Fig. 11(c) shows the frequencies of the δ(O–H) and ν(O–H) bands for each interval of this hydrogen bond length grouping.
The sum of the VDOSf and the experimental spectrum are in overall in good agreement with each other [Fig. 11(b), S1(b)†], which enables the association of the various hydrogen bond length intervals to the band assignment as shown in Fig. 7 and Table 2. One should note that the grouping of hydrogen bond lengths is merely a mathematical operation and that the chosen intervals do not have an intrinsic physical meaning. This means that we should not expect the VDOSf to correspond to specific INS vibrational bands, rather the computational results should be used to deduce information on the relationship between vibrational frequency and hydrogen bond strength. For the δ(O–H) region [Fig. S1(b)†], the VDOSf bands are generally broad and strongly overlapping with each other, making the comparison to specific components of the INS spectrum difficult. For the ν(O–H) region [Fig. 11(b)], the S, M and W bands are more separated from each other. A comparison between the INS bands and the VDOSf suggests a correspondence of the a1 and c1 bands to weak (W) hydrogen bonding, of the a2, a3 and c2 bands to medium (M) hydrogen bonding and of the a4 and c3 bands to strong (S) hydrogen bonding. The assignment of the c4 peak is less clear, as it may correspond to either strong or very strong hydrogen bonding.
6 Discussion
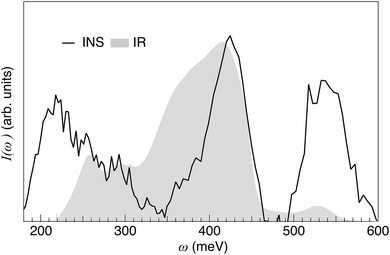
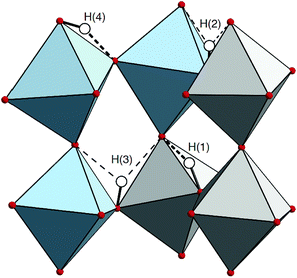
By bringing together the results from the IR and INS experiments [Fig. 12] and DFT calculations, we are now able to understand several new features pertaining to the local coordination environment and vibrational dynamics in 50In/BZO. In particular, the analysis of the Q dependence of the INS spectrum of 50In/BZO establishes that fundamental δ(O–H) and ν(O–H) modes are located in the energy ranges 80–150 meV and 350–450 meV, respectively, whereas the features as observed in the energy ranges 180–320 meV and 510–700 meV are, at least primarily, associated with higher-order transitions. The generally very good agreement between the experimental and calculated spectra over the δ(O–H) and ν(O–H) regions, both in terms of peak positions and shapes, suggests that, in spite of the rather limited number of structural models and simulation lengths, the main features of the material have been caught in the simulation framework. Specifically, the fact that only the fundamental modes are estimated from the VDOS and no significant spectral contributions fall in the energy ranges of the overtones further supports the assignment based on the Q dependent analysis of the INS spectrum. This leads us to include, in a first approximation, the assignment of the two low energy IR-active bands at 250 and 290 meV, respectively, to overtones or combinations of δ(O–H) modes and the 530 meV band to δ(O–H) + v(O–H) combination modes.We note, however, that the IR spectrum of hydrated and dehydrated samples of 50In/BZO do not show any clear peaks or large spectral differences in the region expected for δ(O–H) fundamentals (ω = 80–160 meV).63 This suggests that the δ(O–H) modes in 50In/BZO are virtually IR inactive modes, which would rather point towards that the 250 and 290 meV modes relate to some sort of “extreme” structural arrangement, featured by a hydrogen-bond length of the order of 1.5 Å. Structures with such strong hydrogen bonds are indeed present in the AIMD simulations and characterized by a strong tilting or distortion of the BO6 octahedron vicinal to the proton experiencing the strong hydrogen bonding. The amplitude of the distortion is maximal, and the hydrogen bond strongest, when the protons and oxygen atoms involved in the distortion are the most displaced from their average position. Fig. 13 shows an example of such a structure, which is featured by a hydrogen bond length as short as 1.489 Å, as extracted from the AIMD trajectories. It should be noted, however, that these local proton arrangements are only found here due to the classical description of the atoms and, being extremely short-lived (<10 fs), are most unlikely to generate a well-defined band in the IR spectrum. Therefore, in case the 250 and 290 meV bands are indeed related to fundamental modes, they can, reasonably, only be stabilized in heavily distorted environments, perhaps induced by the presence of structural defects such as oxygen vacancies and/or grain boundaries. Regarding the latter, recent theoretical studies show an ν(O–H) frequency of about 324 meV for protons in inter-octahedral hydrogen-bonding configurations at the interface between grains in BaZrO3 based materials.64,65
Of relevance here, the concept of an extended distortion domain has been suggested as the origin of an increased hydrogen bond strength, i.e. lower ν(O–H) frequency, in a recent computational work on Y-doped BaZrO3.66 This work, which was based on models with a single dopant (x = 1/8) and two protons, suggested that the protons tend to pair, in agreement with previous results from Bork et al.67 on SrTiO3, and that the proton–proton vicinity affects the hydrogen bond strength. According to these works, the effect of one proton on another one is not a mere direct proton–proton interaction, but rather is driven by local lattice distortion. In the present scenario involving 4 protons (x = 4/8), it is reasonable to observe this effect to be even more preponderant. While our results are in full accordance with the results by Gomez et al.66 on the concept of extended distortions, we suggest that these distortions are, at least partially, dynamical rather than static at room temperature, as they span both the oxygen atom dynamics and the extended proton arrangement. Whatever the case, the concept of extended distortions is consistent with the coexistence of numerous local proton configurations and thus the apparent large inhomogeneous broadening of the vibrational spectra of 50In/BZO.
In this context it is important to note that the concept of proton trapping, considered to be the main hindrance to proton mobility, is not transferrable to the high-doping scenario discussed here. This is not because 50In/BZO cannot be described as a dilute system with dopant atoms as point defects, but because the proton does not need to escape the vicinity of the dopant atoms to diffuse throughout the perovskite lattice, suggesting that the proton trapping effect is not as critical in the high-doping limit. With a view towards the material's proton conductivity, we have shown that the lattice dynamics, and in particular the oxygen modes, are affecting the hydrogen bond lengths [Fig. 11(c)], thus the proton environments. The dynamical motion of the oxygen atoms, hence of the proton positions, and of the hydrogen bond strength, should be associated to fluctuations of the potential energy barrier associated to specific diffusion events. For instance, an oxygen-triggered weakening of the hydrogen bond may favor the reorientational motion of the –OH group, while a strengthening may favor proton hopping. This concept is consistent with the generally lower activation energy of localized proton dynamics as determined experimentally with QENS with respect to predictions from ab initio simulations.68
We end this discussion by pointing out the large difference between the IR and INS intensity in the region of ν(O–H) modes, especially for low vibrational frequencies, and hence strong hydrogen-bonding configurations, for which the IR intensity is considerably stronger than the INS intensity (Fig. 12). As the INS intensity is proportional to the number of vibrating species, it implies that the IR absorbance cross section increases as a function of increasing ν(O–H) frequency. This shows that the IR intensity cannot (alone) provide a good measure of the number of protons in the different types of proton sites present. This new information is crucial for a quantitative analysis of IR spectra of proton conducting oxides and may have important repercussions for the investigation and reinvestigation of local structural properties of these, and similar materials generally.
7 Conclusions
We have performed a detailed analysis of the local coordination environment and vibrational dynamics of protons in a hydrated sample of 50% In-doped BaZrO3 (50In/BZO), using PXRD, IR spectroscopy, and INS together with AIMD simulations. We show that the experimental INS and IR spectra of 50In/BZO are the spectral response of a large range of different local proton environments in the material and establish the assignment of fundamental δ(O–H) and ν(O–H) modes in the energy ranges of 80–150 meV and 350–450 meV, respectively, whereas features at 180–320 meV and 510–700 meV are, at least primarily, associated with higher-order transitions of δ(O–H) and ν(O–H) modes. Specifically, we find that the IR active peaks at approximately 250 and 290 meV are most likely related to fundamental ν(O–H) modes in the vicinity of strongly tilted (Zr/In)O6 octahedra of the perovskite lattice. Furthermore, we show that the vibrational modes of the perovskite host lattice, which are thermally activated for temperature above ca. 300 K, induce strong fluctuations of the local proton environments, whereas the interaction between protons comes into play through the stabilization of pronounced structural distortions that increases the diversity of the proton sites. It is argued that, converse to more weakly doped systems such as 20% Y-doped BaZrO3, the dopant–proton association effect does not hinder the diffusion of protons due to the presence of percolation paths of dopant atoms throughout the perovskite lattice.Conflicts of interest
There are no conflicts to declare.Acknowledgements
This project was supported by the Swedish Research Council (grant No. 2008-6652, 2010-3519 and 2011-4887) and the Swedish Foundation for Strategic Research (grant No. ICA10-0001). The STFC Rutherford Appleton Laboratory is thanked for access to neutron beam facilities. Simulations were performed on resources provided by the Swedish National Infrastructure for Computing (SNIC) at PDC Center for High Performance Computing (PDC-HPC).References
- H. Malerød-Fjeld, D. Clark, I. Yuste-Tirados, R. Zanón, D. Catalán-Martinez, D. Beeaff, S. H. Morejudo, P. K. Vestre, T. Norby, R. Haugsrud, J. M. Serra and C. Kjølseth, Nat. Energy, 2017, 2, 923–931 CrossRef.
- S. H. Morejudo, R. Zanón, S. Escolástico, I. Yuste-Tirados, H. Malerød-Fjeld, P. K. Vestre, W. G. Coors, A. Martínez, T. Norby, J. M. Serra and C. Kjølseth, Science, 2016, 353, 563–566 CrossRef CAS PubMed.
- C. Duan, J. Tong, M. Shang, S. Nikodemski, M. Sanders, S. Ricote, A. Almansoori and R. O'Hayre, Science, 2015, 349, 1321–1326 CrossRef CAS PubMed.
- J. A. Kilner and M. Burriel, Annu. Rev. Mater. Res., 2014, 44, 365–393 CrossRef CAS.
- L. Malavasi, C. A. J. Fisher and M. S. Islam, Chem. Soc. Rev., 2010, 39, 4370–4387 RSC.
- K. D. Kreuer, Annu. Rev. Mater. Res., 2003, 33, 333–359 CrossRef CAS.
- M. Karlsson, A. Matic, D. Engberg, M. E. Björketun, M. M. Koza, I. Ahmed, G. Wahnström, L. Börjesson and S.-G. Eriksson, Solid State Ionics, 2009, 180, 22–28 CrossRef CAS.
- M. Karlsson, A. Matic, E. Zanghellini and I. Ahmed, J. Phys. Chem. C, 2010, 114, 6177–6181 CrossRef CAS.
- M. Karlsson, D. Engberg, M. E. Björketun, A. Matic, G. Wahnström, P. G. Sundell, P. Berastegui, I. Ahmed, P. Falus, B. Farago, L. Börjesson and S. Eriksson, Chem. Mater., 2010, 22, 740–742 CrossRef CAS.
- D. Noferini, M. M. Koza, P. Fouquet, G. J. Nilsen, M. C. Kemei, S. M. H. Rahman, M. Maccarini, S. Eriksson and M. Karlsson, J. Phys. Chem. C, 2016, 120, 13963–13969 CrossRef CAS.
- D. Noferini, M. M. Koza and M. Karlsson, J. Phys. Chem. C, 2017, 121, 7088–7093 CrossRef CAS.
- D. Noferini, B. Frick, M. M. Koza and M. Karlsson, J. Mater. Chem. A, 2018, 6, 7538–7546 RSC.
- D. Noferini, M. M. Koza, S. M. H. Rahman, Z. Evenson, G. J. Nilsen, S. Eriksson, A. R. Wildes and M. Karlsson, Phys. Chem. Chem. Phys., 2018, 20, 13697–13704 RSC.
- R. Hempelmann, C. Karmonik, T. Matzke, M. Cappadonia, U. Stimming, T. Springer and M. A. Adams, Solid State Ionics, 1995, 77, 152–156 CrossRef CAS.
- T. Matzke, U. Stimming, C. Karmonik, M. Soetramo, R. Hempelmann and F. Güthoff, Solid State Ionics, 1996, 86–88, 621–628 CrossRef CAS.
- Y. Yamazaki, F. Blanc, Y. Okuyama, L. Buannic, J. C. Lucio-Vega, C. P. Grey and S. M. Haile, Nat. Mater., 2013, 12, 647–651 CrossRef CAS.
- R. Hempelmann, M. Soetratmo, O. Hartmann and R. Wäppling, Solid State Ionics, 1998, 107, 269–280 CrossRef CAS.
- P. Haro-Gonzáles, M. Karlsson, S. Gaita, C. S. Knee and M. Bettinelli, Solid State Ionics, 2013, 247–248, 94 CrossRef.
- M. E. Björketun, P. G. Sundell and G. Wahnström, Faraday Discuss., 2007, 134, 247–265 RSC.
- P. G. Sundell, M. E. Björketun and G. Wahnström, Phys. Rev. B: Condens. Matter Mater. Phys., 2007, 76, 94301 CrossRef.
- S. J. Stokes and M. S. Islam, J. Mater. Chem., 2010, 20, 6258–6264 RSC.
- P. Raiteri, J. D. Gale and G. Bussi, J. Phys.: Condens. Matter, 2011, 23, 334213 CrossRef.
- N. Kitamura, J. Akola, S. Kohara, K. Fujimoto and Y. Idemoto, J. Phys. Chem. C, 2014, 118, 18846–18852 CrossRef CAS.
- F. Giannici, A. Longo, K. Kreuer, A. Balerna and A. Martorana, Solid State Ionics, 2010, 181, 122–125 CrossRef CAS.
- E. Fabbri, D. Pergolesi, S. Licoccia and E. Traversa, Solid State Ionics, 2010, 181, 1043–1051 CrossRef CAS.
- C. W. Mburu, S. M. Gaita, C. S. Knee, M. J. Gatari and M. Karlsson, J. Phys. Chem. C, 2017, 121, 16174–16181 CrossRef CAS.
- F. Giannici, A. Longo, A. Balerna, K. Kreuer and A. Martorana, Chem. Mater., 2009, 21, 2641–2649 CrossRef CAS.
- M. Karlsson, A. Matic, S. F. Parker, I. Ahmed, L. Börjesson and S. Eriksson, Phys. Rev. B: Condens. Matter Mater. Phys., 2008, 77, 104302 CrossRef.
- M. Karlsson, M. E. Björketun, P. G. Sundell, A. Matic, G. Wahnström, D. Engberg, L. Börjesson, I. Ahmed, S. Eriksson and P. Berastegui, Phys. Rev. B: Condens. Matter Mater. Phys., 2005, 72, 94303 CrossRef.
- I. Ahmed, C. Knee, M. Karlsson, S. Eriksson, P. F. Henry, A. Matic, D. Engberg and L. Börjesson, J. Alloys Compd., 2008, 450, 103–110 CrossRef CAS.
- I. Ahmed, S.-G. Eriksson, E. Ahlberg and C. S. Knee, Solid State Ionics, 2008, 179, 1155–1160 CrossRef CAS.
- M. Karlsson, I. Ahmed, A. Matic and S. G. Eriksson, Solid State Ionics, 2010, 181, 126–129 CrossRef CAS.
- J. E. Bertie and J. P. Devlin, J. Chem. Phys., 1983, 79, 2092 CrossRef CAS.
- S. F. Parker, S. M. Bennington, A. J. Ramirez-Cuesta, G. Auffermann, W. Bronger, H. Herman, K. P. J. Williams and T. Smith, J. Am. Chem. Soc., 2003, 125, 11656–11661 CrossRef CAS.
- J. Tomkinson, S. F. Parker and D. Lennon, J. Chem. Phys., 2010, 133, 34508 CrossRef.
- J. Laugier and B. Bochu, CELREF C3, Developed at the Laboratoire des Materiaux et du Genie Physique, Ecole Nationale Superieure de Physique de Grenoble, 2003 Search PubMed.
- R. I. Bewley, R. S. Eccleston, K. A. McEwen, S. M. Hayden, M. T. Dove, S. M. Bennington, J. R. Treadgold and R. L. S. Coleman, Phys. B, 2006, 385–386, 1029–1031 CrossRef CAS.
- S. F. Parker, F. Fernandez-Alonso, A. J. Ramirez-Cuesta, J. Tomkinson, S. Rudic, R. S. Pinna, G. Gorini and J. Fernández Castañon, J. Phys.: Conf. Ser., 2014, 554, 12003 CrossRef.
- O. Arnold, J. C. Bilheux, J. M. Borreguero, A. Buts, S. I. Campbell, L. Chapon, M. Doucet, N. Draper, R. Ferraz Leal, M. A. Gigg, V. E. Lynch, A. Markvardsen, D. J. Mikkelson, R. L. Mikkelson, R. Miller, K. Palmen, P. Parker, G. Passos, T. G. Perring, P. F. Peterson, S. Ren, M. A. Reuter, A. T. Savici, J. W. Taylor, R. J. Taylor, R. Tolchenov, W. Zhou and J. Zikovsky, Nucl. Instrum. Methods Phys. Res., Sect. A, 2014, 764, 156–166 CrossRef CAS.
- R. Coldea, ISIS, Mslice, Rutherford Appleton Laboratory, http://mslice.isis.rl.ac.uk/MainPage/, 2004 Search PubMed.
- M. Beé, Quasielastic Neutron Scattering, Adam Hilger, Bristol, 1988 Search PubMed.
- P. C. H. Mitchell, S. F. Parker, A. J. Ramirez-Cuesta and J. Tomkinson, Vibrational Spectroscopy with Neutrons, Word Scientific, Singapore, 2005 Search PubMed.
- G. Kresse and J. Hafner, Phys. Rev. B: Condens. Matter Mater. Phys., 1993, 48, 13115–13118 CrossRef CAS.
- G. Kresse and J. Hafner, Phys. Rev. B: Condens. Matter Mater. Phys., 1994, 49, 14251–14269 CrossRef CAS.
- G. Kresse and J. Furthmüller, Comput. Mater. Sci., 1996, 6, 15–50 CrossRef CAS.
- G. Kresse and J. Furthmüller, Phys. Rev. B: Condens. Matter Mater. Phys., 1996, 54, 11169–11186 CrossRef CAS.
- P. E. Blöchl, Phys. Rev. B: Condens. Matter Mater. Phys., 1994, 50, 17953–17979 CrossRef.
- G. Kresse and D. Joubert, Phys. Rev. B: Condens. Matter Mater. Phys., 1999, 59, 1758–1775 CrossRef CAS.
- J. P. Perdew, K. Burke and M. Ernzerhof, Phys. Rev. Lett., 1996, 77, 3865–3868 CrossRef CAS.
- D. M. Bylander and L. Kleinman, Phys. Rev. B: Condens. Matter Mater. Phys., 1992, 46, 13756–13761 CrossRef.
- S. Nosé, J. Chem. Phys., 1984, 81, 511 CrossRef.
- S. Nosé, Prog. Theor. Phys. Suppl., 1991, 103, 1–46 CrossRef.
- M. P. Allen and D. J. Tildesley, Computer simulation of liquids, Claredon Press, Oxford, 1987 Search PubMed.
- R. A. Young, The Rietveld Method, Oxford University Press, 1993, pp. 1–38 Search PubMed.
- I. Ahmed, S. G. Eriksson, E. Ahlberg, C. S. Knee, P. Berastegui, L. G. Johansson, H. Rundlöf, M. Karlsson, A. Matic and L. Börjesson, Solid State Ionics, 2006, 177, 1395–1403 CrossRef CAS.
- I. Ahmed, S. G. Eriksson, E. Ahlberg, C. S. Knee, M. Karlsson, A. Matic, L. Börjesson and D. Engberg, Solid State Ionics, 2006, 177, 2357–2362 CrossRef CAS.
- I. Ahmed, M. Karlsson, S. Eriksson, E. Ahlberg, C. Knee, K. Larsson, A. K. Azad, A. Matic and L. Börjesson, J. Am. Ceram. Soc., 2008, 91, 3039–3044 CrossRef CAS.
- K. D. Kreuer, Solid State Ionics, 1997, 97, 1–15 CrossRef CAS.
- K. D. Kreuer, Solid State Ionics, 1999, 125, 285–302 CrossRef CAS.
- D. Zeudmi Sahraoui and T. Mineva, Solid State Ionics, 2013, 253, 195–200 CrossRef CAS.
- J.-R. Martinez, C. E. Mohn, S. Stølen and N. L. Allan, J. Solid State Chem., 2007, 180, 3388–3392 CrossRef CAS.
- M. E. Björketun, P. G. Sundell and G. Wahnström, Phys. Rev. B: Condens. Matter Mater. Phys., 2007, 76, 54307 CrossRef.
- M. Karlsson, A. Matic, C. S. Knee, I. Ahmed, L. Börjesson and S. G. Eriksson, Chem. Mater., 2008, 20, 3480–3486 CrossRef CAS.
- A. Lindman, T. S. Bjørheim and G. Wahnström, J. Mater. Chem. A, 2017, 5, 13421–13429 RSC.
- A. Lindman, E. E. Helgee and G. Wahnström, Chem. Mater., 2017, 29, 7931–7941 CrossRef CAS.
- M. A. Gomez, D. L. Fry and M. E. Sweet, J. Korean Ceram. Soc., 2016, 53, 521–528 CrossRef CAS.
- N. Bork, N. Bonanos, J. Rossmeisl and T. Vegge, Phys. Chem. Chem. Phys., 2011, 13, 15256–15263 RSC.
- M. Karlsson, Phys. Chem. Chem. Phys., 2015, 17, 26–28 RSC.
Footnote |
| † Electronic supplementary information (ESI) available. See DOI: 10.1039/c8ta06202a |
| This journal is © The Royal Society of Chemistry 2019 |

