
 Open Access Article
 This Open Access Article is licensed under a
 Creative Commons Attribution 3.0 Unported Licence
Self-healing silk from the sea: role of helical hierarchical structure in Pinna nobilis byssus mechanics
Delphine
Pasche
 a,
Nils
Horbelt
a,
Frédéric
Marin
b,
Sébastien
Motreuil
b,
Peter
Fratzl
a and
Matthew J.
Harrington
*ac
a,
Nils
Horbelt
a,
Frédéric
Marin
b,
Sébastien
Motreuil
b,
Peter
Fratzl
a and
Matthew J.
Harrington
*ac
aDepartment of Biomaterials, Max Planck Institute of Colloids and Interfaces, Potsdam 14424, Germany
bUMR CNRS 6282 Biogéosciences, Université de Bourgogne – Franche-Comté, Dijon 21000, France
cDepartment of Chemistry, McGill University, 801 Sherbrooke Street West, Montreal, Quebec H3A 0B8, Canada. E-mail: matt.harrington@mcgill.ca
First published on 7th November 2019
Abstract
The byssus fibers of Mytilus mussel species have become an important role model in bioinspired materials research due to their impressive properties (e.g. high toughness, self-healing); however, Mytilids represent only a small subset of all byssus-producing bivalves. Recent studies have revealed that byssus from other species possess completely different protein composition and hierarchical structure. In this regard, Pinna nobilis byssus is especially interesting due to its very different morphology, function and its historical use for weaving lightweight golden fabrics, known as sea silk. P. nobilis byssus was recently discovered to be comprised of globular proteins organized into a helical protein superstructure. In this work, we investigate the relationships between this hierarchical structure and the mechanical properties of P. nobilis byssus threads, including energy dissipation and self-healing capacity. To achieve this, we performed in-depth mechanical characterization, as well as tensile testing coupled with in situ X-ray scattering. Our findings reveal that P. nobilis byssus, like Mytilus, possesses self-healing and energy damping behavior and that the initial elastic behavior of P. nobilis byssus is due to stretching and unraveling of the previously observed helical building blocks comprising the byssus. These findings have biological relevance for understanding the convergent evolution of mussel byssus for different species, and also for the field of bio-inspired materials.
Introduction
Many marine and freshwater mussels produce a protein-based anchoring holdfast known as a byssus. Most bivalves possess a byssus attachment at the larval stage used for settlement, but only some retain the byssus in adulthood.1 The byssus typically consists of numerous individual fibers – known as threads – that attach to substrates in the environment. Mytilus spp. mussels, which inhabit the most wave exposed regions of the rocky intertidal zone, use a versatile underwater glue to adhere to various surfaces, including rocks, wood pilings and other mussel's shells (Fig. 1a).2 The fibers themselves are extremely tough, self-healing and dissipate energy during cyclic loading from crashing waves arising from a semicrystalline arrangement of collagenous block copolymer-like proteins known as preCols (Fig. 1b and c).3–7 Other mussels, including the Mediterranean noble pen shell Pinna nobilis, live in calmer waters, with part of their shell buried beneath the sediment. P. nobilis produces a byssus consisting of tens of thousands of long, thin fibers that act as a mooring within the sediment (Fig. 1d).8 Recent findings indicate that the byssus fibers of P. nobilis possess entirely different protein composition and structural organization relative to Mytilus, raising the interesting possibility that byssus threads evolved convergently.9 Given the proven potential of byssus for bio-inspiration,10–12 it is clearly worthwhile to understand the comparative structure–function relationships that define these high-performance fibers across different species. Here, we investigate the relationship between the unusual helical protein superstructure of the P. nobilis byssus threads and their mechanics.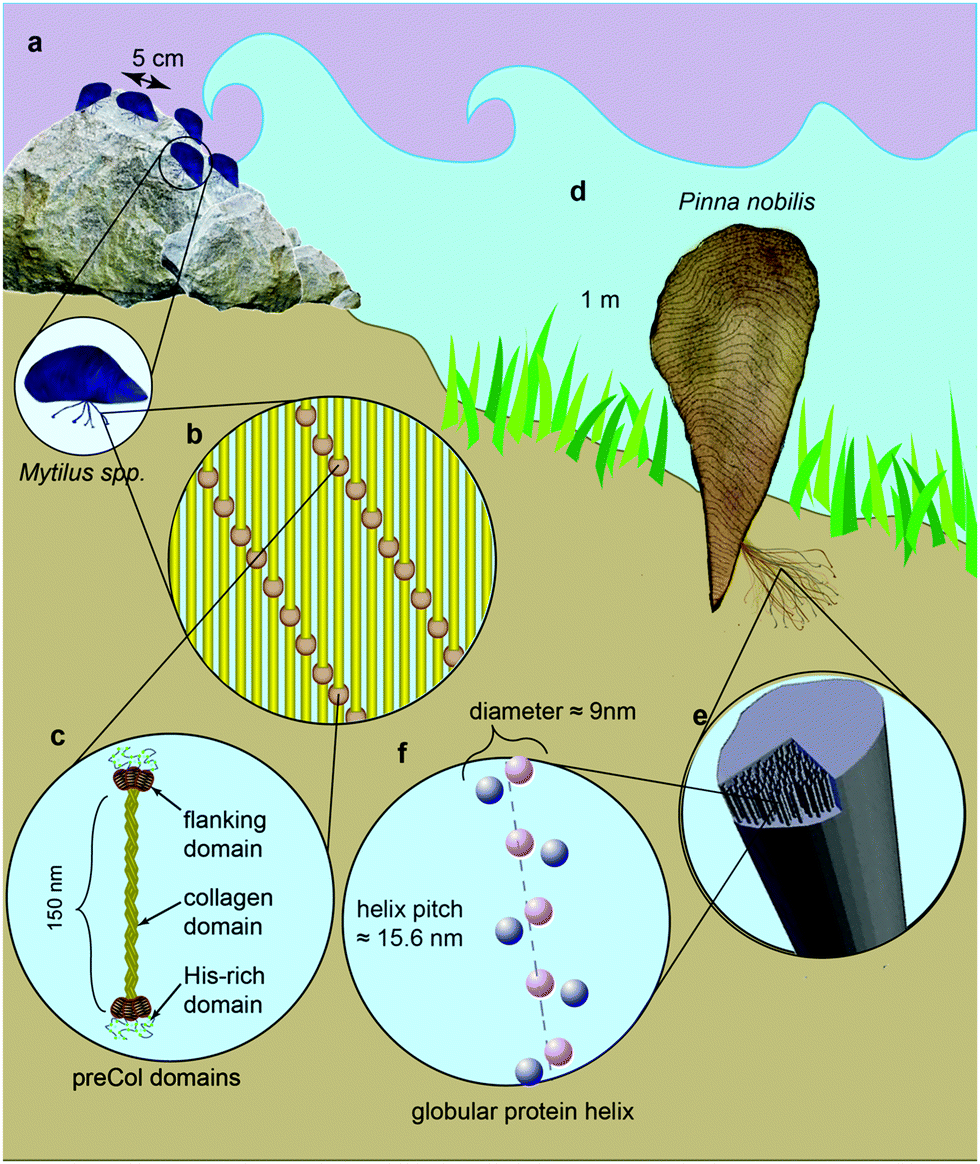 | ||
Fig. 1 Schematic view of Mytilus spp. and P. nobilis mussel habitats and byssus structure and composition. (a) Mytilus mussels live in the sea shore, anchored to hard substrates by 20–70 byssus threads. (b) Mytilus spp. threads are comprised of elongated collagenous proteins called preCols arranged in a semicrystalline organization. (c) PreCols have a block co-polymer-like structure with a central collagen domain, flanking domains resembling structural protein motifs (e.g. silk, elastin) and histidine-rich domains at the ends believed to coordinate metal ions. (d) P. nobilis mussels can be up to more than 1 m long. They live completely underwater, mainly in meadows of sea grass Posidonia with one third of their shell planted in the sandy ground. Their byssus comprises 20![[thin space (1/6-em)]](https://www.rsc.org/images/entities/char_2009.gif) 000–30000 threads. (e) The byssus fibers of P. nobilis consist of highly aligned helixes made of globular proteins. (f) Minimal model of P. nobilis byssus superhelix indicating diffraction centers based on SAXS measurements and simulations. 000–30000 threads. (e) The byssus fibers of P. nobilis consist of highly aligned helixes made of globular proteins. (f) Minimal model of P. nobilis byssus superhelix indicating diffraction centers based on SAXS measurements and simulations. | ||
Mytilus byssus threads possess the ability to dissipate up to 70% of mechanical energy and exhibit a capacity to self-heal following pseudoplastic mechanical damage,5–7,13–15 both of which are of primary importance for their survival on wave-beaten seashores and for interest as a role model for bio-inspiration. In contrast, Pinna nobilis is not exposed to high energy crashing waves, and one could therefore posit that their byssus plays a less important role from a mechanical viewpoint. However, not only is P. nobilis a prey for cephalopods (e.g. octopus) who aim to dislodge them from the sediment,16 but they are such large mussels (up to 1 m or more in length) that the drag forces acting on them even from subtidal currents can be significant, reaching more than 45 N.17 Therefore, it seems certain that the byssus plays a crucial role in the survival of P. nobilis individuals, functioning as a robust subterranean anchoring system.
Based on X-ray scattering studies, it was deduced that P. nobilis byssus is comprised of globular protein helices, resembling bacterial pili,18–20 embedded in an amorphous matrix (Fig. 1e and f).9 Recent mechanical studies comparing the tensile properties of P. nobilis byssus to other mussel species, including Mytilus spp.,21 revealed that while the stress–strain curve appears superficially similar to Mytilus threads in their general shape, P. nobilis threads exhibited lower extensibility, strength and yield strain than Mytilus, which the authors attributed to observed differences in the fiber composition. While these investigations yielded many interesting insights, they did not provide information about the energy dissipating capacity during cyclic loading likely experienced by threads in nature (e.g. when an octopus tries to uproot the mussel) or whether, like the threads of the Mytilids, they are self-healing. Moreover, there is currently no link between thread mechanical behavior and the unusual hierarchical structure observed in P. nobilis byssus threads.
Because P. nobilis byssus has such a peculiar hierarchical structure, the in-depth elucidation of its mechanical behavior and the understanding of the relationship between mechanics will also allow us to assess the degree of similarity in structure–function relationships across different mussel orders when compared to Mytilid mussels. In order to develop an understanding of the structure–function relationship in P. nobilis byssus, we performed an in-depth structure–function investigation of its tensile behavior, including fatigue and self-healing properties. Furthermore, synchrotron X-ray scattering studies combined with in situ tensile testing were performed to gain deeper insights into molecular mechanisms of mechanical performance, which has been previously successful with Mytilus spp. byssus threads.5,13,22 In addition to their biological and evolutionary implications, these findings are of potential interest for bioinspired materials, especially given the long history of using P. nobilis threads for weaving lightweight and tough golden-colored fabrics known as sea silk, prized in ancient times.23
Material and methods
Byssus fibers
Pinna nobilis is a heavily protected species according to the European Directive 92/43/CEE. Prior to collection, all sampling permits were obtained from the Direction Départementale des Territoires et de la Mer (DDTM) of Alpes-Maritimes department, France. Byssus threads were gently removed from the organisms, directly on site, without harming the animals, in the Villefranche-sur-Mer bay. A metadata file describing the sampling mission can be consulted at https://dataosu.obs-besancon.fr/FR-18008901306731-2019-04-11_Sampling-of-Mediterranean-fan-mussel-specimens.html. Collected byssus fibers were kept in 50 ml falcon tubes filled with Milli-Q water at 4 °C prior to utilization.Tensile testing
An in-house tensile tester with a humidity-control chamber was used in combination with a humidifier (custom-built by Dr Wernecke Feuchtemesstechnik Humigen, Potsdam, Germany) to maintain the desired humidity within the tensile testing chamber. A 2.5 N load cell (Honeywell) was used to measure the force during testing of byssus fibers. The tensile testing chamber possesses two windows allowing the use of a Keyence VHX-S550E microscope to record a video of the sample during testing.Samples were prepared by gluing both ends of a 5–6 mm long piece of a dried fiber across a pre-defined gap in plastic frame using polyurethane glue (Titebond®, UPS 037083023022). A second plastic frame was placed on top, and clamps were used to press this sandwich together during glue polymerization. Prepared samples were kept in deionized water overnight. Although native fibers do not typically undergo hydration–dehydration cycles in their native habitat, this was a necessary consequence of the gluing process. Efforts were made to minimize the time that the samples were in the dehydrated state. For testing, the clamp was removed, and the plastic frame sandwich containing the sample was placed on the sample holders so that the edges of the sample holders almost reached the edges of the hole of the plastic sandwich. The clamps of the machine were tightened and the supporting bridges of the plastic frame were cut using a hot wire cautery. The clamped fiber sample was then rehydrated in deionized water. The water was removed with a pipet after 15 min, and turmeric or coal powder was spread on the wet fiber so that particles stick to it that could be tracked on the video in order to measure the extension. The sample was left to equilibrate for 15 min at ≥90% humidity prior to testing.
During the test, the force was recorded by the load cell and the extensibility was measured on the video using a free tracking program called TRACKER. Force and extension were synchronized by aligning the force and video frame at the breaking point. The stress was calculated by normalizing the force by the cross-sectional area of the fiber, and the strain was calculated by dividing the displacement by the initial sample length. All tests were performed with a testing speed of 83 μm s−1.
The fiber cross-sectional area was measured by aligning the sample vertically under the digital microscope (Keyence VHX-S550E) and taking a picture. Because of its irregularity and random orientation, it was not possible to measure the breaking surface, and the sample was cut perpendicular to the fiber's length as close as possible to the breaking surface, and the surface of the cut was considered for cross-sectional area measurement. ImageJ was used afterwards to draw the contour of the cross section and measure its area. This was performed on dry fibers, which leads to a small underestimation of the cross-section of about 10% due to shrinkage. For simple tensile tests, ten fibers were stretched until failure. For cyclic tests, three fibers were cyclically loaded, where the maximum strain of the cycle was increased by approximately 3% strain for each subsequent cycle. For recovery tests (self-healing testing), five fibers were strained until just beyond the second yield point (about 30% strain), and the load was immediately removed, with the same displacement rate, down to 0% strain. A second cycle was immediately performed to the same maximal strain. Liquid water was then added to the bottom of the chamber so that the sample rested in water for approximately 20 hours. After this period of time, the liquid water was removed with a pipette, the chamber was closed and the sample left 15 min to equilibrate at ≥90% humidity. Finally, a last strain cycle was performed up to the same strain. For all measurements, the initial material stiffness was measured by linear regression of the initial linear region of the loading curves (<4% strain). Because the transition from elastic to non-linear behavior is very gradual, we used the method of the 0.2% strain offset to measure the yield strength and associated strain. Accordingly, the yield point was measured by tracing a line parallel to the initial linear region and crossing the strain axis at 0.2%. The intersection between this line and the loading curve defines the yield strain and stress. The areas under the loading and unloading curves were measured using the “Integrate” function in OriginPro. The dissipated energy, corresponding to the hysteresis area was calculated as the integration of the loading curve minus the integration of the unloading curve. In some cases, the dissipated energy was normalized by the total energy involved in the deformation (integration of the loading curve), expressed in percentage and called Ediss/Eload.
In situ tensile testing at the synchrotron
Wide and small angle X-ray scattering (WAXS and SAXS) measurements were conducted at BESSY II Berlin (Elektronenspeicherring Gesellschaft m.b.H., Berlin, Germany) MuSpot beamline.24 The X-ray wavelength was 0.82565 Å and the beam diameter was 50 μm for SAXS and 100 μm for WAXS. The diffraction patterns were collected on an Eiger X 9M detector from Dectrix (3110 × 3269 pixels, 75 μm pixel size). Diffraction patterns were processed with dpdak,25 and ImageJ.The tensile testing setup described above was also used while performing tensile testing combined with WAXS and SAXS, but the chamber was used in vertical position, and the windows were replaced by Kapton foil, which does not generate diffraction at similar angles as P. nobilis byssus fibers. In this case, the samples were prepared the same way as for simple tensile testing, but after clamping them in the sample holder, and melting the sides of the plastic stripes, the chamber was directly closed, and the samples were equilibrated at ∼70% humidity for about 20 min. Measuring at 70% humidity ensures that water does not condense on the sample or the windows, thus avoiding scattering of the signal by liquid water. In this case, recording the extension could only be done by continuously recording the motor position, and the force was recorded by the load cell. Tensile testing was performed with a displacement rate of 10 μm s−1, in strain steps. The sample was extended to the first desired strain, left to relax 5 min until the measured force was stable. The XRD signal was measured for 2 min. Then the sample was pulled to the next desired strain and the measurement process was repeated for the different strains up to disappearance of the diffraction peaks at about 4–6% for the SAXS signal and up to fiber failure for the WAXS experiment. After reaching the maximal strain, the sample was unloaded back to zero force and a diffraction pattern of the unloaded sample was acquired.
Fourier transform infrared spectroscopy-attenuated total reflection (FTIR-ATR)
Thin (15 μm) cryosections of frozen threads embedded in ice were prepared using a cryostat from Thermo Fisher ScientificTM Inc. (Microm HM 560). The cuts were laid on a glass slide and allowed to air-dry for 24 h. An FTIR microscope (Hyperion 2000, Bruker) was used for the measurements in ATR mode using an ATR objective. A background signal was measured in the air after each change of position on the sample. Each sample was measured several times at different spots in order to acquire 5 to 7 good spectra, which were averaged afterward. The tip of the ATR crystal was gently cleansed after each measurement with a small volume of ethanol on a kimwipe. Data were analyzed with the OPUS software from Bruker.Results
Simple tensile testing
Simple tensile tests were used as a first approach to characterize P. nobilis mechanical properties (Fig. 2a). In contrast to previous reports,21,26 we observed two yield points in the stress–strain curves, similar to the byssus of Atrina rigida, a closely related species in the Pinnidae family and Modiolus modiolus (Mytilidae).27 As shown in Fig. 2, the tensile curve of P. nobilis exhibited an initial linear elastic region, with a Young's modulus (YM) of 560 ± 120 MPa (mean ± standard deviation) followed by a first yield point at 2.7 ± 0.4% strain and 15 ± 4 MPa stress, leading to a much softer post-yield plateau slope of 66 ± 5 MPa. This plateau is followed by a post-yield stiffening slope of 260 ± 30 MPa, which is followed by a second yield point, at 30 ± 4% strain and 49 ± 6 MPa stress. Most of the samples break during the post-yield plateau following the second yield point at 34 ± 7% strain and 54 ± 6 MPa breaking stress. All these values are summarized in Table 1.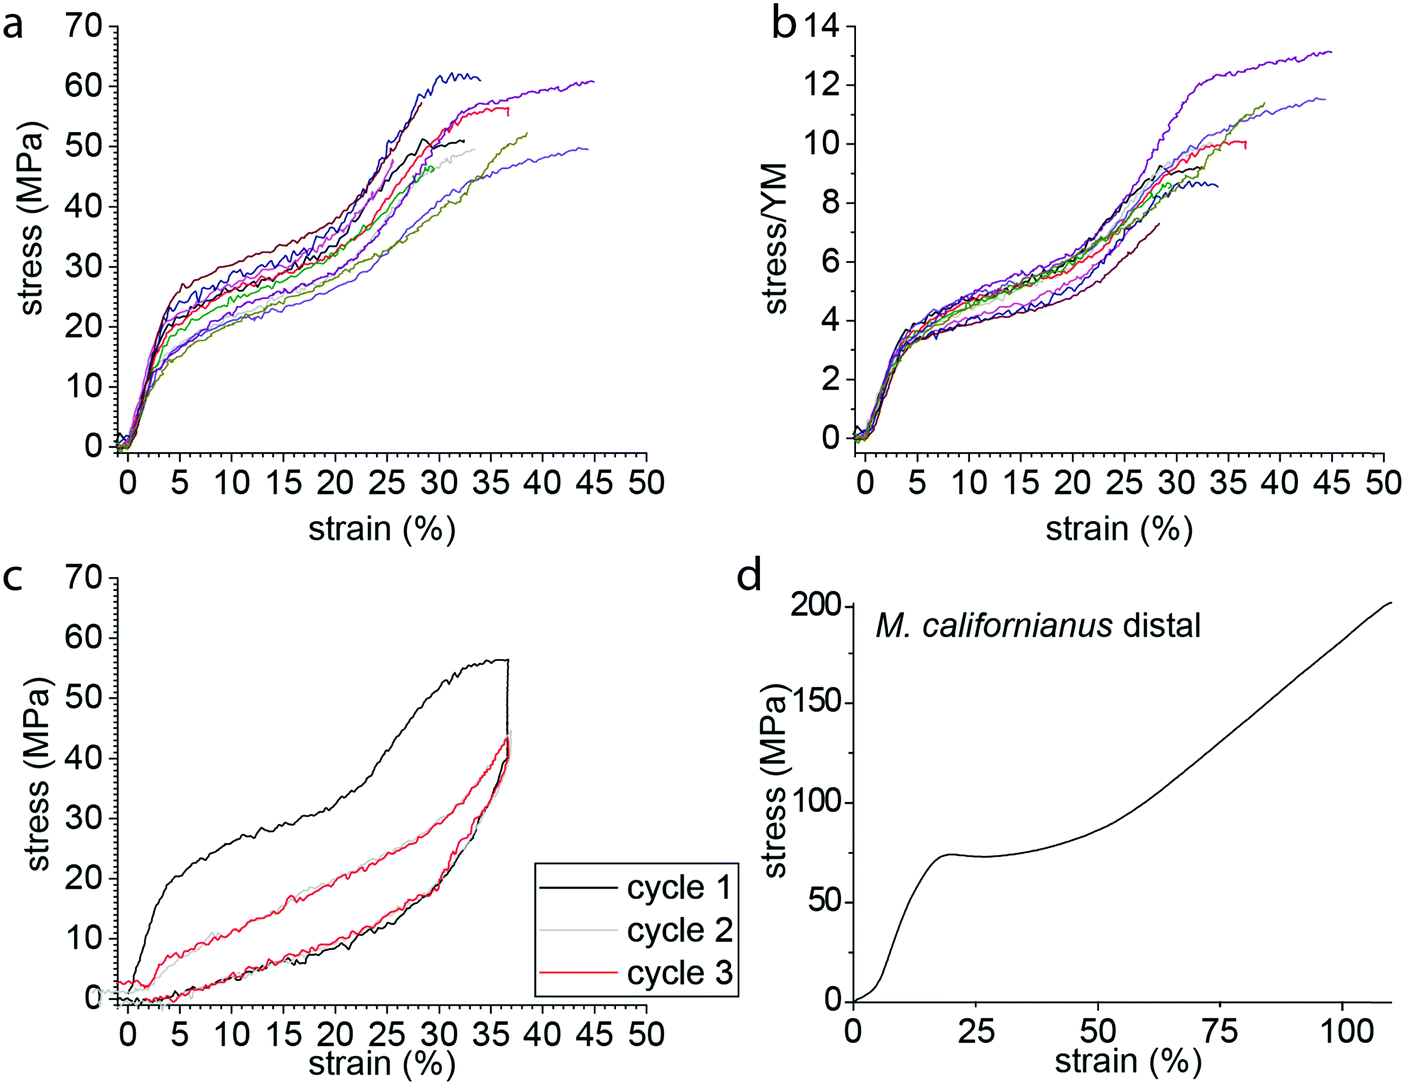 | ||
| Fig. 2 Stress–strain curve of single P. nobilis fibers. (a) Typical pull to break curves exhibit two stiff regions, two yield points, and two plateaus. The spread in the curves is at most likely due to the difficulty of measuring the correct cross section area of the single fibers. (b) The normalization of the stress by the Young modulus (YM) shows the consistency of the yield point between the different samples. (c) A typical cyclic curve for a sample pulled to about 35% strain and unloaded back to 0% strain (black), directly followed by a second and third cycle to the same strain. (d) Typical stress–strain curve from Mytilus spp. thread pulled to break for comparison. | ||
| Native | |
|---|---|
| Young modulus (MPa) | 560 ± 120 |
| Yield strain (%) | 2.7 ± 0.4 |
| Yield stress (MPa) | 15 ± 4 |
| Plateau slope (MPa) | 66 ± 5 |
| 2nd Stiff modulus (MPa) | 260 ± 30 |
| 2nd Yield strain (%) | 30 ± 4 |
| 2nd Yield stress (MPa) | 49 ± 6 |
| Maximal strain (%) | 34 ± 7 |
| Maximal stress (MPa) | 54 ± 6 |
| Toughness (MJ m−3) | 11 ± 3 |
The variation between the curves observed in Fig. 2a reflected by the standard deviations given in Table 1 originates partially from the difficulty to accurately measure the cross-section of the individual byssus fibers. Normalization by the Young's modulus (Fig. 2b) provides a means of correcting this uncertainty and reveals that all the fibers exhibit an extremely similar behavior and shows the very consistent position of the yield point between the different samples. The shape of this stress–strain curve already shows differences to those of Mytilus spp. byssus (Fig. 2d), which are often taken as a reference in byssus studies due to their in-depth study.3–5,7,13Mytilus byssus threads only exhibit a single yield point; however, under the same loading conditions (displacement rate ≈ 0.1 mm s−1, initial sample length 4–5 mm), P. nobilis threads possess a comparable stiffness in the initial region to Mytilus,5 but show a lower yield stress and strain and break at lower strength and elongation.3,4
We next examined the damping properties of the P. nobilis threads. One characteristic feature of Mytilus byssus is its ability to dissipate energy during cyclic loading,4 which ostensibly enables the organism to survive large forces from crashing waves. The energy dissipated during a loading cycle is defined as the area of the hysteresis formed by the loading and unloading curves. It is customary to normalize this energy by the total energy under the loading curve and express this as a percentage, which we label Ediss/Eload. During cyclic loading of P. nobilis threads, 66 ± 3% of the energy is dissipated for cycles to 36 ± 4% strain (Fig. 2c). This is similar to the Ediss/Eload observed in the distal region of Mytilus byssus threads, which was reported to be 66% for M. californianus byssus distal part cycled at 35%.4 If a thread is cyclically loaded repeatedly past the second yield point in succession (Fig. 2c), the mechanical properties of the second and all subsequent loading cycles are significantly reduced. This behavior is indicative of molecular level damage in the protein network that is not recovered on short timescales.5 Specifically, there is a complete loss of yield behavior and the initial stiffness is reduced to 35 ± 12% of its initial value, which is extremely similar to Mytilus threads.4
Cyclic testing
In order to further investigate the deformation and damage behavior of P. nobilis threads, we performed a fatigue test (Fig. 3a) in which threads were cyclically loaded and the maximal strain was increased incrementally by about 3% at each loading cycle. At strains below the yield strain, the hysteresis observed is small and the stiffness of subsequent cycles is similar to the preceding one. However, past the yield point, there is a continual decrease in materials stiffness with each successive cycle down to a value that is between 10–25% of the initial modulus by ∼50% strain. In other words, with each successive incremental increase of the strain, semi-permanent damage (on the time scale of the experiment) is apparent in the fiber. However, it is important to differentiate this from typical plastic damage, since the initial length is almost entirely recovered after each load cycle (i.e. there is very little residual strain). Notably, the envelope of the entire fatigue test (i.e. tracing the outer profile of all curves) remains similar to the simple tensile curve showed in Fig. 2a. In contrast, Fig. 3b shows that the percentage of energy dissipated during each successive cycle following the yield strain is highly consistent, with about 40% of the total mechanical energy applied dissipated by each cycle.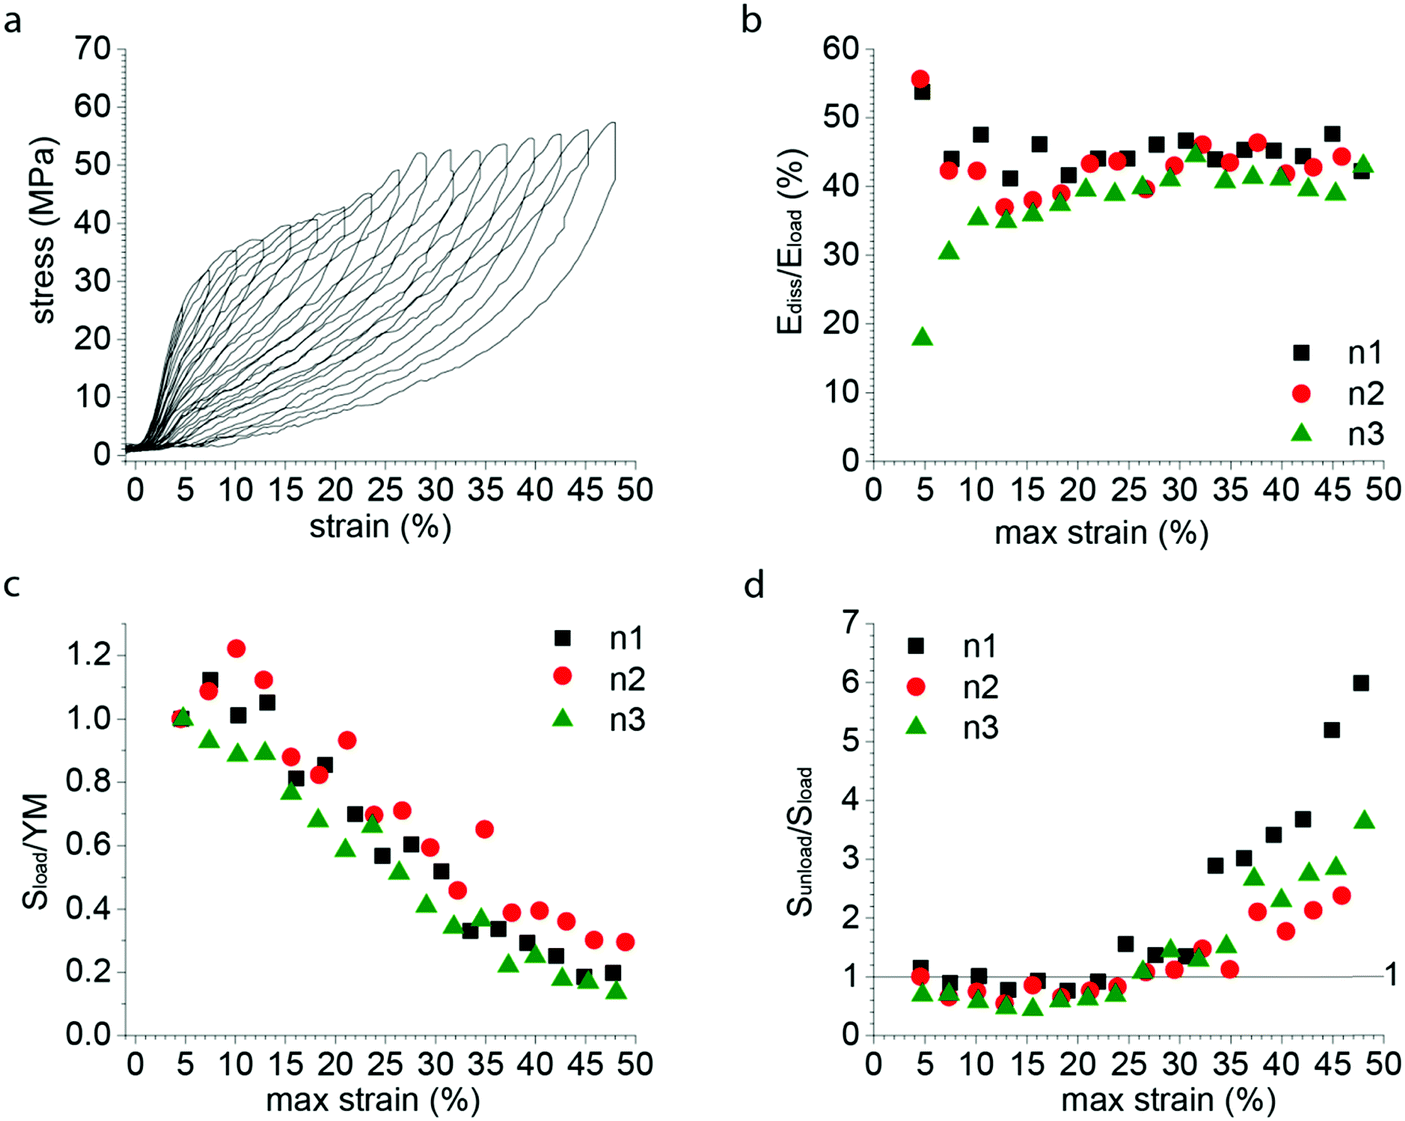 | ||
| Fig. 3 Fatigue tensile testing of P. nobilis byssus threads. (a) Typical fatigue test curve, with successive cycles exhibiting an increase of 3% of the maximal strain at each cycle. Despite the decrease in loading and unloading mechanical properties, the envelope drawn by the maximal strain-stress points is similar to a pulled to break curve. (b) The dissipated energy of each successive cycle of a fatigue test as shown in Fig. 3a was plotted versus the maximal strain of the considered cycle, for three different fibers. The percentage of energy dissipated (Ediss/Eload) is equal to the area of the hysteresis between the loading and unloading curves normalized to the area under the entire loading curve. (c) The initial slope of the loading curve of each successive cycle of a fatigue test as shown in Fig. 3a was divided by the Young Modulus (YM) of the first cycle, called Sload/YM and plotted versus the maximal strain of the considered cycle, for three different fibers. (d) The initial slope of the unload curve of each successive cycle of a fatigue test as shown in Fig. 3a was divided by the unload slope of the first cycle, called Sunload/Sload and plotted versus the maximal strain of the considered cycle, for three different fibers. | ||
Fig. 3d shows the ratio of the initial slope of the unloading curve (Sunload) (measured after the instantaneous relaxation) to the slope of the loading curve (Sload). The increase of this ratio from the end of the yield plateau (≈20%) shows that the driving force for the recoiling of the material (Sunload) continuously increases relative to the initial resistance of the material to deformation (Sload), whereas there is an inverse but less marked trend up to 15% maximal strain. This suggests that an additional mechanism appears from 15–20% maximal strain on, which gradually compensates the loss of unloading stiffness associated to the progressive damaging of the material showed by the gradual decrease in initial stiffness.
Self-healing
The significant hysteresis past the yield point and the successive drop in material stiffness with incremental increase of strain exhibited in Fig. 3b and c are indicative of molecular damage, and are consistent with the behavior of Mytilus, which was previously attributed to rupture of sacrificial metal coordination bonds and extension of hidden length in folded protein domains. However, in Mytilus, this apparent damage is followed by a time dependent self-healing process during which hidden length refolds and bonds reform (Fig. 4b). To test whether P. nobilis byssus threads exhibit a similar behavior, we performed multiple cyclic tests on individual threads, with the 1st and 2nd cycle measured directly after one another, and the 3rd cycle done after a 20 to 22 h resting period. Fig. 4a represents a typical recovery experiment. It can be observed that the first cycle exhibits the two yield points observed in Fig. 2, whereas the following cycle does not show any yield point and shows a significantly reduced stiffness. However, after overnight resting in water, the first yield point returns, albeit at a lower stress value, whereas the second yield point was still absent. Fig. 4c shows the mechanical hysteresis (Ediss/Eload) measured for all three cycles of five different fibers, all of which exhibited a clear recovery. Indeed, the average hysteresis was 66 ± 3% during the first cycle, 40 ± 5% during the second cycle and 52 ± 6% after recovery. A decrease in initial stiffness was observed during the second cycle from 570 ± 30 MPa to 210 ± 50 MPa, which is ∼36% of its initial value. However, it recovered to 450 ± 100 MPa, or ∼79% of its initial value (Fig. 4d).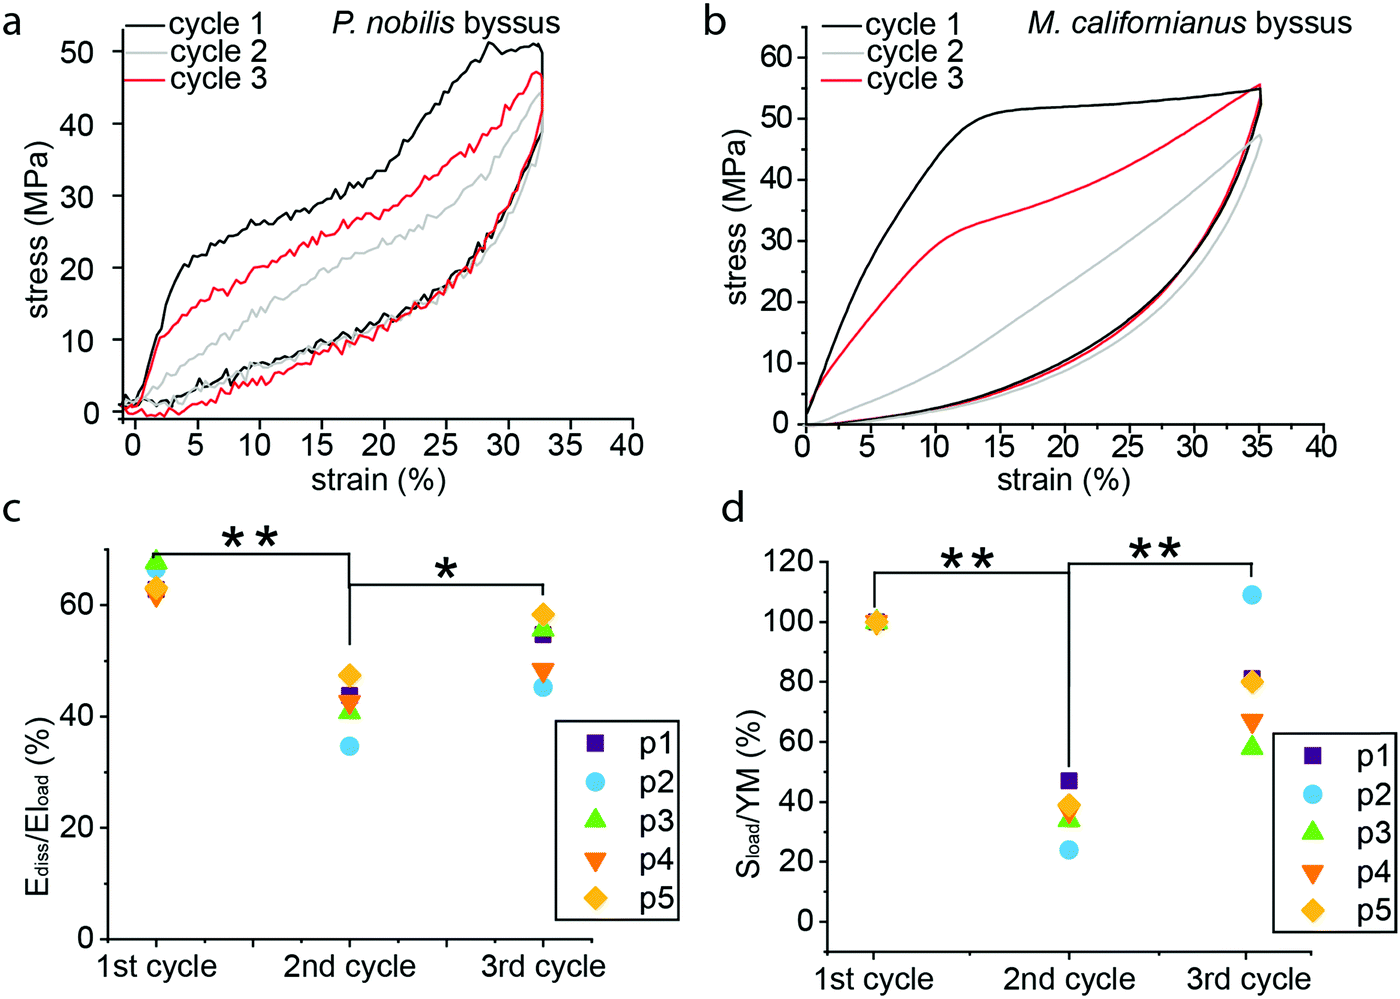 | ||
| Fig. 4 Recovery experiment on P. nobilis byssus fibers. (a) During recovery experiments, the 1st and 2nd cycles were conducted directly one after the other, and the 3rd cycle was performed following a 20–22 h rest period. (b) Cyclic stress–strain curve from a Mytilus californianus byssal thread showing damage in cycle 2 occurring immediately after cycle 1 and self-healing in cycle 3 occurring after ∼24 hours resting. The dissipated area (c) and normalized materials stiffness (d) was plotted for each cycle of five different threads treated similar to that in panel (a), showing the decrease of mechanical properties associated to the second cycle, and their recovery after the overnight rest. One-way ANOVA: *p < 0.05, **p < 0.01. | ||
X-ray scattering with in situ tensile testing
In order to gain a better understanding of the deformation mechanism of P. nobilis byssus threads at the molecular level, we used WAXS and SAXS coupled with in situ mechanical testing. SAXS was previously used to elucidate the hierarchical protein structure of P. nobilis byssus fibers, which are comprised of globular protein helices.9 The measurement of the position of the diffraction peaks characteristic for the helical structure during in situ mechanical testing enabled us to track the deformation of the byssus fiber at the level of the helical building blocks. Fig. 5a shows the SAXS pattern of P. nobilis byssus, which directly relates to the dimensions of the helical structure.9 A line integration was made as shown on Fig. 5a, comprising the opposite peaks corresponding to the 3rd order diffraction of the helix. Those were chosen because they were the most distinct and intense diffraction lines on the pattern. Line integration was performed for each diffraction pattern taken during the tensile test. For each diffraction pattern, the four half integrated curves corresponding to the four identical set of peaks present on the diffraction pattern were averaged and plotted on Fig. 5b. It can be directly observed that the diffraction peaks moved to smaller q values when macroscopic strain increased, but they also appear to get broader and less intense until they completely disappear around 5–6% macroscopic strain. Following extension until 4–6% strain (yield region), the samples were relaxed, and recovery of the peak and its initial position could be observed, although the peak remained broadened (Fig. 5b). In contrast, the 2nd order equatorial SAXS peak, previously postulated to indicate the lateral spacing of the helices,9 does not appear to shift significantly in position, although, the intensity does decrease with increasing applied strain (Fig. 5c).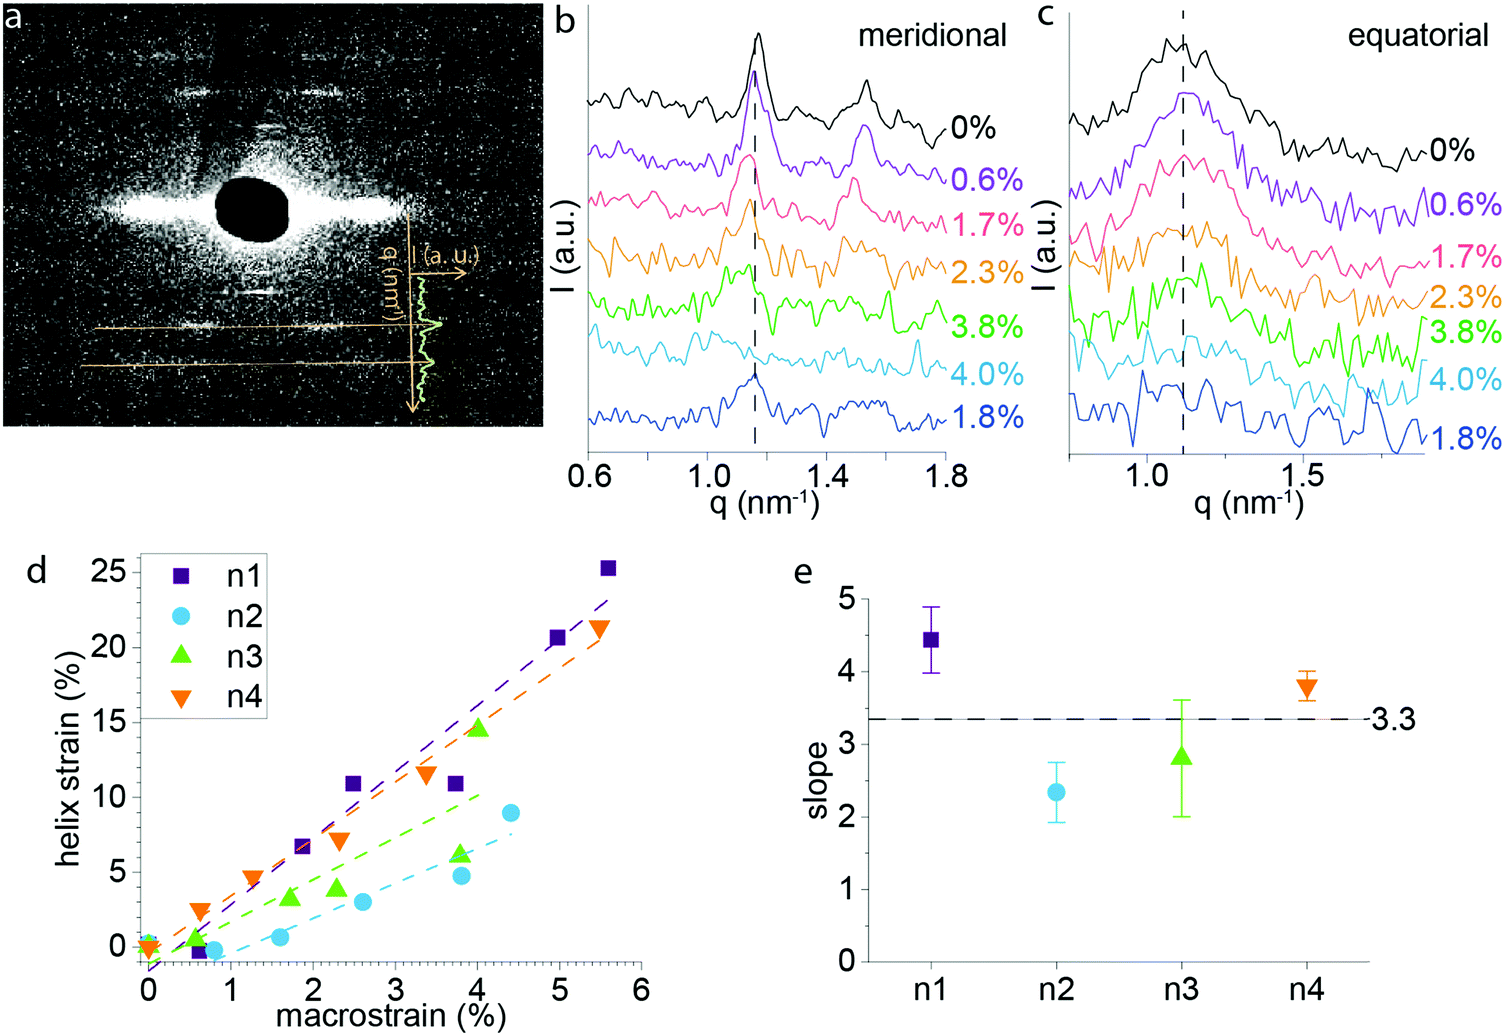 | ||
| Fig. 5 SAXS with in situ tensile testing of P. nobilis byssus fiber. (a) Diffraction pattern of P. nobilis byssus fiber. The superimposed curve of the intensity (I) versus position (q) shows how the 3rd and 4th order diffraction lines translate into peaks on the intensity profile following azimuthal integration. (b) Intensity (I) versus position (q) resulting from the meridional line integration around the 3rd and 4th order diffraction for successive strains during the in situ tensile testing experiment. (c) Intensity (I) versus position (q) resulting from the equatorial integration for successive strains during the in situ tensile testing experiment. (d) Helix strain was calculated from the position of the 3rd order meridional diffraction peak at each macrostrain for four samples, and the helix strain was plotted versus the macrostrain. Each sample set of acquired points was fitted with a straight line (the first point of Pinna 4 was omitted since the helix did not start stretching before 0.5% fiber strain). (e) The slope of the linear fit and its standard error are plotted for each sample, and the horizontal line at a slope of 3.3 represents the average. | ||
Based on the position (q) of the meridional peak observed in Fig. 5b, it was possible to calculate the helical pitch, and thus, the strain of the helix at each macroscopic strain. The helix strain versus macroscopic strain of the fiber is plotted in Fig. 5d. Notably, the strain on the helices at the supramolecular level is unexpectedly larger than the macroscopic strain on the thread: e.g. for a macroscopic strain of 4%, helical strains of up to 14% are observed. Linear fits of plots of helix strain vs. macroscopic thread strain revealed an average slope of 3.3 ± 0.1 meaning that the helix is extending about 3 times that of the macroscopic thread on average in the initial linear region of the stress–strain curve (Fig. 5e). Possible explanations for this phenomenon are discussed further below.
Although it was not previously analyzed in depth, P. nobilis byssus threads also exhibit a broad, largely amorphous ring in the WAXS region (q between 15 and 21 nm−1).9 Therefore, we performed additional in situ tensile tests to much higher strains while measuring the WAXS signal. Here, an azimuthal integration was performed to generate a radial intensity profile in the meridional and equatorial regions of the WAXS ring. This provides information about ordered protein structure oriented parallel and perpendicular to the fiber axis, respectively. The integration areas are shown by the two black selections on Fig. 6a. The equatorial and meridional integrated intensity profiles for the different macroscopic strains are displayed in Fig. 6b and c, respectively. Several poorly defined peaks can be seen on top of the amorphous background (at q ≈ 16 nm−1 and 18 nm−1) in the meridional integration, which completely disappear when the macroscopic strain reaches 25%. In contrast, in the equatorial direction (i.e. perpendicular to the fiber axis), no clear peaks were visible above the amorphous background; however, a lower q peak (∼4 nm−1) is observed that appears to decrease with increasing strain. Interestingly, the integrated intensity profile observed at 30% strain is nearly identical in both meridional and equatorial axes, probably corresponding to the amorphous background that can be observed under the weak peaks at lower strains. Based on this assumption, we subtracted the intensity plot at 30% strain from that measured at 0% strain for both the equatorial and meridional integrations (Fig. 6d). While the difference plot in the equatorial direction does not show any notable features, the meridional plot exhibits a broad peak centered around q = 16.5 nm−1 corresponding to d-spacings of ∼0.38 nm, respectively. While it is difficult to specifically assign this spacing due to the large background and low signal to noise ratio, this observation is consistent with the presence of partially aligned secondary structures along the fiber axis based on their positions and the knowledge that the thread is comprised of protein.13,28–30
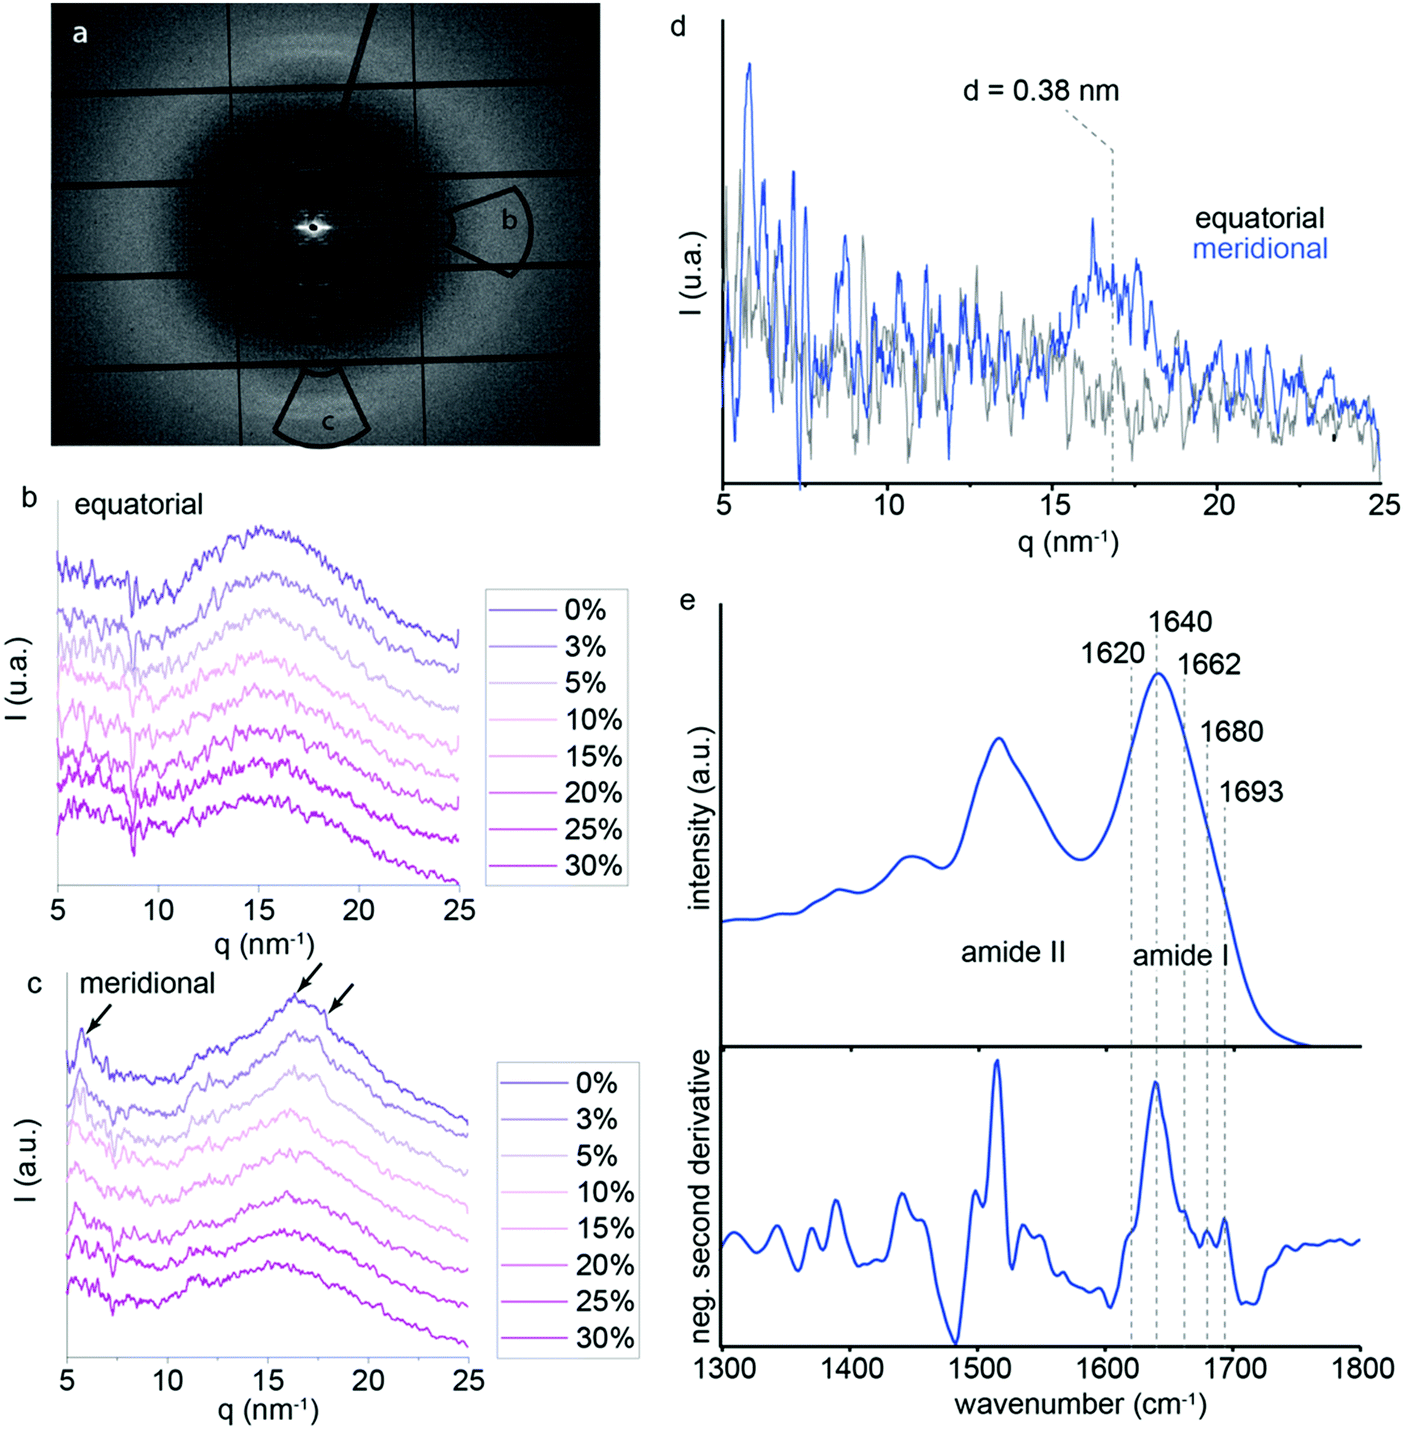 | ||
| Fig. 6 WAXS with in situ tensile testing of P. nobilis byssus fiber. (a) WAXS pattern of a single P. nobilis byssus thread, with the equatorial and the meridional integration area shown by black boxes. (b) Integration of the amorphous ring in the meridional direction for the several strains does not show distinct peaks on top of the amorphous background. (c) Equatorial integration of the pseudo amorphous ring in the WAXS area, for several strains during the tensile testing. (d) Difference plot of the intensities at 0% and 30% strain in the equatorial and meridional directions. (e) FTIR spectra of thread sections measured using an ATR objective, as well as negative second derivative to identify components of the amide I band. | ||
In order to further investigate the presence of regular secondary structure in the thread proteins, we performed Fourier transform infrared (FTIR) spectroscopy using an attenuated total reflectance (ATR) objective on ∼15 μm cryo-sections of threads. FTIR spectra acquired from the sections show a strong signal clearly corresponding to protein as indicated by the presence of dominant amide I and amide II bands (Fig. 6e).31,32 The amide I band, which provides information about the protein conformation is centered at 1640 cm−1, consistent with a mostly disordered secondary structure.31 Second derivative analysis is commonly used as an initial step to deconvolute overlapping bands corresponding to mixtures of different conformations.32 As expected, the second derivative spectrum is dominated by random coil structure (1638 cm−1); however, smaller components at 1619 cm−1 and 1692 cm−1 are indicative of beta sheet structure, while a component at 1680 cm−1 indicates beta turn structure (Fig. 5e).31 These observations are consistent with the WAXD observations, suggesting that there might be a small amount of regular structure, but that the proteins are largely unstructured. The fact that this signal disappears at high strains during in situ WAXD measurements, thus, supports the unfolding of globular protein structure as a contributing molecular mechanism during thread stretching past the yield point.
Discussion
Despite their entirely different biomolecular building blocks and hierarchical structure, the principal tensile mechanical features of P. nobilis byssus threads (e.g. stiffness, hysteresis, self-healing) are remarkably similar to those of Mytilus spp. While Pinnid individuals live a seemingly sedate lifestyle compared with Mytillids, as already mentioned, the ability to dissipate mechanical work in cyclic loading and capacity to self-heal may function against forces from cephalopod predators or drag forces under subtidal currents due to the large size of the mussels.16,17 In any case, this unexpected similarity in byssus mechanical performance between different species suggests convergent evolution of byssus threads in multiple instances, achieving similar performance using different building blocks and structural organization. Indeed, byssus threads based on alpha helical coiled coils observed in the giant clam Tridacna maxima33 are also in line with this hypothesis. In spite of the general mechanical similarities, the stress–strain curves of P. nobilis byssus threads do exhibit a number of unique features compared to Mytilus spp. threads – most notably, the presence of two distinctive yield points, a feature that is also observed in the byssus threads of the mussel species Atrina rigida (Pinnidae) and Modiolus modiolus (Mytilidae).34 Below, we discuss these similarities and differences in the context of the existing knowledge of the P. nobilis thread hierarchical structure9 and in the context of the current X-ray scattering data coupled with in situ mechanical testing.X-ray scattering studies revealed that the previously observed helical organization of the globular proteins9 deforms during the initial linear elastic part of the stress–strain curve of P. nobilis byssus up to about 5% after which the meridional and equatorial SAXS peaks become unmeasurable. Interestingly, the strain of the helix measured on the diffraction pattern is on average 3.3-fold higher than the macroscopic strain of the whole fiber (Fig. 4d). The diffraction pattern shows that the helices are highly aligned along the fiber axis; therefore, in order to compensate for the large helix strain, it seems plausible that there is a stiffer element in series with the helices, which has not been detected thus far and which does not deform as readily as the helix. If these stiff elements are in series with the helices, their length needs to make up at least 70% of the fiber length, whereas the helices would make up the remaining 30%, assuming that the stiff part does not deform at all within the initial linear elastic part of the stress–strain curve. This seems a plausible hypothesis for a first approximation, considering that in Mytilus spp. byssus, the collagen domains deform only by 2% even when threads are extended to 70% macroscopic strain, with the rest of the molecular strain accounted for by hidden length in highly folded cross β-sheet domains.5,13 Currently, the possible identity of this stiff element is unknown, pointing out the necessity of gaining further information about the primary structure of the specific proteins comprising the threads.
Past the yield point, cyclic testing of P. nobilis threads exhibits a clear hysteresis, as well as a concomitant decrease in Young's modulus (Fig. 2a and b) with increasing strain, which indicates that molecular level damage is occurring within the material, which is not immediately recovered. Yield and the subsequent plateau in polymeric materials can have a variety of different molecular level origins as revealed in both synthetic and biological systems. For example, it is worth pointing out the superficial similarity of the behavior of P. nobilis threads during cyclic loading (Fig. 3a) and the characteristic softening observed during cyclic loading of certain rubbery elastomers, which is known as the Mullins effect. While there are many physical and molecular models proposed to explain this behavior, there is not currently a consensus within the field.35 An analogous yield behavior is also observed in Mytilus byssus threads (Fig. 4b)15 and intensive investigation with X-ray diffraction and spectroscopy has indicated that the softening arises from breaking of sacrificial metal coordination bonds and unfolding of hidden length of compact cross beta-sheet protein secondary structure (Fig. 1b and c).5,7
The current findings on P. nobilis threads indicate that the SAXS signal originating from the superprotein helices disappears at the onset of yield, revealing that the hidden length inherent in the twisted structure of the helices is likely completely stretched. Prior to yield, the fiber is largely elastic during cyclic loading, suggesting that the stretching of the helix structure is a reversible process that does not result in bond rupture and that recoiling of the helical building block occurs rapidly, at least with respect to the strain rates utilized in this study. The pseudo yield-plateau thus, must arise from another mechanism, in contrast to our previous hypothesis.9 The observation that the fiber returns to its original length indicates that this damage induces a reduction in mechanical properties but not permanent, plastic deformation. Notably, this damage can be partially healed over time, as both stiffness and hysteresis were partially recovered over a period of ∼20 hours. This is extremely similar to the behavior of Mytilus byssus threads.4,13,15 Thus, it seems plausible that, analogous to Mytilus threads, the yield plateau in P. nobilis byssus results from breakage of reversible sacrificial non-covalent bonds, enabling the unfolding of the globular protein building blocks and elongation of the protein chain, providing hidden length. We provided some insights in support of this hypothesis based on the disappearance of WAXS peaks during stretching (Fig. 6c and d). We posit that the peaks originate from oriented protein secondary structures within the globular proteins, as supported by FTIR spectroscopic measurements of threads (Fig. 6e). Under this assumption, the fact that the peaks decrease in intensity at the onset of yield and completely disappear by the end of the yield plateau is consistent with the mechanical unfolding of the globular proteins comprising the superhelices. As with other mechanically functional globular proteins (e.g. titin36), unraveling of the folded domains is a highly effective mechanism for providing both reversible sacrificial bonding and hidden lengths, resulting in mechanical damping. However, further investigation is required to verify this hypothesis.
Consistent with this hypothesis, the shape of the stress–strain curves from damaged P. nobilis byssus fibers (i.e. those taken well beyond the yield point) begins to resemble an exponential function, characteristic of worm-like chain deformation.37–39 If we assume that the globular proteins require time for refolding, this may indicate that after sacrificial bonds are broken, the hidden length of the unfolded protein subunits extends with no resistance in subsequent cycles, leading to the observed exponential profile. One consequence of the worm-like chain model is that the chains have a very low initial stiffness and a very high final stiffness. Therefore, the increasing content in low initial stiffness worm-like chains arising from unfolded globular domains may explain the decrease of the fiber initial stiffness with increasing strain during cyclic fatigue testing, as well as the increasing slope of the unloading curve (Fig. 2b). Thus, healing in this model would arise ostensibly from the complete refolding of the globular domains and re-formation of sacrificial bonds, which is a time-dependent process.
In order to fully understand the molecular deformation mechanism of P. nobilis byssus, more information must be elucidated about the structure of the different domains and proteins present in the byssus of P. nobilis. Regardless, we posit that hidden length stabilized by sacrificial bonds is a common feature between the byssus of P. nobilis and Mytilus spp. byssus fibers and seems to be essential for the damping behavior, which allows them to survive marine currents or waves shocks and predators. Particularly interesting is also the comparison with the previous tensile tests of A. rigida byssus performed by Pearce and LaBarbera,27 which along with A. pectinata and P. nobilis all belong to the Pinnidae family.40 It was observed that P. nobilis and A. pectinata share a common helical building block,9 and that it is likely to be the case for other bivalves belonging to the same family, such as A. rigida. The fact that the tensile curves of A. rigida and P. nobilis look so similar tends to support this hypothesis. Indeed, they have the same overall shape, with two yield points, the same initial stiffness, although the yield point of A. rigida tensile curves occurs at slightly higher strains than P. nobilis byssus and at an accordingly higher stress.
Conclusion
The combination of X-ray scattering, vibrational spectroscopy and tensile testing enabled investigation of the relationship between the particular building blocks of P. nobilis byssus and its mechanical properties. The stress–strain curves of P. nobilis fibers have an unusual shape presenting two distinct yield points, similar to the byssus of the closely related A. rigida. The first elastic deformation appears to arise from helix stretching, while the post yield plateau appears to originate from breaking of sacrificial bonds, which liberate some hidden length within the tertiary structure of the globular domains. Remarkably, these findings clearly indicate that extremely similar mechanical behaviors to Mytilus spp. byssal threads are achieved by an entirely different mechanism – providing further support for the convergent evolution of mussel byssus in multiple instances. This comparative investigative approach has revealed new mechanistic insights into the tough and self-healing properties of these biopolymeric fibers, which are relevant for bio-inspiration of novel polymeric materials.Conflicts of interest
There are no conflicts to declare.Acknowledgements
We thank the crew of Alchimie-Méditerranée (A. Garcia, C. Dumas, L. Gilletta de St-Joseph) for the collection of Pinna nobilis byssus and members of the Observatoire Océanologique de Villefranche-sur-Mer (R. Lasbleiz, K. Testard, D. Luquet) for their logistic support. We also thank Stefan Siegel and Chenghao Li (Bessy, Adlershof, Berlin) for technical support. This research was supported by the Max Planck Society, the Deutsche Forschungsgemeinschaft (DFG) (HA6369/4-1), the Observatoire des Sciences de l’Univers Terre-Homme-Environnement-Temps-Astronomie (OSU-theta, 2017), the European Marine Biological Resources Center (EMBRC, AAP2017) and the Natural Sciences and Engineering Research Council of Canada (NSERC Discovery Grant RGPIN-2018-05243). Open Access funding provided by the Max Planck Society.References
- C. M. Yonge, On the primitive significance of the byssus in the bivalvia and its effects in evolution, J. Mar. Biol., 1962, 42, 113–125 CrossRef.
- E. Carrington, J. H. Waite, G. Sara and K. P. Sebens, Mussels as a model system for integrative ecomechanics, Annu. Rev. Mar. Sci., 2015, 7, 443–469 CrossRef PubMed.
- E. Bell and J. Gosline, Mechanical design of mussel byssus: material yield enhances attachment strength, J. Exp. Biol., 1996, 199, 1005–1017 Search PubMed.
- E. Carrington and J. Gosline, Mechanical design of mussel byssus: Load cycle and strain rate dependence, Am. Malacol. Bull., 2004, 18, 135–142 Search PubMed.
- A. Reinecke, L. Bertinetti, P. Fratzl and M. J. Harrington, Cooperative behavior of a sacrificial bond network and elastic framework in providing self-healing capacity in mussel byssal threads, J. Struct. Biol., 2016, 196, 329–339 CrossRef CAS PubMed.
- S. Schmidt, A. Reinecke, F. Wojcik, D. Pussak, L. Hartmann and M. J. Harrington, Metal-Mediated Molecular Self-Healing in Histidine-Rich Mussel Peptides, Biomacromolecules, 2014, 15, 1644–1652 CrossRef CAS.
- C. N. Z. Schmitt, Y. Politi, A. Reinecke and M. J. Harrington, Role of sacrificial protein-metal bond exchange in mussel byssal thread self-healing, Biomacromolecules, 2015, 16, 2852–2861 CrossRef CAS.
- J. R. García-March, Aportaciones al conocimiento de la biología de Pinna Nobilis Linneo, 1758 (Mollusca bivalvia) en el litoral mediterráneo ibérico, Universitat de València, 2005.
- D. Pasche, N. Horbelt, F. Marin, S. Motreuil, E. Macias-Sanchez, G. Falini, D. S. Hwang, P. Fratzl and M. J. Harrington, A new twist on sea silk: the peculiar protein ultrastructure of fan shell and pearl oyster byssus, Soft Matter, 2018, 14, 5654–5664 RSC.
- D. E. Fullenkamp, J. G. Rivera, Y. K. Gong, K. H. A. Lau, L. H. He, R. Varshney and P. B. Messersmith, Mussel-inspired silver-releasing antibacterial hydrogels, Biomaterials, 2012, 33, 3783–3791 CrossRef CAS.
- M. J. Harrington, F. Jehle and T. Priemel, Mussel byssus structure-function and fabrication as inspiration for biotechnological production of advanced materials, Biotechnol. J., 2018, 13, 1800133 CrossRef.
- A. Kivelio, P. Dekoninck, M. Perrini, C. E. Brubaker, P. B. Messersmith, E. Mazza, J. Deprest, R. Zimmermann, M. Ehrbar and N. Ochsenbein-Koelble, Mussel mimetic tissue adhesive for fetal membrane repair: initial in vivo investigation in rabbits, Eur. J. Obstet. Gynecol. Reprod. Biol., 2013, 171, 240–245 CrossRef CAS PubMed.
- M. J. Harrington, H. S. Gupta, P. Fratzl and J. H. Waite, Collagen insulated from tensile damage by domains that unfold reversibly: In situ X-ray investigation of mechanical yield and damage repair in the mussel byssus, J. Struct. Biol., 2009, 167, 47–54 CrossRef CAS PubMed.
- M. J. Harrington, A. Masic, N. Holten-Andersen, J. H. Waite and P. Fratzl, Iron-clad fibers: a metal-based biological strategy for hard flexible coatings, Science, 2010, 328, 216–220 CrossRef CAS PubMed.
- M. J. Harrington and J. H. Waite, Holdfast heroics: comparing the molecular and mechanical properties of Mytilus californianus byssal threads, J. Exp. Biol., 2007, 210, 4307–4318 CrossRef CAS PubMed.
- G. Fiorito and F. Gherardi, Prey-handling behaviour of Octopus vulgaris (Mollusca, Cephalopoda) on Bivalve preys, Behav. Processes, 1999, 46, 75–88 CrossRef CAS PubMed.
- J. R. Garcia-March, L. Perez-Rojas and A. M. Garcia-Carrascosa, Influence of hydrodynamic forces on population structure of Pinna nobilis L., 1758 (Mollusca: Bivalvia): The critical combination of drag force, water depth, shell size and orientation, J. Exp. Mar. Biol. Ecol., 2007, 342, 202–212 CrossRef.
- C. C. Brinton, The structure, function, synthesis and genetic control of bacterial pili and a molecular model for DNA and RNA transport in Gram negative bacteria, Trans. N. Y. Acad. Sci., 1965, 27, 1003–1054 CrossRef CAS.
- E. Bullitt and L. Makowski, Structural polymorphism of bacterial adhesion pili, Nature, 1995, 373, 164–167 CrossRef CAS.
- L. Craig, M. E. Pique and J. A. Tainer, Type IV pilus structure and bacterial pathogenicity, Nat. Rev. Microbiol., 2004, 2, 363–378 CrossRef CAS PubMed.
- Z. Bouhlel, B. Genard, N. Ibrahim, E. Carrington, J. M. F. Babarro, A. Lok, A. A. V. Flores, C. Pellerin, R. Tremblay and I. Marcotte, Interspecies comparison of the mechanical properties and biochemical composition of byssal threads, J. Exp. Biol., 2017, 220, 984–994 CrossRef PubMed.
- S. Krauss, T. H. Metzger, P. Fratzl and M. J. Harrington, Self-repair of a biological fiber guided by an ordered elastic framework, Biomacromolecules, 2013, 14, 1520–1528 CrossRef CAS PubMed.
- F. Maeder and M. Halbeisen, Sea-silk: On the trail of a forgotton textile material (Costume material, byssus), Waffen-Und Kostumkunde, 2001, 43, 33–41 Search PubMed.
- O. Paris, C. H. Li, S. Siegel, G. Weseloh, F. Emmerling, H. Riesemeier, A. Erko and P. Fratzl, A new experimental station for simultaneous X-ray microbeam scanning for small- and wide-angle scattering and fluorescence at BESSY II, J. Appl. Crystallogr., 2007, 40, S466–S470 CrossRef CAS.
- G. Benecke, W. Wagermaier, C. H. Li, M. Schwartzkopf, G. Flucke, R. Hoerth, I. Zizak, M. Burghammer, E. Metwalli, P. Muller-Buschbaum, M. Trebbin, S. Forster, O. Paris, S. V. Roth and P. Fratzl, A customizable software for fast reduction and analysis of large X-ray scattering data sets: applications of the new DPDAK package to small-angle X-ray scattering and grazing-incidence small-angle X-ray scattering, J. Appl. Crystallogr., 2014, 47, 1797–1803 CrossRef CAS PubMed.
- F. Lucas, J. T. B. Shaw and S. G. Smith, The chemical constitution of some silk fibroins and its bearing on their physical properties, J. Text. Inst., Trans., 1955, 46, T440–T452 CrossRef.
- T. Pearce and M. LaBarbera, Biomechanics of byssal threads outside the Mytilidae: Atrina rigida and Ctenoides mitis, J. Exp. Biol., 2009, 212, 1449–1454 CrossRef PubMed.
- L. F. Drummy, B. L. Farmer and R. R. Naik, Correlation of the β-sheet crystal size in silk fibers with the protein amino acid sequence, Soft Matter, 2007, 3, 877–882 RSC.
- L. Kreplak, J. Doucet, P. Dumas and F. Briki, New aspects of the alpha-helix to beta-sheet transition in stretched hard alpha-keratin fibers, Biophys. J., 2004, 87, 640–647 CrossRef CAS PubMed.
- R. E. Marsh, R. B. Corey and L. Pauling, An investigation of the structure of silk fibroin, Biochim. Biophys. Acta, 1955, 16, 1–34 CrossRef CAS.
- J. T. Pelton and L. R. McLean, Spectroscopic Methods for Analysis of Protein Secondary Structure, Anal. Biochem., 2000, 277, 167–176 CrossRef CAS PubMed.
- H. Yang, S. Yang, J. Kong, A. Dong and S. Yu, Obtaining information about protein secondary structures in aqueous solution using Fourier transform IR spectroscopy, Nat. Protoc., 2015, 10, 382–396 CrossRef CAS PubMed.
- A. Miserez, Y. Li, J. Cagnon, J. C. Weaver and J. H. Waite, Four-stranded coiled-coil elastic protein in the byssus of the giant clam, Tridacna maxima, Biomacromolecules, 2012, 13, 332–341 CrossRef CAS PubMed.
- S. L. Brazee and E. Carrington, Interspecific Comparison of the Mechanical Properties of Mussel Byssus, Biol. Bull., 2006, 211, 263–274 CrossRef PubMed.
- J. Diani, B. Fayolle and P. Gilormini, A review on the Mullins effect, Eur. Polym. J., 2009, 45, 601–612 CrossRef CAS.
- H. Li and J. M. Fernandez, Mechanical design of the first proximal Ig domain of human cardiac titin revealed by single molecule force spectroscopy, J. Mol. Biol., 2003, 334, 75–86 CrossRef CAS PubMed.
- M. J. Harrington, S. S. Wasko, A. Masic, H. S. Gupta, F. D. Fischer and P. Fratzl, Pseudoelastic behavior of a natural elastomeric proteinaceous material is achieved via reversible changes in backbone conformation, J. R. Soc., Interface, 2012, 9, 2911–2922 CrossRef CAS PubMed.
- A. Janshoff, M. Neitzert, Y. Oberdorfer and H. Fuchs, Force spectroscopy of molecular systems – Single molecule spectroscopy of polymers and biomolecules, Angew. Chem., Int. Ed., 2000, 39, 3213–3237 Search PubMed.
- W. Zhang and X. Zhang, Single molecule mechanochemistry of macromolecules, Prog. Polym. Sci., 2003, 28, 1271–1295 CrossRef CAS.
- P. Bouchet, J. P. Rocroi, R. Bieler, J. G. Carter and E. V. Coan, Nomenclator of bivalve families with a classification of bivalve families, Malacologia, 2010, 52, 4–172 CrossRef.
| This journal is © The Royal Society of Chemistry 2019 |