 Open Access Article
Poly(sodium acrylate) hydrogels: synthesis of various network architectures, local molecular dynamics, salt partitioning, desalination and simulation†
Lukas
Arens
 a,
Dennis
Barther
a,
Jonas
Landsgesell
a,
Dennis
Barther
a,
Jonas
Landsgesell
 b,
Christian
Holm
 b and
Manfred
Wilhelm
*a
aKarlsruhe Institute of Technology (KIT), Institute for Technical Chemistry and Polymer Chemistry (ITCP), Engesserstraße 18, 76131 Karlsruhe, Germany. E-mail: manfred.wilhelm@kit.edu
bUniversity of Stuttgart, Institute for Computational Physics (ICP), Allmandring 3, 70049 Stuttgart, Germany
First published on 14th November 2019
Abstract
Various poly(sodium acrylate) hydrogels with different architectures, such as single networks, interpenetrating double networks and surface crosslinked hydrogels, are synthesized with a systematic change in their degree of crosslinking. The influence of these 3D structures on the absorbency of aqueous NaCl solutions is investigated. The local polymer mobility in water is probed in the form of transverse (T2) 1H-relaxation at a low field, which allowed confirming the structural aspects of the studied network topologies. Salt partitioning between the gel and the surrounding solution phase in NaCl solutions with an initial salt concentration of c0 = 0.017–0.60 mol L−1 (≙1–35 g L−1) is investigated. The data are compared with an idealized mean-field Donnan model, which fit the experimental findings only under the assumption of a drastically reduced effective charge density of feff ≈ 25 mol% independent of the hydrogel used. The unequal salt distribution allows desalination of salt water by applying an external pressure to a swollen hydrogel to recover its water which has a lower salinity. The specific energy needed to desalinate 1 m3 was estimated to be 6–18 kW h m−3. This value decreases with a lower degree of swelling independent of the network topology. Besides the experiments, simulations based on a Poisson–Boltzmann mean-field model and MD simulations are performed to determine the degree of swelling and salt partitioning as a function of c0 for different hydrogels. Both simulations describe qualitatively the experimental data, where deviations can be ascribed to model simplifications and the imperfect structure of the hydrogels synthesized via free radical polymerization.
1 Introduction
Polyelectrolyte hydrogels are a special class of materials with unique properties. Such charged polymer networks exhibit a high uptake of water or aqueous solutions that can exceed several hundred times their own weight. This superabsorbent behavior renders hydrogels interesting for a large variety of applications.1,2 The largest amount of hydrogels produced is used in hygiene products, like disposable diapers or sanitary napkins. However, superabsorbers are also found in many other products, such as additives for drilling fluids or concrete, as sealings and underwater-cable insulations, for food packaging, and in agriculture.3More recent studies demonstrated that hydrogels can be applied to recover energy from salt gradients4–6 or to desalinate saltwater in a forward osmosis process. In the latter application, the polymer networks are used as drawing agents, which are regenerated (deswollen) by pressure or temperature.7–9 While those examples still use a semi-permeable membrane as a separation agent, we proved in our group that charges along the polymer chains can be directly used for salt separation in a membrane-free forward osmosis process. There, the polyelectrolyte hydrogels act as both the drawing and the separation agent, simultaneously.10–12
The physical reason for salt separation is based on the presence of charges along the polymer chains in the polyelectrolyte network. If a dry, charged polyelectrolyte is placed in a brine solution, the hydrogel will swell, while the charges inside the polymer cause an unequal distribution of dissolved ions between the gel and the solution phase. The larger fraction of mobile salt ions remains in the supernatant phase, which can be described in terms of the Donnan membrane equilibrium.13–15 This unequal salt distribution was successfully used to desalinate saltwater in a three step process, which is described in more detail in previous work:10–12 (i) Mixing of dry polymer particles with saline feedwater, (ii) removal of the supernatant with the enriched salt concentration and (iii) applying an external pressure to recover the water with a decreased salinity.
This new method for a desalination process based on inexpensive polymer hydrogels as separation agents is of great interest due to the rising scarcity of freshwater. The shortage of potable water is a known problem in many parts of the world and will increase further in future due to climate change, increasing standards of living and population growth.16
In a previous work, the proof of principle for the desalination method was demonstrated with chemically crosslinked hydrogels based on partially neutralized poly(acrylic acid).10 In addition to commercial samples, polyelectrolytes were synthesized by free radical polymerization to vary systematically chemical parameters, such as the degree of neutralization (charge fraction f) and the degree of crosslinking (DC) in the range of f = 0–95 mol% and DC = 0.05–5 mol%, respectively.11 Additionally, process parameters, such as the swelling time, the applied pressure profile during the hydrogel compression and the initial NaCl concentration, were studied. The specific energy, defined as the energy needed to obtain 1 m3 of potable water from sea water (with a typical concentration of 35 g L−1 NaCl ≙ 0.6 mol L−1), was estimated. The best value found so far has been 8.9 kW h m−3, when fully charged poly(sodium acrylate) (PSA) with a high degree of crosslinking of 5 mol% was used.12
Other groups, such as Fan et al. and Ali et al., experimentally investigated PSA copolymer hydrogels, where further monomers like 2-hydroxyethyl methacrylate17 or thermally responsive N-isopropylacrylamide18 were incorporated into the polyelectrolyte network. With the latter example, the partially desalinated water inside the hydrogel could be recovered by applying a temperature of 50 °C instead of pressure as an external stimulus.
Accurate predictions of the swelling and elastic responses of polyelectrolyte gels are needed for optimizing gel properties in order to tailor gels for their specific application, such as the proposed desalination process. This is a complicated task which goes beyond analytical approaches.15,19–26 Coarse-grained polyelectrolyte network models have been employed previously in molecular dynamics (MD) simulations and give microscopic insights into the behavior of polymer gels.27–36 As a drawback, these MD simulations remain computationally expensive due to the many involved particles and the slow relaxation times. Therefore, in the last few years there has been an increased scientific interest in developing computationally fast mean-field models capable of predicting swelling equilibria.23,35–37 Such mean-field approximations were recently used to investigate the salt partitioning of polyelectrolyte hydrogels.15,38,39 Desalination cycles, qualitatively similar to the applied experiments here, were studied with the Katchalsky model and the energy costs were estimated to be 1.5–3 kW h m−3, which is close to the theoretical limit of 0.7–1 kW h m−3.39
Landsgesell et al. recently developed a Poisson–Boltzmann (PB) mean-field model for predicting gel swelling equilibria in aqueous solutions.40,41 This PB mean-field model is also used in this publication to predict properties such as salt partitioning and the degree of swelling, which are then compared to experimental findings.
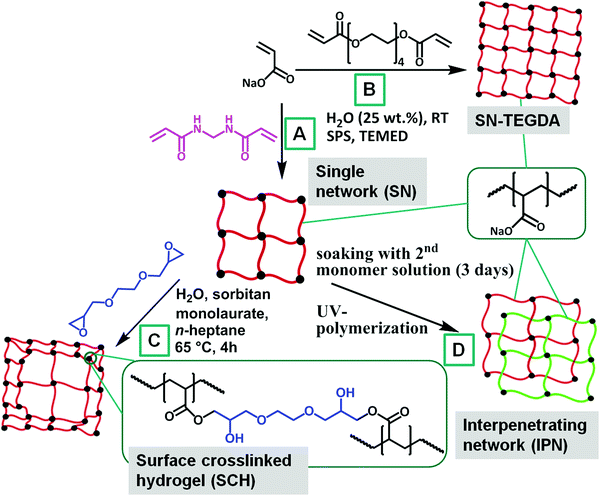
The main question of the present paper is how the network architecture influences the salt partitioning and the desalination efficiency. The following tasks are performed to answer this question. First, different hydrogel architectures such as statistically crosslinked single hydrogels, core–shell particles and interpenetrating networks with a varying degree of crosslinking are synthesized using free radical polymerization. These network types are chosen due to their relevance. The single networks are widely used in industry because of their simple synthesis, while core–shell particles are often applied in hygiene products like disposable diapers to address the gel-blocking problem and to increase the absorbency under load (AUL).2 In recent years, interpenetrating networks (IPNs) that consist of two individual polymer networks, which are solely attached by intermolecular network entanglements, have received much attention.42 Several publications have proven that the specific double network structure can drastically improve the mechanical properties of hydrogels.43–45
Second, the degree of swelling in deionized water and NaCl solutions is studied. This allows calculating the sodium acrylate concentration in swollen hydrogels. Furthermore, it enables us to perform the subsequent salt partitioning and desalination experiments under defined conditions using a fixed ratio between the gel and the supernatant phase. Third, 1H-NMR is used in the time-domain at a low field to probe the polymer mobility in the network via transverse relaxation. The T2-relaxation allows drawing conclusions about the topology of the polyelectrolyte hydrogels itself, as demonstrated in a previous work.46 Hence, polymer mobilities can be assigned to the network architectures to confirm the synthetic procedures. Fourth, the salt rejection of various hydrogels is studied in aqueous NaCl solutions in the range of 0.017–0.60 mol L−1 to see how the charge density and charge distribution influence the salt partitioning. These results are compared with theoretical values from the simple Donnan theory. Furthermore, simulations are performed which are based on molecular dynamics (MD) and on the PB mean-field model, respectively. The network parameters of the simulated hydrogels are chosen to resemble the synthesized samples. This enables us to broaden the basis for discussion since previous publications supposed that the predictive power of the Donnan model with respect to salt partitioning is limited as electrostatic interactions are not explicitly modeled.35 In the last part of this paper, water with a reduced salinity is recovered from the hydrogels by applying an external pressure. The desalination efficiency in terms of the specific energy is estimated. This allows for the discussion on how the network architecture, i.e., the charge distribution and density, influences the desalination process to further improve the efficiency.
2 Experimental details
2.1 Materials
Acrylic acid (AA, 99%+, Merck) and tetra(ethylene glycol) diacrylate (TEGDA, technical grade, Sigma-Aldrich) were freshly distilled prior to the synthesis at reduced pressure. Sodium hydroxide (NaOH, 33 wt% in water, AnalaR Normapur), n-heptane (99%+, Carl Roth), N,N,N′,N′-tetramethylethylenediamine (TEMED, 99.5%, Sigma-Aldrich), sodium persulfate (SPS, 98%+, Sigma-Aldrich), sodium chloride (NaCl, 99%+, Acros Organics), 2,2′-azobis(amidinopropane) dihydrochloride (V50, 98%, Acros Organics), sorbitan monolaurate (technical grade, Alfa Aesar), ethylene glycol diglycidyl ether (technical grade, TCI Chemicals), N,N′-methylenebis(acrylamide) (MBA, 99%, Sigma-Aldrich) and deuterium oxide (D2O, 99.9%+ D, Sigma-Aldrich) were all used as received.2.2 Synthesis
 | (1) |
| Sample | DC [mol%] (1st network) | P [vol%] (shell thickness) | DC [mol%] (2nd network) | Crosslinker |
|---|---|---|---|---|
| SN-DC03 | 0.3 | 0 | — | MBA |
| SN-DC1 | 1 | 0 | — | MBA |
| SN-DC5 | 5 | 0 | — | MBA |
| SN-DC1-TEGDA | 1 | 0 | — | TEGDA |
| SN-DC5-TEGDA | 5 | 0 | — | TEGDA |
| SN-DC10-TEGDA | 10 | 0 | — | TEGDA |
| SN-DC20-TEGDA | 20 | 0 | — | TEGDA |
| SN-DC30-TEGDA | 30 | 0 | — | TEGDA |
| SCH-DC03-P1 | 0.3 | 1 | — | MBA/EGDE |
| SCH-DC03-P10 | 0.3 | 10 | — | MBA/EGDE |
| SCH-DC1-P1 | 1 | 1 | — | MBA/EGDE |
| SCH-DC1-P10 | 1 | 10 | — | MBA/EGDE |
| SCH-DC5-P1 | 5 | 1 | — | MBA/EGDE |
| SCH-DC5-P10 | 5 | 10 | — | MBA/EGDE |
| LB1110 | Luquasorb B1110 (BASF, Germany), surface crosslinked PSA | |||
| IPN-DC03-i-DC1 | 0.3 | 0 | 1 | MBA/MBA |
| IPN-DC1-i-DC03 | 1 | 0 | 0.3 | MBA/MBA |
| IPN-DC1-i-DC1 | 1 | 0 | 1 | MBA/MBA |
| IPN-DC1-i-DC5 | 1 | 0 | 5 | MBA/MBA |
| IPN-DC5-i-DC1 | 5 | 0 | 1 | MBA/MBA |
| IPN-DC5-i-DC5 | 5 | 0 | 5 | MBA/MBA |
 | (2) |
 | (3) |
2.3 Characterization methods
 | (4) |
Each hydrogel was measured three times in deionized water and in aqueous 1 wt% (0.17 mol L−1) NaCl solution, respectively. The three SN hydrogels and the interpenetrating double network IPN-DC1-i-DC1 were additionally studied in a 0.1 wt% (0.017 mol L−1), a 0.3 wt% (0.05 mol L−1) and a 3.5 wt% (0.60 mol L−1) NaCl solution.
![[thin space (1/6-em)]](https://www.rsc.org/images/entities/char_2009.gif) :
:![[thin space (1/6-em)]](https://www.rsc.org/images/entities/char_2009.gif) 9 and transferred to the bottom of a 10 mm NMR glass tube.
9 and transferred to the bottom of a 10 mm NMR glass tube.
The T2-relaxation times were recorded using the combination of a magic sandwich echo (MSE) and CPMG/XY16 pulse sequences with three different echo times (see Table 2).49 The modification of the CPMG pulse sequence in the form of the XY16-phase cycle was necessary to avoid the spin-locking effect, as described in previous publications.50,51 The different echo times were required, since the transverse relaxation of hydrogels spans over 6 decades.46 The early relaxation behavior was thus recorded by MSE, while the later parts were measured with three CPMG/XY16 experiments by increasing the echo time and by introducing non-acquired echoes. The results from all four experiments were collected into one data set, the contribution of the solvent was subtracted and the data renormalized, as shown in Fig. 2a and in more detail in a previous publication.46
| Parameter | CPMG/XY16 | MSE | ||
|---|---|---|---|---|
| Short delay | Medium delay | Long delay | ||
| ns [—] | 256 | 128 | 128 | 128 |
| ds [—] | 4 | 4 | 4 | 4 |
| τ E [ms] | 0.04 | 1 | 1 | — |
| de [ms] | 0 | 0 | 15 | — |
| rd [s] | 20 | 20 | 20 | 20 |
| ne [—] | 256 | 256 | 256 | — |
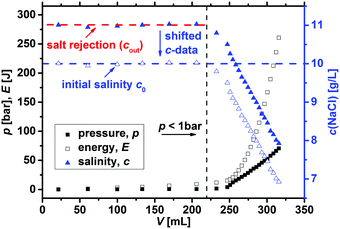
The desalination experiments are conducted under controlled conditions, where the chamber volume is equally filled by the supernatant and the gel phase (Vsupernatant = Vgel). In order to determine the needed amount of dry polymer to achieve this volume ratio, swelling experiments in the respective salt solution were performed in advance. A constant volume of the supernatant phase and swollen gel was chosen due to the fixed size of the press chamber of about 400 mL. Consequently, the mass of the dry polymer mp and the salt solution ms depends on the degree of swelling at equilibrium Qeq in the 1 wt% NaCl solution and were calculated under the assumption of a density of 1 g mL−1 by eqn (5) and (6).
 | (5) |
| ms = 400 − mp [g] | (6) |
The mixture was stirred overnight and eventually transferred into the press chamber. The actual desalination experiment was started by lowering the piston to apply a pressure below 1 bar to first remove excess solution until the flux decreased noticeably within 20 min. Then, a linear pressure increase of 60 bar per h to a maximum of 80 bar, or until failure of the experiment (e.g., by pushing the hydrogel through the sieve elements), was applied. Meanwhile, the eluate was collected in fractions of 3–10 mL, whose salt content was analyzed by conductivity measurements (SevenMulti, Mettler Toledo, Gießen, Germany) after an appropriate calibration.11
 | (7) |
The expended energy E (open black squares in Fig. 3) and the removed amount of salt Δm(NaCl) are both considered to analyze the desalination efficiency, as discussed in a previous work.12 The expended energy is calculated by the numerical integration of the pressure–volume work
 | (8) |
 | (9) |
The ratio of expended energy to removed salt mass, expressed by the parameter κ in eqn (10), can be used as a criterion to quantify the desalination efficiency.12
 | (10) |
 | (11) |
For all the other samples, the desalination cycle was performed only once, whereas the salt rejection SR was measured (by analyzing the conductivity of the supernatant) three times in individual experiments using the same ratio of Vsupernatant = Vgel, but a smaller volume (ms + mp = 40 g). The resulting uncertainties of the salt rejection are shown in Table 3 as well as in Fig. 11 and 12.
| Sample | Q eq (DI water) [g g−1] | Q eq (1 wt% NaCl) [g g−1] | SR [wt%] | E m3,min [kW h m−3] |
|---|---|---|---|---|
| SN-DC03 | 372.6 ± 10.7 | 50.8 ± 0.7 | 8.6 ± 1.8 | 18.4 |
| SN-DC1 | 92.4 ± 0.3 | 25.7 ± 0.3 | 11.0 ± 0.9 | 14.7 ± 0.9 |
| SN-DC5 | 22.4 ± 1.7 | 11.8 ± 0.1 | 23.2 ± 0.9 | 9.1 |
| SN-DC1-TEGDA | 123.0 ± 9.1 | 33.6 ± 0.3 | 9.8 ± 2.4 | 18.1 |
| SN-DC5-TEGDA | 29.8 ± 1.5 | 15.9 ± 1.2 | 19.6 ± 0.8 | 9.2 |
| SN-DC10-TEGDA | 17.7 ± 1.0 | 10.4 ± 0.9 | 23.3 ± 0.7 | 7.9 |
| SN-DC20-TEGDA | 17.0 ± 0.9 | 10.3 ± 0.0 | 22.8 ± 0.3 | 7.1 |
| SN-DC30-TEGDA | 13.9 ± 0.7 | 8.8 ± 0.0 | 19.5 ± 0.8 | 7.9 |
| SCH-DC03-P1 | 218.7 ± 10.9 | 40.2 ± 2.0 | 7.6 ± 0.5 | 15.8 |
| SCH-DC03-P10 | 162.7 ± 8.2 | 30.1 ± 1.5 | 10.6 ± 3.0 | 16.6 |
| SCH-DC1-P1 | 60.5 ± 3.0 | 23.1 ± 1.2 | 13.9 ± 1.0 | 13.3 |
| SCH-DC1-P10 | 26.8 ± 1.3 | 14.6 ± 0.7 | 20.6. ± 0.6 | 14.3 |
| SCH-DC5-P1 | 20.5 ± 2.0 | 11.8 ± 1.4 | 21.0 ± 3.3 | 8.1 |
| SCH-DC5-P10 | 11.0 ± 2.6 | 7.5 ± 3.7 | 23.5 ± 2.1 | — |
| LB1110 | 115.7 ± 7.1 | 22.0 ± 1.1 | 18.6 ± 3.0 | 11.3 |
| IPN-DC03-i-DC1 | 68.3 ± 5.4 | 25.1 ± 1.3 | 14.7 ± 1.4 | 12.4 |
| IPN-DC1-i-DC03 | 55.4 ± 0.4 | 21.7 ± 1.1 | 18.9 ± 2.5 | 12.3 |
| IPN-DC1-i-DC1 | 43.6 ± 1.4 | 21.0 ± 1.1 | 15.8 ± 1.7 | 12.7 |
| IPN-DC1-i-DC5 | 37.1 ± 1.1 | 15.7 ± 0.8 | 19.1 ± 1.1 | 8.5 |
| IPN-DC5-i-DC1 | 11.9 ± 0.1 | 8.0 ± 0.4 | 23.8 ± 0.4 | 5.6 |
| IPN-DC5-i-DC5 | 11.5 ± 0.1 | 8.4 ± 0.4 | 25.7 ± 1.2 | 5.9 |
2.4 Simulations
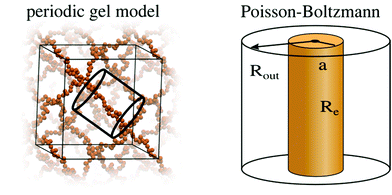 | ||
| Fig. 4 Schematic representation of the simplifications involved in the PB cell model. The many chain problem of negatively charged periodic gel is simplified to a single chain problem, which is then further simplified to a density based PB cell model, as described in previous work.40,41 | ||
The periodic gel model and the PB cell model are discussed in detail in previous work35,40,41 and in the ESI.† They allow the prediction of the swelling equilibria of gels, given the following input parameters: the number of monomers per chain N, the charge fraction f and the salt concentration of the solution which is in contact with the gel cout. Solving the models, p–V curves are obtained and the swelling equilibrium is found where the pressure of the gel is equal to the pressure of the bath. It should be noted that the MD and PB simulations are performed in the presence of an infinite reservoir. From these simulations we obtain salt concentrations inside the gel and an equilibrium volume. In the next step, a simplifying assumption is made that the concentrations in the gel and the reservoir do not change, if the size of the reservoir is reduced to the size of the gel (i.e., they become finite). This simple ansatz neglects any possible finite-size and gel/solution interphase related effects.
The salt rejection is then calculated by
 | (12) |
The initial salt concentration is connected to the salt concentrations in the supernatant and the gel phase after swelling via conservation of the total number of salt particles Ntot. At equal volume V/2 of the supernatant phase and the gel phase, the salt pairs which were in the initial salt solution of concentration c0 need to be conserved (see ESI† for more details). This can be expressed via
 | (13) |
 | (14) |
![[r with combining right harpoon above (vector)]](https://www.rsc.org/images/entities/i_char_0072_20d1.gif) )〉V can be obtained. Therefore the salt rejection is calculated via
)〉V can be obtained. Therefore the salt rejection is calculated via | (15) |
It should be noted that the PB cell model has the salt concentration of the supernatant phase cout as input and the salt concentration in the gel cin as output, whereas the experiments use the initial salt concentration c0 as input. In order to compare both results, cout is varied in the simulations until c0, which is calculated by eqn (14), is conserved at each point in the p–V curve. The swelling equilibrium is then found at the point where the pressure of the supernatant phase equals the pressure of the gel.40,41
For better comparison with experimental results we introduce a mapping from the predicted end-to-end distances in swelling equilibrium to the mass of the solution in the gel. This is important since the experiments conducted report the degree of swelling as a fraction of the mass of the water in the swollen state divided by the mass of the dry state  . This mapping however requires some modeling assumptions. First of all, the mass of the dry state is determined by the number of monomers N and the molar mass of the monomers MSA:
| mp = MSA × N, | (16) |
The mass of the water in the swollen gel ms(gel) is determined via its volume and an approximate density which is close to that of pure water:
| ms(gel) = V(N)ρw, | (17) |
 is the volume of the gel predicted by the PB cell model. From geometrical considerations for a fully stretched diamond like gel, we obtain the parameter
  in the case of a single network,35 or
  in the case of a double network.
 in differently concentrated NaCl solutions by finding the equilibrium volume V(N).
3 Results and discussion
3.1 Degree of swelling
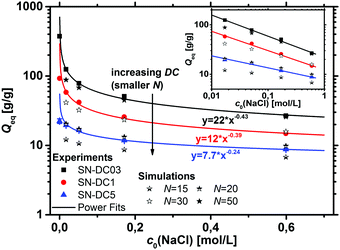
The absorption of water or aqueous solution is probably the most important characteristic of a polyelectrolyte hydrogel. Upon swelling, the elastic chains extend, whereas the crosslinks prevent a complete dissolving of the polymer. The degrees of swelling measured at equilibrium in deionized water and a 1 wt% NaCl solution are displayed in Table 3 for the various hydrogel samples.The water absorbency decreases monotonically with an increasing DC, since a higher crosslinking density leads to more constraints in the network and smaller pores of the hydrogel.1,2,11,57–59 Furthermore, Qeq decreases with higher NaCl concentrations of the aqueous solution.35,40,60 The higher salinity reduces the driving force for swelling, as the osmotic pressure difference between the hydrogel and the surrounding solution decreases. The salt dependency on Qeq is shown for the different SN hydrogels in Fig. 6 and can be well described using power law fits of the form Qeq = A × c0(NaCl)b. This power law dependence on the initial salt concentration was also described previously by Horkay et al. for a weakly crosslinked PSA hydrogel (DC ≈ 0.06 mol%), where b = −0.47 ± 0.03. They argued that b is close to −0.5, which resembles the variation of the electrostatic screening length λD ∼ lB × c0(NaCl)−0.5, where lB is the Bjerrum length.61,62 This argument is however valid only for long linear polyelectrolytes and thus, in the present paper both parameters, A and b, decrease further with a higher DC (see Fig. 6). The results from the simulations based on the PB cell model are shown for different numbers of sodium acrylate monomers per chain N in the same graph.
It can be seen that the salt dependency of the simulation data is quite well described, resulting also in straight lines in the log–log plot and values for Qeq and b in the same order of magnitude as the experimental data. However, the deviation between simulation and experiment seems to get larger for lower salinities and a lower DC (i.e., a larger N). For a quantitative comparison, the synthetic quantity DC has to be translated into an average number of SA units per elastic chain N. This relationship can be expressed via63,64
 | (18) |
 . However, the polyelectrolyte hydrogels are very hydrophilic and contain typically about 10 wt% of moisture. In the simulations, the degree of swelling is calculated from the end-to-end distance and under the assumption that mp = m(N) neglecting the molecular weight of the crosslinker MBA and any residual water. (ii) The simulations are based on a monodisperse distribution of the elastic chain length, where no actual crosslinker is present. However, the samples were synthesized by free radical polymerization and have thus a broad distribution of the number of monomer units between two crosslinking points.67,68 Simulation results indicate that a broader distribution of elastic chain lengths leads to a higher degree of swelling when an asymmetric distribution with a positive skewness in analogy to a Flory–Schulz distribution is applied.41 (iii) Different side reactions like chain transfer lead to additional chemical crosslinking points reducing the effective chain length of the gels. (iv) Intermolecular entanglements between elastic chains can act as additional non-fixed crosslinking points, reducing further the effective number of monomer units per elastic chain. This effect becomes more pronounced, if more monomers are present between two crosslinking points. (v) In the simulations, the dielectric constant of water was assumed to be constant at εr = 80. However, the dielectric constant changes with the salt concentration and especially with the degree of swelling, as the electric environment in a charged hydrogel depends strongly on its charge density. Thus, each data point has a slightly different dielectric constant depending on Qeq and the initial salt concentration. Furthermore, water molecules in the hydrogel might orient close to the charges, which results in different local dielectric constants on a microscopic level. As these dependencies are not straightforward to predict, the primitive restricted model was applied as an approximation and the dielectric constant was simply kept constant. All these reasons contribute to the shown deviation between experimental and simulation data, especially if the elastic chain is longer.
Highly crosslinked hydrogels with a DC > 5 mol% were synthesized using the more soluble crosslinker TEGDA instead of MBA. At the same DC (1 mol% and 5 mol%), Qeq was larger when TEGDA was used (see Table 3). This could be caused by a reduced crosslinker efficiency, as the longer TEGDA molecule might easily form rings instead of effective crosslinks. The highly crosslinked PSA-TEGDA samples with a DC ≥ 10 mol% exhibit only small changes in their water absorbency and no significant differences in their mechanical moduli (not shown). This can be explained by the rather long TEGDA crosslinking points: the contour length of one TEGDA molecule matches the length of 8 sodium acrylate monomer units. At a very high DC (e.g., >12.5 mol% assuming a crosslinker efficiency of 50%), the length of the crosslinker is longer than the actual elastic chain length resulting in less charged (less hydrophilic), but no looser, networks.
The degree of swelling of the surface crosslinked samples decreases with the thickness of the shell as expected. The core is still able to absorb high amounts of water, whereas the shell is more limited. Thus, the overall absorbency of the hydrogel decreases with the thickness of the shell (see Table 3).
The water uptake of the IPNs decreases compared to the precursor single networks (SN), since the incorporation of the second polymer causes more constraints of the elastic chains due to additional network entanglements. The differences between Qeq(IPN) and the corresponding Qeq(SN) are more pronounced when the DC of the second network is larger than the DC of the first network (see Table 3). It should be noted that the amount of the second polymer network depends on the solution uptake of the precursor hydrogel, as a weakly crosslinked hydrogel is able to take up more of the second monomer solution. Consequently, the changes in the absorbencies between IPN and SN are less pronounced, when the first network is already highly crosslinked. Additionally, the order of the synthesis is thus crucial for the macroscopic properties, i.e., sample IPN-DC1-i-DC5 differs from sample IPN-DC5-i-DC1.
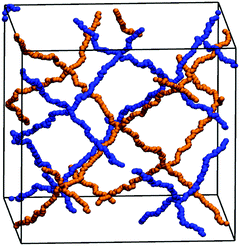
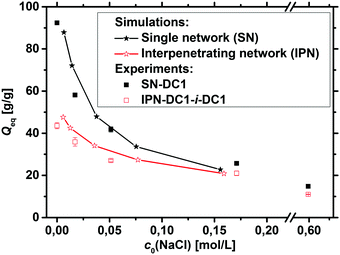
In addition to the experimental data, the degree of swelling of a fully charged SN and an IPN was studied by MD simulations in differently concentrated NaCl solutions. The MD simulations were used instead of the PB cell model since they can be applied straightforwardly to describe IPNs as shown in a previous work.56 The SN is made of a PSA hydrogel with an elastic chain length of N = 40, whereas the IPN consists of two fully charged PSA hydrogels with the same N of 40, as seen in the snapshot in Fig. 5. At low NaCl concentrations, it is found that the single network can swell up to almost two times more than the double network, whereas the degrees of swelling Qeq converge for both network types at higher salt concentrations (compare Fig. 7). In the IPN, the freedom of movement of the nodes of the second network is restricted by the first network, as seen in Fig. 5. Therefore, temporary entanglements between both networks may occur. Thus, the presence of more constraints in the double network reduces the water uptake, where the findings of the absorbency are qualitatively in good agreement with the experimental data. The samples SN-DC1 and IPN-DC1-i-DC1 resemble the simulated hydrogels: both networks have the same degree of crosslinking, they are fully charged, and the molar ratio of the first to the second network in the IPN is about 1![[thin space (1/6-em)]](https://www.rsc.org/images/entities/char_2009.gif) :
:![[thin space (1/6-em)]](https://www.rsc.org/images/entities/char_2009.gif) 1. The difference of the water absorbency is very pronounced in deionized water (the IPN swells about a factor of 2.5 less), while the degrees of swelling become very similar in solutions of higher concentration, as seen in Fig. 7.
1. The difference of the water absorbency is very pronounced in deionized water (the IPN swells about a factor of 2.5 less), while the degrees of swelling become very similar in solutions of higher concentration, as seen in Fig. 7.
3.2 T 2-Relaxation behavior
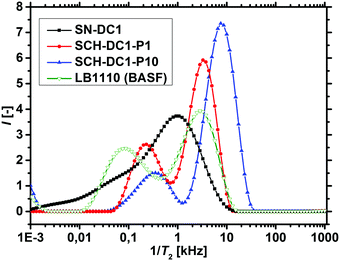
1H-NMR-relaxometry measures the polymer mobility by probing the T2-relaxation rates of the hydrogels. This technique allows gaining further insights into the network heterogeneity as indirect information about the mesh beyond a mean value is accessible. The T2-relaxation behavior of PSA hydrogels with various different synthetic parameters was previously investigated:46 in general, more highly crosslinked samples with more constraints in the network have a reduced mobility of the chain segments. The hydrogels relax faster and the T2−1-distributions are accordingly shifted to higher relaxation rates.In a previous work, 1H-NMR in the time domain was successfully used at a low field to probe also the introduced heterogeneity of the local polymer mobility in the commercial surface crosslinked sample LB1110 from BASF (see green triangles in Fig. 8).46 This sample has two specific peaks: one at smaller relaxation rates (T2−1 = 0.01–0.5 kHz), which can be assigned to the more flexible core and one peak at higher relaxation rates of T2−1 = 0.5–10 kHz, corresponding to the less mobile shell. However, in the present work additionally self-synthesized samples are analyzed before and after the crosslinking procedure to obtain more detailed information about the surface crosslinking itself (see Fig. 8). The single network SN-DC1 shows one broad distribution (see black squares), whereas the corresponding surface crosslinked samples PSA-DC1-P1 (red spheres) and PSA-DC1-P10 (blue triangles) show two specific peaks, which can be related to the flexible core (T2−1 = 0.1–1 kHz) and the more restricted shell (T2−1 = 1–10 kHz). An increase of the penetrated area P reduces the peak intensity at smaller rates (core) and shifts the second peak (shell) to even higher rates, indicating a larger and stiffer shell with a lower mobility.
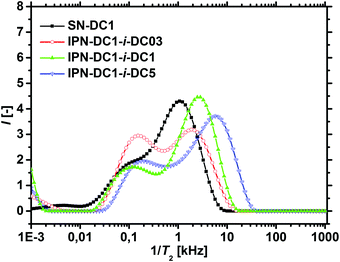
The T2−1-distributions of the IPNs, where the percursor polymer was 1 mol% crosslinked (SN-DC1) are displayed in Fig. 9. All double networks have an increased hetereogeinity in their distributions compared to the single network (black squares). When the DC of the second network is lower than the DC of the first network (IPN-DC1-i-DC03 in red spheres), a higher fraction of smaller T2 rates is observable, as the second network has on average more monomer units between two crosslinking points and is thus more mobile. In contrast, an increased peak at higher T2−1 values is obtained when the second network has a higher DC (IPN-DC1-i-DC5 in blue triangles) related to the lower mobility of the more densely crosslinked hydrogel. However, higher relaxation rates (relative to the single precursor network) are present in all IPNs, even if the second network has a lower or the same crosslinking density (IPN-DC1-i-DC1 in green triangles). This can be assigend to the additional entanglements between the networks which cause more constraints and thus, lead in general to a lower mobility.
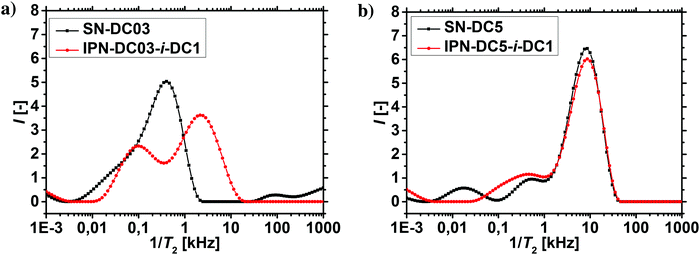
The results of the 1H-NMR-relaxometry are able to reveal the increased heterogeneity of the polymer mobility, which can be related to the interpenetrating double network structure. The increased heterogeneity is more pronounced in hydrogels, where the first network was less densely crosslinked, since more of the second network got incorporated, as already discussed in the previous section. Therefore, the changes in the relaxation behavior are also stronger for these samples, as shown in Fig. 10a and b. In particular, sample SN-DC5 is already highly crosslinked and immobile, where the incorporation of the second network with a DC of 1 mol% barely introduces any more constraints.
3.3 Salt partitioning
In previous work, it was found that a higher degree of crosslinking leads to an increasing salt rejection, since these gels have a higher charge density in their swollen state.11,12 The salt partitioning of the different networks in this paper is summarized in Table 3, where SR increases with a higher DC, a surface crosslinked shell or by the incorporation of a second network. However, all these synthetic changes go along with a reduction of the degree of swelling as discussed in the previous section. Hence, the concentration of the polymer cp in the swollen gel is higher with lower Qeq. In order to evaluate whether the arrangement of charges in the network influences the salt rejection or solely the charge density, the salt rejection SR is plotted as a function of the degree of swelling and as a function of the sodium acrylate concentration cSA (i.e., charge density) in Fig. 11a and b, respectively. The relationship between Qeq and cSA is given by | (19) |
 is the mass fraction of sodium acrylate and fSA = 1 − DC − P is the relative sodium acrylate content in the polymer considering the non-charged crosslinker fraction (DC and P).
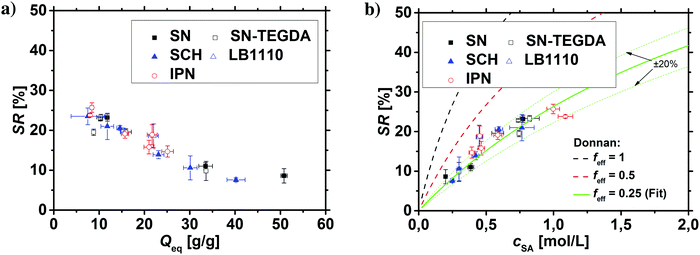 | ||
| Fig. 11 (a) The salt rejection SR of the various hydrogel networks from this paper (see Table 1) is plotted as a function of the degree of swelling Qeq. (b) SR as a function of the sodium acrylate concentration cSA. A higher cSA leads to a higher charge density and thus, to a better salt rejection. The experimental data are compared with calculations from the mean-field Donnan theory using different effective charge fractions (feff). | ||
All the different network architectures have a similar salt partitioning and the SR values are in the same order of magnitude at a given cSA (see Fig. 11). These findings indicate that the charge distribution inside the gel networks has a non-significant influence on the salt partitioning and that only the charge density of the fully swollen hydrogels is crucial, where more charges per gel volume reject more ions.
As shown in Fig. 11a and b, the charge density (i.e., the sodium acrylate concentration cSA) of fully charged polyelectrolyte hydrogels is mainly determined by the degree of swelling. It should be noted that cSA can also be expressed as the number of elementary charges e per cubic nanometer, where 1 mol L−1 ≙ 0.6 e nm−3. In the present work, different network structures were used, which led to a varying degree of swelling at equilibrium and thus, a changing charge density. However, a higher cSA could also be achieved by swelling the same polyelectrolyte network to non-equilibrium using a shorter swelling time, where measuring SR is albeit experimentally not straightforward.
The experimentally measured SR values are compared with calculations from the Donnan theory using eqn (20)–(22).11,13 The salt partitioning of this theoretical analysis is based on a mean-field model and thus, it does not reflect on the distribution of charges in the gel but rather compares the amount of ions inside the gel and the supernatant phase. The following expressions for salt partitioning are derived using this mean-field Donnan approach with an equal volume of supernatant and gel phase.
The salt concentration of mobile anions in the gel phase cin is expressed by
 | (20) |
| cout = 2 × c0 − cin | (21) |
 | (22) |
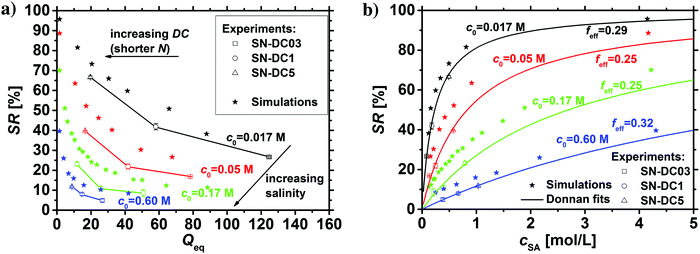
The salt partitioning of the three SN hydrogels were additionally studied in differently concentrated NaCl solutions in the range of 0.017–0.60 mol L−1 and are depicted in Fig. 12a and b. The salt rejection SR increases with decreasing salinity of the aqueous solution, as expected. Furthermore, SR can always be well fitted by the Donnan model using a similar reduced charge fraction feff in the range of 25–32%, with no systematic dependency of the initial salt concentration c0.
The results of the simulations based on the PB cell model are plotted in the same graphs for the different initial salt concentrations as stars in the respective color. The PB model shows qualitatively the same trend as the experimental data and the Donnan fit where the effective charge of the gel was used as a fit parameter. As the simulation data and the fitted Donnan model show the same trend this supports the possible usage of an effective Donnan fit to extrapolate the SR to different crosslinker densities than the ones used for fitting. A decreasing charge density of the gel (higher Qeq and lower cSA, respectively) leads to more mobile salt ions in the gel and fewer in the supernatant phase (lower SR). Quantitatively, the simulations deliver always higher SR values compared to the other data points, where the deviations become larger at low polymer concentrations and high initial salt concentrations. This deviation between experimental and simulation data can be explained by several simplifications that were made, where the resulting discrepancies between experiment and simulation have already been given in Section 3.1. For instance, the experimental Qeq should be about 10% higher due to moisture of the dried samples. Thus, all the experimental data points in Fig. 12a would be shifted by a factor of 1.1 along the x-axes. Furthermore, the PB cell model considers monodisperse elastic chains where no actual crosslinker is present. This might lead to slightly higher charge densities and thus, also to a higher salt rejection. Regarding these fundamental deviations, the simulation based on a simple PB cell model still offers a useful and fast method to get a first approximation of the salt partitioning to be expected.
3.4 Energy efficiency
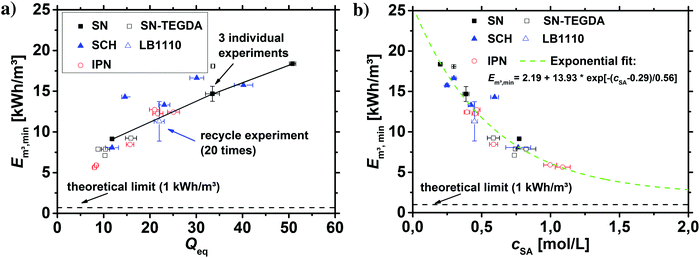
Before the energy efficiency of the different network topologies is discussed, it has to be considered that the specific energy which is estimated by eqn (8) to (11) is also a function of the applied pressure, as displayed in Fig. 13. At low pressure, the desalination is inefficient, while the specific energy becomes almost constant after around 20 bar depending on the sample. Therefore, the minimum Em3,min was used as the efficiency criterion to compare different samples in this paper.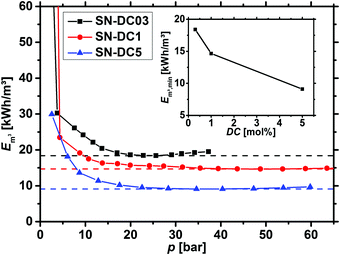 | ||
| Fig. 13 The specific energy Em3, calculated by eqn (12), is plotted as a function of the applied pressure for 0.3, 1 and 5 mol% crosslinked PSA hydrogels. The minimum (dashed lines) is reached within 25–50 bar and afterwards, only minor changes are observed. The inset additionally displays the energy minimum Em3,min as a function of the degree of crosslinking (DC). | ||
As discussed in the previous sections and previous publications,11,12 more densely crosslinked hydrogels have a lower solution capacity and higher mechanical moduli but a larger salt rejection. Therefore, more energy is needed to compress the hydrogels with an increasing DC, while less water is recovered that has however a lower salinity. This is considered in the efficiency criterion (see eqn (10) and (11)) as both quantities, the energy expended and the amount of removed salt, are included. The specific energies of the various hydrogel samples studied in this paper are displayed in Fig. 14a and b. The highest energy efficiency was found for samples with the lowest degree of swelling (higher cSA), as these samples provide the best salt partitioning, as discussed in the previous section. Thus, the salt rejection of the samples investigated is the crucial quantity and the expended energy during compression plays only a minor role for the desalination efficiency. In Fig. 14b, the specific energies Em3,min are plotted as a function of cSA, where the exponential function  was empirically found to present the data. This fit function has the necessary condition that the specific energy is above the theoretical limit of 1 kW h m−3 at infinitely high polymer concentrations. Furthermore, it shows that the effect of the various network architectures having different charge distributions has only a minor influence on the specific energy in agreement with the salt partitioning results of the previous section. The specific energies for the samples investigated were estimated to be in the range of 6–18 kW h m−3, where the lowest specific energy was found for the interpenetrating network IPN-DC5-i-DC1 (see Table 3). However, this sample performed best due to its high cSA rather than due to the specific network structure.
4 Conclusion
Various poly(sodium acrylate) (PSA) hydrogels with different network topologies such as single networks (SN), core–shell particles (SCH) and interpenetrating double networks (IPN) with a systematic change in their degree of crosslinking (DC) have been synthesized.The swelling capacity of deionized water and NaCl solutions was studied, where the absorbency Qeq decreased with higher salinities and more constraints in the network caused by a higher DC, the additional surface crosslinking or the incorporation of a second network. In addition to the experimental data, simulations based on a PB cell model were used to describe qualitatively the same swelling behavior for differently crosslinked SN hydrogels. In general, the simulations overestimated Qeq, which can be ascribed to several simplifications that were made and to the rather undefined structure of the hydrogels synthesized via free radical polymerization. Furthermore, MD simulations showed, in agreement with the experiments, that the water absorbency of an IPN is much smaller at low salinities compared to its related SN, whereas the differences between both network types vanish at higher NaCl concentrations.
The investigation of the transverse magnetization (T2) decay via low-field 1H-NMR was successfully used to correlate the polymer mobility with topological constraints. The distribution of T2-relaxation rates spanned typically 2–3 decades in frequency according to differently mobile parts and could be assigned to the network topology. The distribution shifted to higher frequencies for more highly crosslinked samples, while the distributions became more heterogeneous (bimodal) after the surface crosslinking or the incorporation of a second network. This method is therefore a powerful tool to confirm synthetic steps that change the network architecture, which are otherwise not straightforward to determine.
The salt partitioning of the different networks was investigated in NaCl solutions. It was found that more salt ions are rejected with a higher charge density of the swollen gel, while the distribution of charges inside the gel achieved by the different network architectures had no significant effect. Thus, the experimental data could be qualitatively predicted by the ideal Donnan model. However, a quantitative agreement was only found under the assumption of a reduced effective charge density in between feff = 25–32 mol%. These deviations could be attributed to two different factors: (i) the effective charge fraction along the polymer chains is reduced by counterion condensation, which sets in above a critical charge density fcrit (in the range of 0.35–0.70 mol% in the case of an idealized, infinitely long, linear PSA) and (ii) the Donnan model fails to describe quantitatively highly charged hydrogels, where the salt rejection is overpredicted. Therefore, the found values of feff from the Donnan model should be rather seen as fitting parameters instead of the real charge fraction inside the gel, which should be higher.
In addition to the experimental data, simulations based on the PB model were applied to determine the salt partitioning depending on the initial salt concentration. The simulations were found to be sufficient to qualitatively predict the salt partitioning. Quantitatively, the salt rejection was however overestimated, which can be ascribed to several simplifications that were made, e.g., the mass difference between synthesized and simulated hydrogels due to moisture, and the assumption of a perfect, defect-free hydrogel with a monodisperse distribution of elastic chain lengths.
Finally, the water inside the hydrogels was partially extracted by applying an external pressure. This allows generation of desalinated water as the salt concentration inside the hydrogel is always lower than the initial salt concentration in which the hydrogels were previously swollen. The specific energy of the desalination was estimated to be in the range of 6–18 kW h m−3. Samples with a lower degree of swelling, which have a higher charge density in the swollen hydrogel, performed better, while more material was needed. However, the distribution of charges inside the hydrogel had only a minor influence on the desalination efficiency. This can be explained as the observed network architectures changed the charge density and the mechanical moduli simultaneously. Thus, a higher charge density was only achieved by introducing more constraints into the network, which however increased the mechanical moduli and reduced the water absorbency. A decoupling of the mechanical strength and the charge density would solve this dilemma, which could be realized by introducing non-elastic, but charged dangling ends. This was previously achieved in polyelectrolyte model systems, where physically crosslinked hydrogels made of self-assembled PMMA-b-PSMA-b-PMMA (ABA) triblock copolymers were mixed with AB diblock copolymers.70 An even more effective strategy to get more dangling ends also along the meshes could be the copolymerization of SA with SA macromonomers.
Furthermore, the effect of polydisperse meshes in hydrogels remains an open research question for theory and experiments. From a synthetical point of view, it is still challenging to achieve model polyelectrolyte networks with a monodisperse pore size distribution. We synthesized previously more defined networks by self-assembled ABA triblock copolymers.70 However, a direct comparison with randomly crosslinked poly(sodium methacrylate) hydrogels was found to be difficult due to the different nature of the crosslinking points and crosslinking functionality. In another publication, we started to investigate the effect of polydispersity with simulations based on the PB cell model.40 We want to emphasize that the present paper shows that the simulations can principally explain the experimental results. Additionally, the applied models can address further characteristics of hydrogels, which are not accessible by the simple Donnan model, e.g., the comparison to other characteristics like the compression models and pH-dependent swelling of gels.
Furthermore, we wanted to extend our studies to other salt solutions. In the present paper, we showed how the salt partitioning and the desalination of NaCl model solutions are affected by changing the network topology. However, sea water is a more complex solution and also contains multivalent cations such as Mg2+ and Ca2+,71 which penetrate PSA hydrogels and can reduce their capacity. Therefore, our next publication will focus on the salt partitioning of multivalent ions and how polycationic hydrogels interact with this species compared to poly(sodium acrylate) networks.
Conflicts of interest
There are no conflicts to declare.Acknowledgements
Funding from the German Research Foundation (DFG) through grants WI 1911/24-1, HO 1108/26-1 and AR 593/7-1 is gratefully acknowledged. The SFB 1176 is acknowledged for providing helpful debates within project C1.References
- F. L. Buchholz and A. T. Graham, Modern Superabsorbent Polymer Technology, Wiley-VCH, New York, 1998 Search PubMed.
- M. Elliott, Superabsorbent Polymers, BASF, Ludwigshafen, 2004 Search PubMed.
- M. J. Zohuriaan-Mehr, H. Omidian, S. Doroudiani and K. Kabiri, J. Mater. Sci., 2010, 45, 5711 CrossRef CAS.
- X. Zhu, W. Yang, M. Hatzell and B. Logan, Environ. Sci. Technol., 2014, 48, 7157 CrossRef CAS PubMed.
- L. Arens, F. Weißenfeld, C. O. Klein, K. Schlag and M. Wilhelm, Adv. Sci., 2017, 4, 1700112 CrossRef PubMed.
- T. Q. Bui, V. D. Cao, N. B. Do, T. E. Christoffersen, W. Wang and A.-L. Kjøniksen, ACS Appl. Mater. Interfaces, 2018, 10, 22218 CrossRef CAS PubMed.
- D. Li, X. Zhang, J. Yao, G. P. Simon and H. Wang, Chem. Commun., 2011, 47, 1710 RSC.
- D. Li, X. Zhang, G. P. Simon and H. Wang, Water Res., 2013, 47, 209 CrossRef CAS.
- A. Razmjou, G. P. Simon and H. Wang, Chem. Eng. J., 2013, 215–216, 913 CrossRef CAS.
- J. Höpfner, C. Klein and M. Wilhelm, Macromol. Rapid Commun., 2010, 31, 1337 CrossRef PubMed.
- J. Höpfner, T. Richter, P. Košovan, C. Holm and M. Wilhelm, Prog. Colloid Polym. Sci., 2013, 140, 247 Search PubMed.
- L. Arens, J. B. Albrecht, J. Höpfner, K. Schlag, A. Habicht, S. Seiffert and M. Wilhelm, Macromol. Chem. Phys., 2017, 218, 1700237 CrossRef.
- F. G. Donnan and E. A. Guggenheim, Z. Phys. Chem., 1932, A162, 346 CAS.
- P. J. Flory, Principles of Polymer Chemistry, Cornell University Press, Ithaca, New York, 1953 Search PubMed.
- A. Katchalsky and I. Michaeli, J. Polym. Sci., 1955, 15, 69 CrossRef CAS.
- J. Kucera, Desalination: water from water, Wiley Online Library, Scrivener Publishing, Salem, Massachusetts, 2014 Search PubMed.
- C. Yu, Y. Wang, X. Lang and S. Fan, Environ. Sci. Technol., 2016, 50, 13024 CrossRef CAS PubMed.
- W. Ali, B. Gebert, T. Hennecke, K. Graf, M. Ulbricht and J. Gutmann, Appl. Mater. Interfaces, 2015, 7, 15696 CrossRef CAS PubMed.
- P. J. Flory and J. Rehner, J. Chem. Phys., 1943, 11, 512 CrossRef CAS.
- A. R. Khokhlov, S. G. Starodubtzev and V. V. Vasilevskay, in Responsive gels: Volume transitions I, ed. K. Dušek, Springer, Berlin, Heidelberg, vol. 109, 1993, pp. 123–171 Search PubMed.
- M. Rubinstein, R. H. Colby, A. V. Dobrynin and J. F. Joanny, Macromolecules, 1996, 29, 398 CrossRef CAS.
- G. C. Claudio, K. Kremer and C. Holm, J. Chem. Phys., 2009, 131, 094903 CrossRef PubMed.
- G. S. Longo, M. O. de la Cruz and I. Szleifer, Macromolecules, 2011, 44, 147 CrossRef CAS.
- M. Quesada-Pérez, J. A. Maroto-Centeno, J. Forcada and R. Hidalgo-Alvarez, Soft Matter, 2011, 7, 10536 RSC.
- P. K. Jha, J. W. Zwanikken, J. J. de Pablo and M. O. de la Cruz, Curr. Opin. Solid State Mater. Sci., 2011, 15, 271 CrossRef CAS.
- A. J. Liu, G. S. Grest, M. C. Marchetti, G. M. Grason, M. O. Robbins, G. H. Fredrickson, M. Rubinstein and M. O. de la Cruz, Soft Matter, 2015, 11, 2326 RSC.
- S. Schneider and P. Linse, Eur. Phys. J. E: Soft Matter Biol. Phys., 2002, 8, 457 CrossRef CAS.
- Q. Yan and J. J. de Pablo, Phys. Rev. Lett., 2003, 91, 018301 CrossRef PubMed.
- S. Edgecombe, S. Schneider and P. Linse, Macromolecules, 2004, 37, 10089 CrossRef CAS.
- D.-W. Yin, Q. Yan and J. J. de Pablo, J. Chem. Phys., 2005, 123, 174909 CrossRef.
- B. A. F. Mann, PhD thesis, Johannes Gutenberg-Universität Mainz, 2005.
- B. A. Mann, C. Holm and K. Kremer, Macromol. Symp., 2006, 237, 90 CrossRef CAS.
- D.-W. Yin, F. Horkay, J. F. Douglas and J. J. de Pablo, J. Chem. Phys., 2008, 129, 154902 CrossRef PubMed.
- M. Quesada-Pérez, J. G. Ibarra-Armenta and A. Martín-Molina, J. Chem. Phys., 2011, 135, 094109 CrossRef PubMed.
- P. Košovan, T. Richter and C. Holm, Macromolecules, 2015, 48, 7698 CrossRef.
- O. Rud, T. Richter, O. Borisov, C. Holm and P. Košovan, Soft Matter, 2017, 13, 3264 RSC.
- B. A. Mann, C. Holm and K. Kremer, J. Chem. Phys., 2005, 122, 154903 CrossRef PubMed.
- O. Rud, O. Borisov and P. Košovan, Desalination, 2018, 442, 32 CrossRef CAS.
- T. Richter, J. Landsgesell, P. Košovan and C. Holm, Desalination, 2017, 414, 28 CrossRef CAS.
- J. Landsgesell, D. Sean, P. Kreissl, K. Szuttor and C. Holm, Phys. Rev. Lett., 2019, 122, 208002 CrossRef CAS PubMed.
- J. Landsgesell and C. Holm, Macromolecules Search PubMed , accepted.
- E. S. Dragan, Chem. Eng. J., 2014, 243, 572 CrossRef CAS.
- J. P. Gong, Y. Katsuyama, T. Kurokawa and Y. Osada, Adv. Mater., 2003, 15, 1155 CrossRef CAS.
- J. P. Gong, Soft Matter, 2010, 6, 2583 RSC.
- Q. Chen, H. Chen, L. Zhua and J. Zheng, J. Mater. Chem. B, 2015, 3, 3654 RSC.
- J. Höpfner, G. Guthausen, K. Saalwächter and M. Wilhelm, Macromolecules, 2014, 47, 4251 CrossRef.
- A. Flohr, T. Lindner and Y. Mitsukami, EU Pat., 1917280A1, 2007 Search PubMed.
- S. Obayashi, M. Nakamura, K. Fujiki and T. Yamamoto, US Pat., 4340706A, 1982 Search PubMed.
- A. Maus, C. Hertlein and K. Saalwächter, Macromol. Chem. Phys., 2006, 207, 1150 CrossRef CAS.
- T. Gullion, D. B. Baker and M. S. Conradi, J. Magn. Reson., 1990, 89, 479 CAS.
- A. Guthausen, G. Zimmer, P. Blümler and B. Blümich, J. Magn. Reson., 1998, 130, 1 CrossRef CAS PubMed.
- S. W. Provencher, Makromol. Chem., 1979, 180, 201 CrossRef CAS.
- S. W. Provencher, Comput. Phys. Commun., 1982, 27, 213 CrossRef.
- S. W. Provencher, Comput. Phys. Commun., 1982, 27, 229 CrossRef.
- I.-G. Marino, Regularized Inverse Laplace Transform, 2007, https://de.mathworks.com/matlabcentral/fileexchange/6523-rilt, accessed: June 22, 2016.
- S. Edgecombe and P. Linse, Polymer, 2008, 49, 1981 CrossRef CAS.
- Y.-L. Yin, R. K. Prud'homme and F. Stanley, in Polyelectrolyte Gels: Properties, Preparation, and Applications, ed. R. S. Harland and R. K. Prud'homme, American Chemical Society, Washington DC, vol. 1, 1992, p. 91 Search PubMed.
- U. P. Schröder and W. Oppermann, in Physical Properties of Polymeric Gels, ed. J. P. C. Addad, Wiley, New York, 1996, pp. 19–39 Search PubMed.
- L. Brannon-Peppas and R. S. Harland, Absorbent Polymer Technology, Studies in Polymer Science, Elsevier, Amsterdam, 1990 Search PubMed.
- F. Horkay, I. Tasaki and P. J. Basser, Biomacromolecules, 2000, 1, 84 CrossRef CAS PubMed.
- M. Muthukumar, Macromolecules, 2017, 50, 9528 CrossRef CAS.
- M. Mussel, P. J. Basser and F. Horkay, Soft Matter, 2019, 15, 4153 RSC.
- P. J. Flory, J. Proc. R. Soc. London Ser. A, 1976, 351, 351 CrossRef CAS.
- J. E. Mark, Physical Properties of Polymers Handbook, Springer, New York, 2007 Search PubMed.
- H. Wack, PhD thesis, Universität Duisburg-Essen, 2006.
- J. Baselga, I. Hernández-Fuentes, I. F. Piérola and M. A. Llorente, Macromolecules, 1987, 20, 3060 CrossRef CAS.
- J. Bastide and L. Leibler, Macromolecules, 1988, 21, 2647 CrossRef CAS.
- G. Hild, Prog. Polym. Sci., 1998, 23, 1019 CrossRef CAS.
- G. S. Manning, J. Chem. Phys., 1969, 51, 924 CrossRef CAS.
- L. Arens and M. Wilhelm, Macromol. Chem. Phys., 2019, 1900093 CrossRef CAS.
- ASTM, Standard Practice for the Preparation of Substitute Ocean Water, ASTM International, West Conshohocken, PA, 2013 Search PubMed.
Footnote |
| † Electronic supplementary information (ESI) available. See DOI: 10.1039/c9sm01468c |
| This journal is © The Royal Society of Chemistry 2019 |

