 Open Access Article
Numerical insights on ionic microgels: structure and swelling behaviour†
Giovanni
Del Monte
 *abc,
Andrea
Ninarello
 ba,
Fabrizio
Camerin
 bd,
Lorenzo
Rovigatti
 ab,
Nicoletta
Gnan
 ba and
Emanuela
Zaccarelli
 *ba
*ba
aPhysics Department, Sapienza University of Rome, Piazzale A. Moro 2, 00185 Rome, Italy. E-mail: giovanni.delmonte@uniroma1.it
bCNR-ISC, Sapienza University of Rome, Piazzale A. Moro 2, 00185 Rome, Italy. E-mail: emanuela.zaccarelli@cnr.it
cCenter for Life NanoScience, Istituto Italiano di Tecnologia, Rome, Italy
dDepartment of Basic and Applied Sciences for Engineering, Sapienza University of Rome, via A. Scarpa 14, 00161 Rome, Italy
First published on 7th October 2019
Abstract
Recent progress has been made in the numerical modelling of neutral microgel particles with a realistic, disordered structure. In this work we extend this approach to the case of co-polymerised microgels where a thermoresponsive polymer is mixed with acidic groups. We compare the cases where counterions directly interact with microgel charges or are modelled implicitly through a Debye–Hückel description. We do so by performing extensive numerical simulations of single microgels across the volume phase transition (VPT) varying the temperature and the fraction of charged monomers. We find that the presence of charges considerably alters the microgel structure, quantified by the monomer density profiles and by the form factors of the microgels, particularly close to the VPT. We observe significant deviations between the implicit and explicit models, with the latter comparing more favourably to available experiments. In particular, we observe a shift of the VPT temperature to larger values as the amount of charged monomers increases. We also find that below the VPT the microgel–counterion complex is almost neutral, while it develops a net charge above the VPT. Interestingly, under these conditions the collapsed microgel still retains a large amount of counterions inside its structure. Since these interesting features cannot be captured by the implicit model, our results show that it is crucial to explicitly include the counterions in order to realistically model ionic thermoresponsive microgels.
1 Introduction
Microgels are colloidal scale polymeric networks that can be dispersed in a good solvent.1 They have recently become a favourite model system2–5 thanks to their intrinsic softness and to the possibility to respond to external stimuli with changes in size. Such a phenomenon is commonly referred to as Volume Phase Transition (VPT)1 and it is controlled by the properties of the constituent polymers. The prototype example is given by poly(N-isopropyl-acrylamide), PNIPAM, a thermoresponsive polymer which gives microgels in water the ability to reversibly increase or reduce their size after a change of temperature around the so-called VPT temperature TVPT ∼32 °C. Another interesting case can be realized using pH-responsive ionic polymers, made of weak acidic or weak alkaline monomers. The resulting ionic (or simply called charged) microgels are able to adjust their bare charge in response to a pH variation by releasing H+ or OH− ions due to the dissociation of a fraction of monomers.6Out of the many possibilities provided by modern-day synthesis methods, co-polymerised PNIPAM-co-PAAc microgels are of particular interest,6–9 as they combine the thermoresponsive properties of PNIPAM with the pH-responsive features of polyacrylic acid (PAAc), stemming from the weak acidic nature of AAc monomers. Indeed, at low pH almost all AAc monomers are not dissociated because of the high concentration of H+, which favours the inverse recombination reaction that leads to an almost neutral network. On the other hand, for high pH values, most of the acidic monomers dissociate, generating a charge distribution throughout the particle volume. It is important to note that the fraction and the distribution of the charges within the network depend on the chosen experimental conditions, such as the packing fraction, the specific molecular interactions, the local counterions concentration and the electrostatic interactions between nearest charged monomers, which can be optionally mediated by the presence of salt.1,9,10
The multiresponsive character of ionic microgels makes them highly versatile. They are indeed responsive also to external alternating electric fields, through which their mutual interactions (and hence their phase behaviour) can be tuned.11,12 Their single-particle properties have been extensively investigated in experiments as a function of both temperature and pH.9 Microgels with different content of AAc obtained through several synthesis methods have been analysed in order to assess the effects of inhomogeneities in the distribution of crosslinkers and charged monomers.7,8 The tunability of ionic microgels has also been exploited in several fields of research, from biology13 to laser technology.14 For instance, their dual responsiveness makes them highly suitable to be employed in the smart design of optical switch devices3 based on colloidal photonic crystals.
Understanding the effects of electrostatic interactions in ionic microgels could also shed light on the behaviour of other kinds of microgels. Indeed, even those constituted by PNIPAM only show interesting features determined by the presence of charges, particularly for high concentrations15,16 or above the VPT temperature.10,17 In addition, microgels consisting of two different interpenetrated networks, made of PNIPAM and PAAc respectively, have recently gathered a lot of attention because of their suitability to study the problem of fragility in structural glasses.18,19
From the theoretical point of view, several investigations of the swelling of charged microgels, mostly relying on a mean-field treatment of the polymer network based on the Flory–Rehner theory,20,21 have been reported. In these works, electrostatic effects and steric interactions due to the presence of counterions have been taken into account by approximated theories such as the Poisson–Boltzmann equation,22,23 the Ornstein–Zernike integral equation24 and density functional theory.25 Also an effective interaction potential has been derived using linear response theory,26 which made it possible to draw a phase diagram for ionic microgels.27 On the numerical side, the use of coarse-grained models12,28 has allowed to go beyond the mean-field framework and tackle the behavior of ionic microgels at all concentrations. However, in order to refine the highly coarse-grained models required to study the bulk properties of microgel suspensions, it is important to first correctly capture the single-particle behavior, a task that has been tackled only relatively recently29,30 due to the high computational cost of numerical studies reproducing microgels at monomer-resolved level.
The inclusion of long-range electrostatic interactions on complex objects such as microgels is a challenging and numerically demanding task, particularly if counterions are explicitly considered. Therefore, in several cases, an implicit treatment of counterions, for example based on the Debye–Hückel theory, has been employed to make it possible to perform simulations of relatively large systems.31,32 However, a few numerical investigations have also been carried out in the explicit presence of the counterions. A pioneering work reported coarse-grained simulations of polyelectrolyte gel networks,33 while simulations of single nanogel particles have appeared only later on.34–39 Several techniques have been devised to treat charged networks. Particularly, recent Monte Carlo simulations40–42 have been carried out to provide a coarse-grained description of the dissociation reaction on a statistical basis. These studies concluded that all investigated macroscopic properties mostly depend on the number of charges, rather than on their distribution, in agreement with experimental observations.8 Notwithstanding this, all coarse-grained studies of ionic microgels have so far been performed with networks built out of ordered topologies, e.g., based on the diamond lattice, which cannot take into account the disordered nature of real polymer networks.29
In order to go beyond mean-field and to account in a more realistic way for the effect of the network topology, in this work we perform extensive simulations of charged microgels modelled as disordered networks. We start by preparing neutral microgel configurations following previous works,43,44 ensuring that the internal microgel structure reproduces the swelling behavior and form factors of experimental non-ionic microgels. Then, we add a quenched charge distribution, varying the fraction of charged monomers that are randomly distributed throughout the network. Since the probability that a monomer is charged is lower near crosslinkers,40,41 we add the constraint that the latter are always neutral. To account for charge–charge interactions we perform two different kinds of simulations: (i) we rely on the Debye–Hückel model in which charged monomers interact implicitly through a two-body Yukawa potential and (ii) we explicitly include counterions as charged coarse-grained particles. We calculate the density profiles and form factors of the microgels for both approaches and average over different charge realizations. We simulate microgels in swollen conditions and across the volume phase transition by using a solvophobic interaction between the monomers that models the different quality of the solvent as temperature varies.43,44
Our work is important to understand the effects that inhomogeneous topologies and charge distributions beyond mean-field can have on the single-particle behavior of ionic microgels, filling a gap in the current literature. In addition, we provide significant insights on the difference between neutral and charged microgels across the volume phase transition. Indeed, the competition between the electrostatic repulsion and the solvophobic attraction, which develops at intermediate temperatures in between the swollen and collapsed regimes, could be important for the arising of a distinct phenomenology in the presence of charges. Finally, our work can be considered as a starting point for future investigations at finite concentrations, shedding light on the deswelling behavior of ionic microgels, which takes place at concentrations below the overlap one.7,28
2 Models and methods
2.1 Monomer interactions
To analyse the role of charges on the single-particle properties and on the swelling behaviour of microgels, we exploit a recently proposed numerical protocol43 to generate disordered, heterogeneous microgels that are structurally similar to real neutral ones. We start by preparing fully connected spherical networks by confining patchy particles in a cavity. We always consider an additional designing force acting only on the crosslinkers, which provides the typical core–corona structure of realistic microgels.44 Once the network is formed, we freeze the topology of the network and adopt a monomer-resolved approach.45 The beads that make up the polymers interact via a steric repulsion, modeled with the Weeks–Chandler–Anderson (WCA) potential: | (1) |
 | (2) |
All monomers also interact with each other by means of an effective solvophobic potential, named Vα, which implicitly takes into account the monomer–solvent interactions:46
 | (3) |
 and
and  .46 This potential represents an effective attraction, modulated by the solvophobic parameter α, arising between thermoresponsive monomers at high temperatures. In other words, α plays the role of an effective temperature: α = 0 represents good solvent conditions, while with increasing α the quality of the solvent worsens, leading to the aggregation of beads and to the shrinking of microgel particles.43,59
We complement this model by adding electrostatic interactions between charges that are randomly assigned to a fraction f of the microgel monomers. This choice aims to model the dissociation of weak electrolyte groups, usually giving rise to negatively charged microgels, such as when acrylic acid is used as a co-monomer in the synthesis process. The neutrality of the overall suspension imposes the presence of positively charged counterions, which balances the total charge of the microgel–counterion complex. In the simplest approach, the effect of charges can be taken into account by using the Debye–Hückel potential, which models the charge–charge interaction as a screened Coulomb (or Yukawa) potential acting between each pair of charged beads as:47
 | (4) |
 | (5) |
| λD = (4πλBρci)−1/2. | (6) |
Although the Debye–Hückel model is suitable to implicitly treat the role played by counterions in homogeneous systems and in the effective interactions among colloidal particles in dispersions, it should be avoided when studying electrostatic ion–ion interactions within inhomogeneous weak-electrolyte systems such as charged polymeric particles. In particular, one of the drawbacks of using this approach is that, for weak polyelectrolytes, there is not a simple link between the pH and the dissociation fraction of the acidic monomers, which determines the value of λD.50 Moreover, this model cannot take into account other relevant effects due to the presence of counterions, such as their osmotic pressure. In order to overcome these issues it is crucial to explicitly take into account the counterions and thereby to adopt an alternative model where all charged beads interact via the bare Coulomb potential, as:
 | (7) |
2.2 Numerical simulations
We perform Molecular Dynamics simulations of single microgels with N ∼ 42![[thin space (1/6-em)]](https://www.rsc.org/images/entities/char_2009.gif) 000 monomers at fixed crosslinker concentration c = 5%. Microgels are assembled as in ref. 44 in a spherical cavity of radius R0 = 50σ, yielding an internal structure of the microgels which compares very well with experimental ones obtained through radical polymerisation techniques at the same value of c. Once a fully connected network is assembled, we assign a charge ze = 1 to a fraction f of the monomers, that are randomly chosen throughout the microgel. We then maintain this charge distribution fixed throughout the simulation run and we average results over four different network topologies and three different realizations of the charge distribution.
000 monomers at fixed crosslinker concentration c = 5%. Microgels are assembled as in ref. 44 in a spherical cavity of radius R0 = 50σ, yielding an internal structure of the microgels which compares very well with experimental ones obtained through radical polymerisation techniques at the same value of c. Once a fully connected network is assembled, we assign a charge ze = 1 to a fraction f of the monomers, that are randomly chosen throughout the microgel. We then maintain this charge distribution fixed throughout the simulation run and we average results over four different network topologies and three different realizations of the charge distribution.
We study microgels for three different charge fractions, f = 0.05, 0.20, 0.95, and for several values of the solvophobic parameter α across the VPT. The equations of motion of the system are integrated via the velocity-Verlet algorithm.51 The equilibration of the system is carried out in the canonical ensemble using the Nosè–Hoover chains thermostat for 1.6 × 10⁶ simulation timesteps, while a long production run in the microcanonical ensemble of ∼2 × 10⁶ steps is used to obtain equilibrium averages of the thermodynamic observables under investigation. We used a cut-off of Rcut = 5λD for the Debye–Hückel potential, whereas the long-range Coulomb interactions are computed with the particle–particle–particle–mesh method.52 For the latter type of simulations we used the LAMMPS package.53
2.3 Main observables
To assess the microgel size, we calculate the radius of gyration, defined as: | (8) |
![[r with combining right harpoon above (vector)]](https://www.rsc.org/images/entities/i_char_0072_20d1.gif) i and
i and ![[r with combining right harpoon above (vector)]](https://www.rsc.org/images/entities/i_char_0072_20d1.gif) CM are the positions of the i-th monomer and of the microgel's center of mass, respectively.
CM are the positions of the i-th monomer and of the microgel's center of mass, respectively.
To gain a better knowledge of the inner structure of the microgel we calculate its radial density profile, defined as the average density at a fixed distance from the center of mass:
 | (9) |
The counterpart of the density profile in Fourier space is the form factor P(q), which can be readily obtained in neutron or X-ray scattering experiments of dilute microgel suspensions. In simulations P(q) can be directly calculated as:
 | (10) |
![[q with combining right harpoon above (vector)]](https://www.rsc.org/images/entities/i_char_0071_20d1.gif) ) over 300 vectors
) over 300 vectors ![[q with combining right harpoon above (vector)]](https://www.rsc.org/images/entities/i_char_0071_20d1.gif) randomly picked onto a spherical surface of radius q.
randomly picked onto a spherical surface of radius q.
Usually, experimental and numerical data of P(q) for neutral microgels are described by the fuzzy sphere model,54 which is able to account for particles with a homogeneously dense core and a fuzzy corona, wherein the density gradually decreases away from the center of mass. This results in a density profile  , where Erfc(·) is the complementary error function, while R and σsurf are related to the extension of the core and of the corona, respectively. However, it has recently been suggested by super-resolution microscopy measurements55 that the assumption of a homogeneous core may not be too accurate, and that the density profile of microgels could be better approximated by the function
  , which includes a linear growth of the monomer density inside the core modulated by the parameter s. Our microgels have thus been assembled through a numerical protocol that is able to reproduce such features.44 The additional linear term in the density profiles modifies the shape of the form factor in an extended fuzzy sphere model:
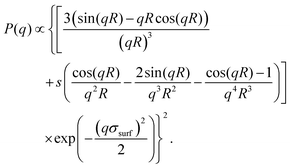 | (11) |
 | (12) |
3 Results and discussion
3.1 Swollen microgels
In this section we discuss the properties of microgels in good solvent conditions. In our model this corresponds to α = 0, i.e., to monomers that interact via the bead-spring model plus the charges contribution only. To quantify the latter, we analyze both the Debye–Hückel approach and the simulations in the presence of explicit counterions, carrying out a comparison between these approaches and the neutral case.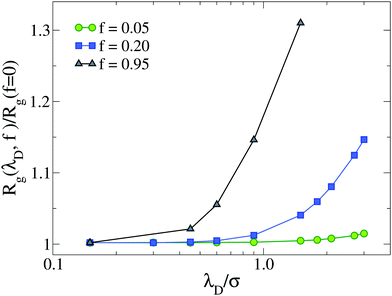 | ||
| Fig. 1 Gyration radius Rg as a function of Debye length λD for different values of f, up to the fully charged case (f = 0.95). Data are normalized with respect to the neutral microgel (f = 0). | ||
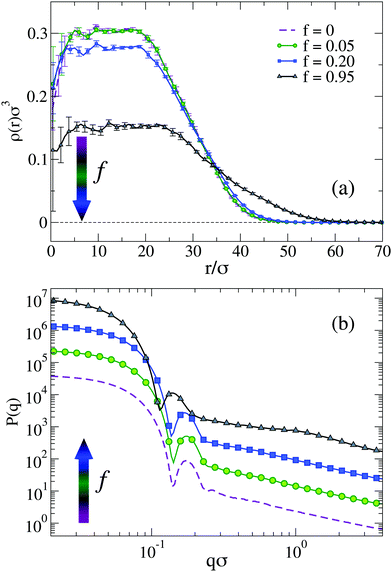
To visualize the effect of charges on the internal structure of the microgels, we report in Fig. 2 the density profiles and the form factors of the microgels for a representative value of λD and different values of f, from the neutral case up to the fully charged one. As expected, we find that a larger presence of charges has the effect to lower the density of monomers in the core region and consequently to increase it in the corona, as shown in Fig. 2(a). Such a variation of the density profile is barely noticeable for f = 0.05 and very moderate for f = 0.20. However, the fully charged case displays a considerably different profile, where the core density is about half of that in the neutral case and the corona extends to distances larger by about 50% with respect to the neutral case. Small oscillations at short distances r disappear when averaging over a larger number of realizations of network topologies.43,57
Corresponding P(q) are reported in Fig. 2(b) showing again tiny changes from f = 0 to f = 0.20: the first peak slightly shifts to smaller wavevectors, reflecting the larger size of the microgel, but no additional peaks are observed. In addition, the slope of the curves at high q remains the same. The case f = 0.95 shows the same features, but amplified by the large number of charges. Interestingly, we can compare the results in Fig. 2, with those reported in ref. 31 for a fully charged diamond lattice network where charges are also modelled by a Debye–Hückel potential. In that work, regular oscillations in the density profiles were observed, due to the underlying presence of a regular mesh of the network, as also discussed previously for non-ionic microgels.29 Such oscillations were further enhanced in the presence of charges, leading to unrealistic density profiles. Similarly, the form factors were found to display strong deviations from the fuzzy sphere model, displaying a minimum at intermediate q. Such features are totally absent in the disordered network model examined here, regardless of the amount of charge. These results confirm once more the importance of a correct modeling of the underlying network topology to treat single-particle microgel properties, also for charged microgels.
We notice that at high pH the average fraction of ions that dissociate from the microgels may be considerably lower than the ideal one for dilute suspensions of AAc, resulting in a larger average distance between charged monomers.50 This poses concerns about the use of too large values of f, which would be unrealistic under these conditions. Indeed, if we look more carefully, we notice that P(q) for f = 0.95 displays a sort of kink for qσ ∼ 1. Looking at the snapshots of the corresponding microgel (not shown), evident holes appear in the structure with a size comparable to this length scale, suggesting that such high-charge conditions are probably far from realistic ones for standard co-polymerized microgels. For these reasons, in the following, we will consider only the f = 0.05 and f = 0.20 cases. We kept the case f = 0.95 in the foregoing analysis (i) to compare with previous simulation studies in which f = 1 was used31 and (ii) to appreciate the qualitative trends of the analysed physical quantities.
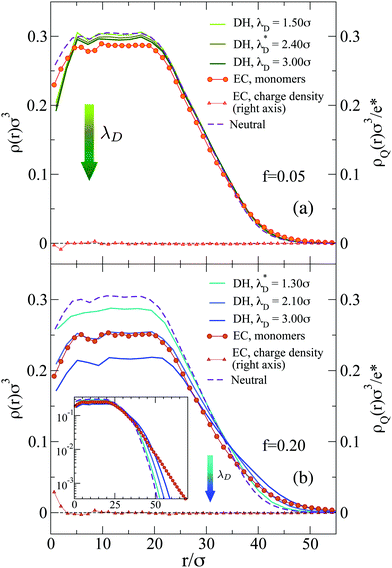
For f = 0.05 the two models yield similar results, probably due to the limited presence of charged monomers. However, for f = 0.20 the microgel with explicit counterions exhibits a more extended corona than the Debye–Hückel model for all investigated values of the Debye length (see inset of Fig. 3). Even a large increase of λD, which has a qualitatively similar effect to the increase of f (since we find fewer monomers in the core and a more extended corona), gives rise to results that do not superimpose onto the explicit counterions case, suggesting an intrinsic different structure of the microgels between the two models. In an attempt to set up an effective Debye–Hückel model that mimics the explicit one, we have calculated an effective screening length λD* from eqn (6) by substituting ρci with the average density of counterions that is present inside the microgel with explicit counterions within a sphere of radius (2/3)Rg. Such a value roughly takes into account the whole extent of the core region. In this way, we obtain λD* ≃ 2.4σ for f = 0.05 and λD* ≃ 1.3σ for f = 0.2, respectively. The resulting density profiles of the λD*-microgels are reported in Fig. 3, showing also in this case a different behavior with respect to the explicit model. Deviations are larger in Fig. 3(b) for the higher fraction of charges considered, where the effective Debye–Hückel result is actually much more similar to the neutral case than to the explicit one.
The use of explicit counterions makes it possible to monitor the total charge density of the microgels ρQ(r), also shown in Fig. 3. For both values of f we find that the complex microgel–counterions is globally neutral at all length scales. Indeed, charge density profiles are much smaller with respect to the average inner densities of charged monomers both for f = 0.05 (ρQ ∼ 1.5 × 10⁻²σ−3) and f = 0.20 (ρQ ∼ 5.0 × 10⁻²σ−3). Thus, the counterions are able to freely diffuse throughout the microgels, even within the core, so that they fully counteract the electrostatic repulsion. The presence of the counterions inside the network thus contributes to the increase in the size of the microgel.
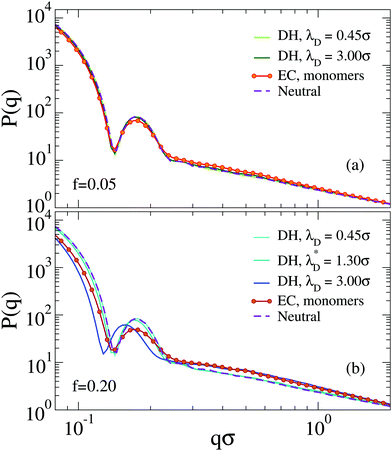
The behavior of the form factors is shown in Fig. 4. We start by discussing the results for f = 0.05 in Fig. 4(a), where only very minor changes to P(q) are observed and no shift of the first peak position is found. We find that all curves corresponding to the Debye–Hückel model are quite similar to the neutral case, independently of λD. The only noticeable difference is a weakening of secondary peaks in the presence of charges. The explicit model is the only one with a significantly smaller peak height and a different behavior at larger q, with some small residual oscillations and an apparently different slope at intermediate wavevectors.
These features are amplified for f = 0.20, where now also a shift of the first peak position to smaller q values is observed. This is actually more evident for the implicit, rather than for the explicit model, which displays the smallest peak intensity. Again, secondary peaks are suppressed and now the appearance of a different slope for P(q) in the second peak region is more evident. Hence, we confirm that the Debye–Hückel model cannot be superimposed on the one with explicit counterions, even with the use of an effective Debye–Hückel model with λD = λD*.
The fact that the implicit Debye–Hückel model fails to reproduce the features observed in the explicit counterions case can be attributed to at least two reasons. First, the permeable and inhomogeneous structure of microgels as well as the presence of a rough interface among its inner part and the solvent generate uneven distributions of charges. These in turn lead to different screening conditions in different regions of the particle, that cannot be captured by the single lengthscale of the Debye–Hückel model. Second, the counterions have to balance the electrostatic attraction which drives them close to the charged monomers of the network, and the entropic gain that pushes them to leave the microgel, the latter being particularly strong for small-sized nanogels.58 Under these conditions, it is not a priori trivial to assess the relative contributions to the swelling of the electrostatic interactions and of the counterions osmotic pressure, respectively. In addition, these considerations make such a kind of implicit treatment not readily applicable to the study of finite-concentration suspensions (beyond the scope of this paper), because of the complex dependence, in thermosensitive soft colloids, of the local counterions concentration on the effective packing fraction and on temperature.
3.2 Temperature-driven swelling of charged microgels with explicit counterions
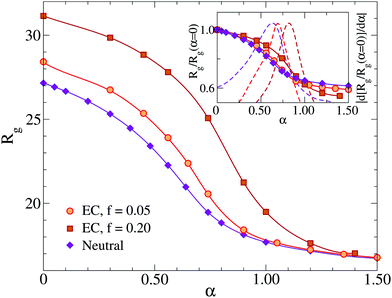
In this section, we analyze in detail the deswelling behavior of the microgels with explicit counterions by adding the solvophobic potential Vα between monomers (eqn (3)) to mimic the increase of temperature in experiments.8,9Additionally, we find that, while the microgel radius of gyration becomes larger with increasing charge for small values of α, for α ≳ αVPT all microgels have the same size, indicating that the collapsed state does not depend on the presence of charges. This result has the interesting consequence that, upon rescaling Rg by its value at the maximally swollen state (α = 0), as shown in the inset of Fig. 5, the swelling ratio becomes larger as f increases. Since such a ratio has been previously adopted as a measure of the particle softness,18,19 this suggests that more charged microgels are softer than less charged or neutral ones, in agreement with experimental findings,9,60,62 at least when the ionization is not too high. Indeed, in these studies it has also been shown that at high pH values (corresponding to large charges fraction f) the complete collapse of the microgel is no longer observed, differently from the present numerical results. This may be due to the fact that in our model we neglect the interplay between the hydrophilic character of the co-polymer and its charge content, while the presence of charges at high T could alter the monomer–solvent interactions. Thus, a more accurate analysis based on a systematic comparison with experiments should be done in the future, in order to establish a correct mapping, for ionic microgels, among the real temperature T and the effective temperature α. This should also take into account the effect of salt, which plays a major role when pH is different from 7. In addition, some of the observed discrepancy could be due to the random charge distribution that we have considered, which could be not entirely realistic and should be compared with different choices. In this respect an experimental measurement of how the charges are distributed throughout the microgel, e.g., a quantification of the charge fraction located on the surface rather than in the interior,63,64 would be a very valuable input to the simulations.
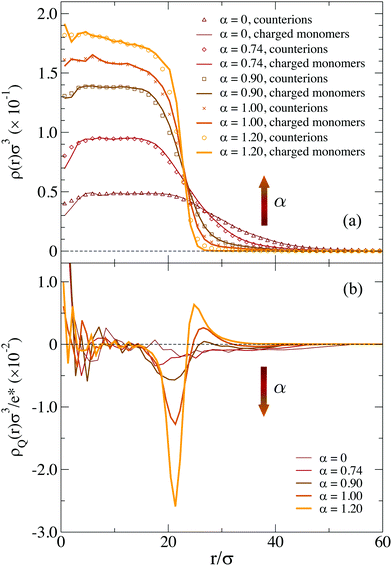
The fact that the collapsed state is the same in all investigated cases could be misleadingly taken as an indication that all (or most of the) counterions are expelled from the interior of the microgel. However, this turns out not to be the case, as it can be seen from the internal charge distributions of the microgel reported in Fig. 6. Specifically, the evolution of the charged monomers and counterions density profiles is separately shown for a few selected α values across the VPT in Fig. 6(a), which only contains results for f = 0.20. The behavior for f = 0.05 is qualitatively similar and thus not shown. We find that the profiles of the charged monomers and counterions closely follow each other at all studied values of α. This indicates a residual presence of counterions inside the microgels, which actually increases with α in order to balance the increase of monomer charge density in the collapsed core. The fact that the presence of counterions inside the microgels does not affect the size of the collapsed state also indirectly confirms that the choice of a small size for the counterions in our simulations is appropriate.
Looking at the profiles in Fig. 6(a) more closely, we find a small difference between counterions and charged monomers profiles upon increasing α and close to the surface of the microgels. This can be better visualized in Fig. 6(b), which reports the net-charge density profiles ρQ(r) (defined in Methods) at different α-values. We find that in the swollen state the charge density is statistically zero at all distances, except for the outer corona region, where it takes a tiny negative contribution. This is caused by the outermost counterions that are entropically driven to freely move around the simulation box, even far from the microgel. This situation persists below the VPT. However a significant change occurs close and above the VPT temperature. Indeed, under these conditions the microgel still maintains a rather neutral core, but in the corona the charge density abruptly increases, leading to the formation of a charged double layer. This trend is enhanced as α increases, signalling that there is a large charge imbalance at the surface of the microgels, where the counterions tend to accumulate. Such a phenomenon can be tentatively explained as follows. For small α, the structure of the microgel is swollen and counterions can be close to the charged monomers at any distance from the center of mass, still retaining a large freedom of moving inside the network. However, when α increases, the asymmetry among the interactions experienced by charged monomers and counterions come into play. On one hand, charged monomers interact with the additional solvophobic potential Vα which partially counteracts their electrostatic mutual repulsion. These contributions combined with the presence of the polymer network, which constraints their positions, induce the charged monomers density ρCH to steeply decay close to the surface of the microgel. On the other hand, counterions are able to gain translational entropy and at the same time to reduce their mutual repulsion by positioning themselves close to the surface in a more dispersed way. This implies a smoother decay of ρCI. The asymmetry between these two behaviors causes the formation of the above-mentioned double layer. Hence for α > αVPT, the microgels acquire an effective charge and are surrounded by a small counterion cloud. This result highlights the non-trivial arrangements of counterions with respect to the microgel structure. It can also be of guidance in the treatment of ionic microgels at finite concentrations, particularly for large ones where similar crowding effects may take place, which may cause the re-organization of the counterions distribution within the microgel even under swollen conditions.7,28
3.3 Comparison between the explicit and implicit models across the volume phase transition
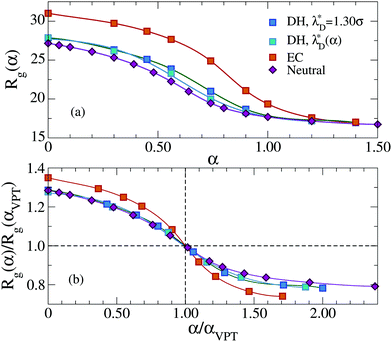
We start by reporting the swelling curves of implicit and explicit models in Fig. 7. For Debye–Hückel simulations we have computed two different swelling curves. The first one is obtained using the effective Debye length λD*, assuming it to be constant for all values of α. For the second swelling curve we have calculated the effective Debye length for each value of α to take into account the change in counterions density. Since the latter increases as a consequence of shrinking, the resulting λD*(α) decreases upon increasing α. The two swelling curves are very similar to each other, with small differences only visible close to the VPT, indicating that the transition occurs slightly earlier for the varying λD*(α) with respect to the constant one. However, in both cases, αVPT is found to be close to the neutral microgel result, and hence smaller than that of the explicit one. Interestingly, making λD*(α) to vary with α leads to Rg predictions that are even further away from the explicit counterions case than those observed with a constant λD, suggesting that such an approach is deeply flawed. Our findings demonstrate that the charged microgel with explicit counterions retains a much larger structure for all α ≲ αVPT.
The bottom panel of Fig. 7 shows the same swelling curves rescaled along both axis with the respective values of α and Rg at the VPT, in order to analyze the shape of the swelling curve with respect to each other. We find that, for α < αVPT, both curves relative to the implicit model coincide with that of neutral microgels, while the explicit model significantly differs. For α > αVPT, on the contrary, neutral, EC and DH curves are all different and, even for the implicit model, we find that the shrinking ratio is slightly increased with respect to the neutral case, confirming that charged microgels are softer also when modelled with the Debye–Hückel approach.
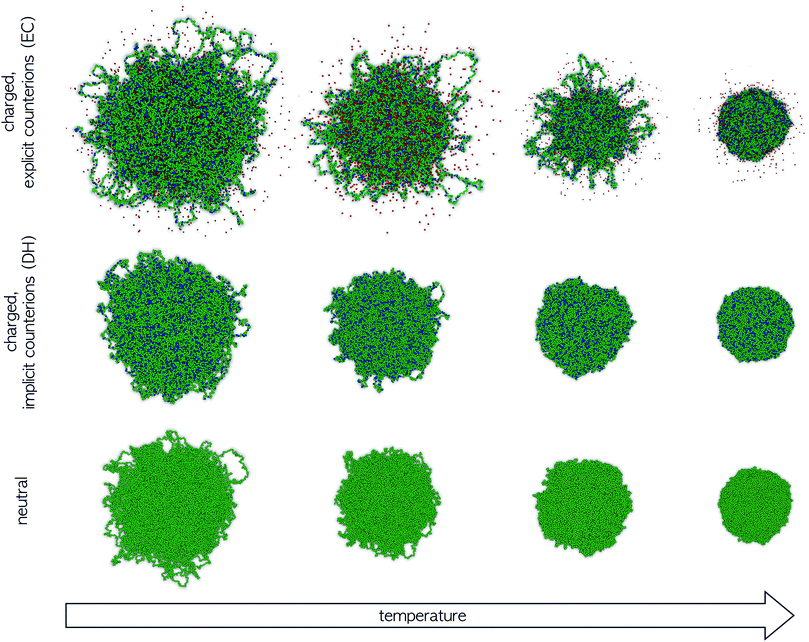
In order to better understand the main differences between the different models as the solvophobicity increases, in Fig. 8 we report representative snapshots of the system across the VPT. Data for the microgel with explicit counterions (top row) are compared to the Debye–Hückel model (intermediate row) and to the neutral system (bottom row) at similar values of α/αVPT. All snapshots refer to the very same underlying network topology, in order to clearly discriminate the effects of charges. In the swollen regime, the microgel conformations are comparable, but the increase in microgel size as we go from neutral to DH to EC model is evident. By contrast, in the fully collapsed regime all microgels look very similar to each other. The most dramatic differences between the three situations can be immediately visualized close to the VPT. Under these conditions, corresponding to the second and third columns of Fig. 8, in the presence of explicit counterions the microgel appears to be made of a core and of a rather inhomogeneous corona. In fact, the most external chains do not completely collapse even when α = αVPT, as they form small clusters between themselves while, at the same time, remaining clearly distinct from the homogeneous dense core. It is only when α significantly exceeds αVPT that they get slowly incorporated within the core. We stress that this behavior is completely different from the observation of globule-like domains during a quench from the swollen to the collapsed state that was reported in several simulation works on neutral microgels.57,59,65 In that case, such domains were found only during a transient regime, quickly disappearing at long times. Here such behavior is found in the final equilibrium states at intermediate α-values, genuinely indicating the stable presence of such inhomogeneities in the microgel structure across the VPT. On the other hand, these features are absent (in the long-time regime) both for neutral microgels and for microgels with implicit charges, where the collapse of the microgel is clearly homogeneous across the VPT, independently of the value of λD. These results can be explained by the fact that, for implicit charges, the competition between the electrostatic repulsion and the solvophobic attraction just shifts the occurrence of the VPT to larger values of α, because a larger amount of attraction is needed to compensate the additional monomer–monomer repulsion. However, when counterions are explicitly included, they provide the system with additional degrees of freedom, thus being able to compensate the balance between attraction and repulsion even locally. This creates inhomogeneities in the charge distributions which significantly alter the microgels internal profiles, giving rise to a distinct core–corona pattern close to the VPT.
We note that, as evident from Fig. 8, in our model the outer chains of the microgel are found in closed loops, rather than as dangling ends. This is a consequence of our assembly process. While we plan to address possible differences in the structure of microgels in the presence of dangling ends in future works, we expect that the observed features of the microgel collapse in presence of charges should not depend on this aspect, since both neutral and charged microgels are assembled in the same way.
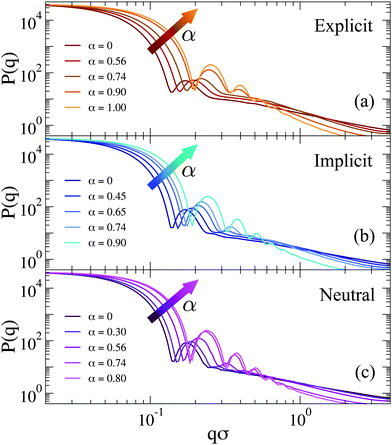 | ||
| Fig. 9 Form factors for (a) explicit counterions (EC), (b) Debye–Hückel (DH, λD = 1.30σ) and (c) neutral microgels across the VPT. Data for charged microgels refer to f = 0.20. | ||
To better discuss the features of the form factors with explicit counterions, a zoom of the data is reported in Fig. 10. For α < αVPT, where we cannot rely on a fuzzy-sphere-like model, P(q) displays two distinct behaviors after the first peak, both of which are compatible with power law dependences. The first regime occurs for 0.2 ≲ qσ ≲ 0.6, where P(q) ∼ q−δ1 with the exponent δ1 being rather constant for α < αVPT, i.e. δ1 = 0.75 ± 0.05. These q-values correspond to length scales within the corona region of the microgel. At larger q the form factors exhibit a crossover to a second regime characterized by a different apparent power law. The position of the crossover, marked with vertical lines in Fig. 10, shifts from qσ ∼ 0.55 at α = 0 to qσ ∼ 0.65 at α = 0.74. For such second regime, a power law description of the data as P(q) ∼ q−δ2 gives an exponent δ2 strongly dependent on α (from ∼1.2 at α = 0 up to ∼1.8 close to the VPT). The fact that a similar power-law dependence in the first q-regime seems to hold for swollen microgels up to the VPT suggests that the outer corona structure remains roughly constant for this range of temperatures. By contrast, the increase of the apparent exponent at larger q-values suggests that for smaller length scales the structure feels the effect of the underlying interactions, which modify the fractal properties of the network. However, at such large values of q, beyond 2σ−1, the data suffer from finite-size effects (as it can be observed by the onset of a minimum, which precedes the occurrence of the model-dependent monomer–monomer peak at qσ ∼ 2π57). We have thus limited our analysis here and in the following to the range qσ ≲ 2, in which we have attempted a few types of different fits, going beyond the power-law behavior which cannot be considered to be very reliable in such a limited range of q (changing by only a decade).
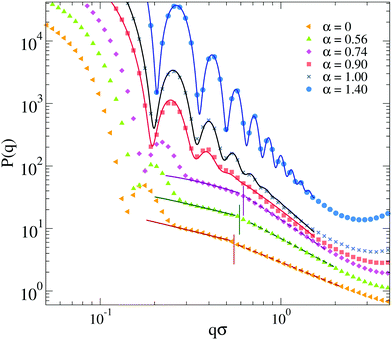 | ||
| Fig. 10 Zoom of the form factors of Fig. 9a for microgels with explicit counterions (EC) for f = 0.20 and relative fits. Symbols are simulation data below (α = 0, 0.56, 0.76) and above (α = 0.90, 1.00, 1.40) the VPT. Below the VPT: full lines are fits with a modified Lorentzian (eqn (12)) for the q-range that goes from the first peak of P(q) up to the correspondingly coloured vertical line; dashed lines are fits with a different modified Lorentzian function in the range starting from the vertical line up to qσ ≲ 2. In all cases, for qσ ≳ 2 data are affected from finite-size effects. Above the VPT: lines are fits according to an extended fuzzy sphere model (eqn (11)) plus a modified Lorentzian (eqn (12)). Data sets for different α are arbitrarily shifted on the y-axis to improve readability. | ||
Among the available models, we found that the modified Lorentzian defined in eqn (12) is able to separately describe both regimes for α < αVPT, as shown in Fig. 10. Interestingly, the fractal exponents D1 and D2 extracted from the fits in the two regimes, reported in the ESI† (see Section S3), closely match the apparent power-law exponents described above. Thus, a roughly α-independent value of D1 is found for small q, while a larger value of D2 is obtained, which rapidly increases with α. These two parameters refer to the fractal dimensions of the correlated domains in the network over the corresponding ranges of length scales. They are coupled to two characteristic lengths, ξ1 and ξ2, which quantify the correlation lengths among such domains.56 These lengths are both found to decrease with α, in agreement with expectations. Most importantly, we find in all studied cases that ξ1 > ξ2. This suggests that the behavior of the form factors in the swollen state and up to VPT is compatible with a network with different characteristic domains occurring in the corona and in the core region, respectively. Within the corona region (first regime), the correlation length is quite large, reflecting the few domains (visible in the snapshots of Fig. 8) that are quite far apart from each other. The fractal dimension of such environments is rather low and unaffected by changes in α, reflecting the fact that the corona remains clearly distinct from the core, up to the VPT and beyond. Instead, within the core region (second regime), the domains correlation length is much smaller and it rapidly decreases with α, while the fractal dimension is larger and increases with α, consistent with the shrinking of the core. The trend of these parameters in the second regime is consistent with that found for α > αVPT, in which we use an extended fuzzy sphere model plus a modified Lorentzian. Here the core–corona distinction gets less and less pronounced, suggesting that we do not need two Lorenztian terms any longer to fit the data. Further discussion on the reliability of the fits and a comparison of the extracted fit parameters with the implicit and neutral microgel models is reported in the ESI.†
Interestingly, a qualitatively similar behaviour has been reported in an experimental study of PNIPAM microgels at high crosslinking concentration.66 In this work the form factors at various temperatures have been measured finding that, at intermediate and high q-values, a similar two-step decay of P(q) was observed. The authors attribute this behavior to the presence of a core and a surrounding shell having different fractal dimensions and correlation length of the polymer mesh. However, the nature of inhomogeneities is different between these experiments and our simulations. Indeed, in the former case, they arise from a sensible difference in the concentration of crosslinkers among the core and the external shell, which also leads to a difference in the solvophobic properties of the network in the two regions. Instead, in our model they stem from the competition among attraction and electrostatic repulsion. Nevertheless, this proves that such inhomogeneities can be observed in scattering experiments, also with microgels size of the order of ∼1 μm. It would be desirable to assess this scenario also in ionic microgels in the near future. At present, to the best of our knowledge, experimental form factors are available for an extended range of wavevectors only in a few studies, which unfortunately do not analyse their variation as a function of the temperature.7,67 In addition, other studies report P(q) only in a limited q-range68,69 or for different types of microgels, obtained through microfluidic techniques8 and IPN microgels,70 for which it is not possible to make a meaningful comparison with respect to our numerical model.
From all the evidence gathered in this part, we can conclude that, in our model, below the VPT the competition between the solvophobic attraction and the repulsive electrostatic interactions, screened by the counterions, gives rise to a rather inhomogeneous structure, characterized by two different regimes. This complicated behaviour cannot be interpreted with a fuzzy-sphere-like description, and a new type of model would be needed to describe form factors in the whole q-range, perhaps inspired by multi-shell models.71,72 On the contrary, neutral microgels and those with implicit charges display a simpler behaviour, and a modified fuzzy-sphere model with a fractal Lorentzian is sufficient to describe the data. To assess these structural features it would be also interesting to compare the present numerical findings with experimental data in the near future.
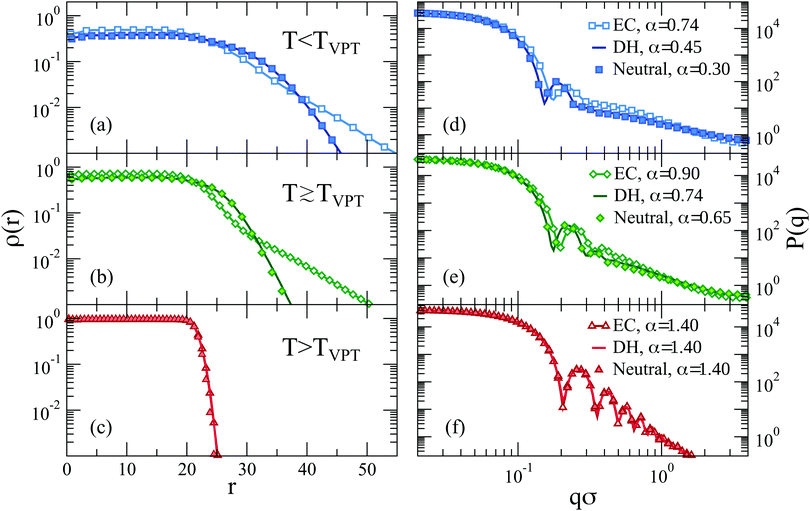
For small values of α, we find that the monomer density inside the core is larger in the explicit charged microgels than in neutral or implicit ones (Fig. 11(a and b)). This is different for what observed for the maximally swollen case (α = 0), shown in Fig. 2(a), where the monomer density in the core was much smaller for the microgels with explicit counterions. This was due to the fact that at α = 0, the size of the microgels was very different. When we compare the models at the same Rg instead, we see that the explicit counterion microgel has more monomers in the core and for large distances, while it is less dense in an intermediate range of distances. These features are maintained even when we cross the VPT, where the corona of the explicit case is much more extended than the neutral and implicit ones. Finally when the complete collapse is achieved, all the microgels have an identical density profile within numerical uncertainty (Fig. 11(c)). We confirm no differences occurring between neutral and Debye–Hückel microgels at comparable Rg in the investigated range of temperatures and of electrostatic parameters.
Similar plots for the form factors are reported in Fig. 11(d–f). Interestingly, despite the microgels having the same Rg, the explicit charged ones clearly show that the first peak of P(q) is shifted to larger q-values. This is because Rg tells us how broad the mass distribution is, and we see from the density profiles that the microgels with explicit counterions have a more extended corona. This is then compensated by a smaller and denser core to produce the same Rg of the other two models. We can infer that the first peak of the form factor is mainly affected by the extension of the core rather than by Rg. Indeed, comparing the three kinds of microgels at the same value of α, Rg is much greater for the explicit model, which thus needs a much higher intensity of the attractive force to reduce its volume. Because of the underlying inhomogeneities, this leads to a denser core, within which the screening is stronger and the attraction larger. In addition, we also confirm that the intermediate q behavior of P(q) is completely different for the microgel with explicit counterions, even slightly above the VPT. It is only for very large values of α (≳1.20) that the structure is the same for all types of microgels.
The present results further suggest that the Debye–Hückel model is always very different from the one with explicit charges and that there seems to be no way to reconcile the two approaches. Thus, one could ask whether there is some other way to modify the parameters of the Debye–Hückel model in order to resemble the features observed in the presence of counterions. To this aim, we would need to bypass the standard definition of the Debye length in eqn (6), which clearly overestimates the screening effects of the counterions present in the core. One possibility would be a phenomenological-like approach in which we consider the value of λD as the one yielding the same Rg of the microgel in the maximally swollen conditions (α = 0). From Fig. 1, we observe that this would be achieved with a much larger value of the Debye length with respect to the effective one, i.e., λD = 3.0σ. We have thus performed additional simulations (not shown) of the Debye–Hückel model for this value of λD as a function of α to try to assess whether in this case the implicit treatment of the charges can give rise to inhomogeneous effects such as with explicit counterions. However, we find that the microgel undergoes a microphase separation at large α and does not resemble at all the case with explicit counterions. We will thus address the case of microgels with very high charge fractions in future works, concluding for the present study that the Debye–Hückel model yields results that appear to be too similar to those of neutral microgels, pointing to the crucial role of counterions in a correct treatment of single-microgel properties.
4 Conclusions
In this work, we carried out extensive numerical investigations of charged microgels, focusing on the single-particle structure and swelling behavior across the volume phase transition. Extending a realistic assembly protocol that we recently put forward in ref. 43 and 44, we now additionally included the effects of charges in two different ways. On one hand, we employed an implicit model where screening effects of the counterions are included through a Debye–Hückel treatment where we varied both the amount of charged monomers and the Debye length. On the other hand, we performed simulations in the presence of explicit counterions, interacting with the charged monomers through a Coulomb repulsion. In both frameworks, we addressed the importance of having an underlying disordered network topology with the desired core–corona architecture, similar to that featured in microgels synthesised through the most common routes.Our results are consistent with common expectations for the behavior of thermoresponsive microgels where charged co-monomers are included in the synthesis. In particular, we find that the size of the microgels in the swollen state increases with the fraction of charged monomers included in the network. Such an increase is also responsible for the occurrence of larger swelling ratios for more charged microgels, confirming the link between charge and softness.18 This is found for both explicit and implicit counterion modeling, thus being a robust feature of charged microgels. We also confirm that the VPT temperature shifts to larger values as the amount of charge increases, in agreement with experimental results.8,9,60,61 However, some of our findings are less obvious than could be naively thought. First of all, while charged microgels are very different with respect to the neutral case below and at the VPT temperature, we find no difference among their collapsed structures, independently on the presence of charges and of the treatment of the counterions, suggesting that at sufficiently high temperatures they eventually reach a homogeneous spherical structure of the same size. Furthermore, specific considerations have been made possible by the use of explicit counterions. In particular, we find that the fully collapsed microgel in the explicit model is not at all free of counterions, which therefore are not expelled from the interior of the microgel upon deswelling. Instead, they are retained inside it in order to balance the increased charge density of the collapsed structure. Thus, counterions freely permeate and screen monomer charges at all temperatures, acting as neutralizers for the polymer network. Only close to the microgel surface we observe the onset of a non-neutral local charge, which manifests just above the VPT temperature in agreement with electrophoretic measurements.10 As a consequence, charged microgels behave as overall neutral objects up to around the VPT temperature, at least in the dilute regime. This property also reflects on the stability of finite concentrations suspensions. Indeed, it was reported73 in low pH experiments (corresponding to f ≈ 0) close to the VPT that both PNIPAM and PNIPAM-co-AAc microgels tend to aggregate as a consequence of the change in the solvent quality. However, this does not happen for neutral and high pH (corresponding to f > 0), for which the suspension of ionic microgels is found to remain stable against aggregation.
We also compared the structure and the swelling of the microgel using the Debye–Hückel model, this being a much more convenient way to treat charges from the theoretical and numerical point of view. It turned out that a qualitative agreement between the explicit and the implicit approaches is unachievable, even using an effective Debye length that was calculated from the density of counterions computed in the explicit case. Our findings indicate that the Debye–Hückel approach is not able to reproduce many important effects that arise in the presence of charges, being mainly able to describe the average effect of screening of counterions onto charged beads over the polymer network. In particular, it fails to take into account the osmotic pressure of both inner counterions, acting in favour of the microgel swelling, and external ones, acting against the swelling. Remarkably, the structural features observed for the Debye–Hückel model are actually much more similar to those of neutral microgels than to the explicit counterions case. The most prominent difference can be noticed in the snapshots of Fig. 8, where the inhomogeneous core–corona structure is augmented by the presence of charges and counterions, a fact that is completely missing in the implicit representation. Strikingly, this reflects on the form factors of the microgels, which show a profile that is incompatible with the a fuzzy-sphere-like model, but rather display the onset of two distinct regimes, each of them compatible with a modified Lorentzian. Gaining a strong theoretical understanding of these intriguing findings will be the subject of future work. A potentially interesting perspective would be to combine our simulations with theoretical approaches24,25 in order to provide some description of the data and perhaps to develop a modified Debye–Hückel approach, which could take into account the inhomogeneity of the microgel, assigning different values of λD to the core and to the corona, respectively. However, how to determine these values a priori (i.e., without estimating them with explicit simulations) remains an open question.
The understanding of the single-particle properties of co-polymerised microgels can be considered as a first step toward a better understanding of interpenetrated network microgels (IPN), wherein PNIPAM and PAAc are organized into two independent, interpenetrated networks, so that the responsiveness to temperature and to pH can be decoupled.74 This particular kind of microgels has recently gathered a lot of interest because of their intriguing fragility behavior: as the amount of charges increase, these systems exhibit features of strong glass-formers, a rather unique example in soft matter.18,19 A recent work75 has put forward the idea that this behavior directly stems from charge effects, which also increase the softness of the particles, as confirmed in the present work. However, other effects could play an important role under these conditions, in particular the ability of microgels to deform, compress and interpenetrate. The understanding of these issues is very timely, having been recently address in super-resolution microscopy experiments combined with rheological measurements76 as well as in simulations of a simple elastic model.77 It would thus be very interesting to address further these issues in future works for both IPN and regular microgels.
Finally, our aim will be to transfer the knowledge from single-particle properties to many-body systems by developing appropriate coarse-grained effective potentials, still retaining the essential ingredients of the microgels, in order to be able to address their structural and dynamical behavior at various concentrations. Hence, by calculating the effective potential between two charged microgels we could validate and refine the effective approaches carried out in recent works on the assembly properties of charged microgels in bulk.12
Conflicts of interest
There are no conflicts to declare.Acknowledgements
We thank J. Ruiz-Franco for valuable discussions. We acknowledge support from the European Research Council (ERC Consolidator Grant 681597, MIMIC).References
- A. Fernandez-Nieves, H. Wyss, J. Mattsson and D. A. Weitz, Microgel suspensions: fundamentals and applications, John Wiley & Sons, 2011 Search PubMed.
- P. J. Yunker, K. Chen, M. D. Gratale, M. A. Lohr, T. Still and A. Yodh, Rep. Prog. Phys., 2014, 77, 056601 CrossRef PubMed.
- L. A. Lyon and A. Fernandez-Nieves, Annu. Rev. Phys. Chem., 2012, 63, 25–43 CrossRef CAS PubMed.
- J. Brijitta and P. Schurtenberger, Curr. Opin. Colloid Interface Sci., 2019, 40, 87–103 CrossRef CAS.
- M. Karg, A. Pich, T. Hellweg, T. Hoare, L. A. Lyon, J. J. Crassous, D. Suzuki, R. A. Gumerov, S. Schneider, I. I. Potemkin and W. Richtering, Langmuir, 2019, 35(19), 6231–6255 CrossRef CAS PubMed.
- R. Pelton and T. Hoare, Microgel Suspensions: Fundamentals and Applications, 2011, vol. 1, pp. 1–32 Search PubMed.
- S. Nöjd, P. Holmqvist, N. Boon, M. Obiols-Rabasa, P. S. Mohanty, R. Schweins and P. Schurtenberger, Soft Matter, 2018, 14, 4150–4159 RSC.
- D. Rochette, B. Kent, A. Habicht and S. Seiffert, Colloid Polym. Sci., 2017, 295, 507–520 CrossRef CAS.
- D. Capriles-González, B. Sierra-Martìn, A. Fernández-Nieves and A. Fernández-Barbero, J. Phys. Chem. B, 2008, 112, 12195–12200 CrossRef PubMed.
- D. Truzzolillo, S. Sennato, S. Sarti, S. Casciardi, C. Bazzoni and F. Bordi, Soft Matter, 2018, 14, 4110–4125 RSC.
- S. Nöjd, P. S. Mohanty, P. Bagheri, A. Yethiraj and P. Schurtenberger, Soft Matter, 2013, 9, 9199–9207 RSC.
- T. Colla, P. S. Mohanty, S. Nöjd, E. Bialik, A. Riede, P. Schurtenberger and C. N. Likos, ACS Nano, 2018, 12, 4321–4337 CrossRef CAS PubMed.
- G. M. Eichenbaum, P. F. Kiser, A. V. Dobrynin, S. A. Simon and D. Needham, Macromolecules, 1999, 32, 4867–4878 CrossRef CAS.
- C. E. Reese, A. V. Mikhonin, M. Kamenjicki, A. Tikhonov and S. A. Asher, J. Am. Chem. Soc., 2004, 126, 1493–1496 CrossRef CAS PubMed.
- A. Scotti, U. Gasser, E. S. Herman, M. Pelaez-Fernandez, J. Han, A. Menzel, L. A. Lyon and A. Fernández-Nieves, Proc. Natl. Acad. Sci. U. S. A., 2016, 113, 5576–5581 CrossRef CAS PubMed.
- U. Gasser, A. Scotti and A. Fernandez-Nieves, Phys. Rev. E, 2019, 99, 042602 CrossRef CAS PubMed.
- A. M. Howe, S. Desrousseaux, L. S. Lunel, J. Tavacoli, H. N. Yow and A. F. Routh, Adv. Colloid Interface Sci., 2009, 147, 124–131 CrossRef PubMed.
- J. Mattsson, H. M. Wyss, A. Fernandez-Nieves, K. Miyazaki, Z. Hu, D. R. Reichman and D. A. Weitz, Nature, 2009, 462, 83 CrossRef CAS PubMed.
- V. Nigro, R. Angelini, M. Bertoldo, F. Bruni, M. A. Ricci and B. Ruzicka, Soft Matter, 2017, 13, 5185–5193 RSC.
- P. G. De Gennes, Scaling concepts in polymer physics, Cornell University Press, 1979 Search PubMed.
- Y. Levin, A. Diehl, A. Fernández-Nieves and A. Fernández-Barbero, Phys. Rev. E: Stat., Nonlinear, Soft Matter Phys., 2002, 65, 036143 CrossRef PubMed.
- A. R. Denton and Q. Tang, J. Chem. Phys., 2016, 145, 164901 CrossRef PubMed.
- T. Colla, C. N. Likos and Y. Levin, J. Chem. Phys., 2014, 141, 234902 CrossRef PubMed.
- A. Moncho-Jordá, J. Chem. Phys., 2013, 139, 064906 CrossRef PubMed.
- A. Moncho-Jordá and J. Dzubiella, Phys. Chem. Chem. Phys., 2016, 18, 5372–5385 RSC.
- A. Denton, Phys. Rev. E: Stat., Nonlinear, Soft Matter Phys., 2003, 67, 011804 CrossRef CAS PubMed.
- C. N. Likos, Microgel Suspensions: Fundamentals and Applications, 2011, pp. 163–193 Search PubMed.
- T. J. Weyer and A. R. Denton, Soft Matter, 2018, 14, 4530–4540 RSC.
- L. Rovigatti, N. Gnan, L. Tavagnacco, A. J. Moreno and E. Zaccarelli, Soft Matter, 2019, 15, 1108–1119 RSC.
- A. Martìn-Molina and M. Quesada-Pérez, J. Mol. Liq., 2019, 280, 374–381 CrossRef.
- H. Kobayashi and R. G. Winkler, Polymers, 2014, 6, 1602–1617 CrossRef.
- H. Kobayashi, R. Halver, G. Sutmann and R. G. Winkler, Polymers, 2017, 9, 15 CrossRef PubMed.
- S. Schneider and P. Linse, J. Phys. Chem. B, 2003, 107, 8030–8040 CrossRef CAS.
- G. C. Claudio, K. Kremer and C. Holm, J. Chem. Phys., 2009, 131, 094903 CrossRef PubMed.
- M. Quesada-Pérez, J. Ramos, J. Forcada and A. Martìn-Molina, J. Chem. Phys., 2012, 136, 244903 CrossRef PubMed.
- M. Quesada-Pérez and A. Martìn-Molina, Soft Matter, 2013, 9, 7086–7094 RSC.
- P. K. Jha, J. W. Zwanikken, F. A. Detcheverry, J. J. De Pablo and M. O. De La Cruz, Soft Matter, 2011, 7, 5965–5975 RSC.
- R. Schroeder, A. A. Rudov, L. A. Lyon, W. Richtering, A. Pich and I. I. Potemkin, Macromolecules, 2015, 48, 5914–5927 CrossRef CAS.
- L. G. Rizzi and Y. Levin, J. Chem. Phys., 2016, 144, 114903 CrossRef CAS PubMed.
- C. Hofzumahaus, P. Hebbeker and S. Schneider, Soft Matter, 2018, 14, 4087–4100 RSC.
- D. Sean, J. Landsgesell and C. Holm, Gels, 2018, 4, 2 CrossRef PubMed.
- M. Quesada-Pérez, J. A. Maroto-Centeno, A. Martìn-Molina and A. Moncho-Jordá, Phys. Rev. E, 2018, 97, 042608 CrossRef PubMed.
- N. Gnan, L. Rovigatti, M. Bergman and E. Zaccarelli, Macromolecules, 2017, 50, 8777–8786 CrossRef CAS PubMed.
- A. Ninarello, J. J. Crassous, D. Paloli, F. Camerin, N. Gnan, L. Rovigatti, P. Schurtenberger and E. Zaccarelli, 2019, arXiv preprint arXiv:1901.11495.
- G. S. Grest and K. Kremer, Phys. Rev. A: At., Mol., Opt. Phys., 1986, 33, 3628 CrossRef CAS PubMed.
- T. Soddemann, B. Dünweg and K. Kremer, Eur. Phys. J. E: Soft Matter Biol. Phys., 2001, 6, 409–419 CrossRef CAS.
- R. J. Hunter and L. R. White, Foundations of colloid science, Clarendon Press, 1987 Search PubMed.
- Y. Levin, Braz. J. Phys., 2004, 34, 1158–1176 CrossRef.
- C. G. Lopez, A. Scotti, M. Brugnoni and W. Richtering, Macromol. Chem. Phys., 2019, 220, 1800421 Search PubMed.
- J. Landsgesell, L. Nová, O. Rud, F. Uhlk, D. Sean, P. Hebbeker, C. Holm and P. Košovan, Soft Matter, 2019, 15, 1155–1185 RSC.
- M. Tuckerman, Statistical mechanics: theory and molecular simulation, Oxford University Press, 2010 Search PubMed.
- M. Deserno and C. Holm, J. Chem. Phys., 1998, 109, 7678–7693 CrossRef CAS.
- S. Plimpton, J. Comput. Phys., 1995, 117, 1–19 CrossRef CAS.
- M. Stieger, W. Richtering, J. S. Pedersen and P. Lindner, J. Chem. Phys., 2004, 120, 6197–6206 CrossRef CAS PubMed.
- G. M. Conley, S. Nöjd, M. Braibanti, P. Schurtenberger and F. Scheffold, Colloids Surf., A, 2016, 499, 18–23 CrossRef CAS.
- M. Shibayama, T. Tanaka and C. C. Han, J. Chem. Phys., 1992, 97, 6829–6841 CrossRef CAS.
- F. Camerin, N. Gnan, L. Rovigatti and E. Zaccarelli, Sci. Rep., 2018, 8, 14426 CrossRef CAS PubMed.
- H. Kobayashi and R. G. Winkler, Sci. Rep., 2016, 6, 19836 CrossRef CAS PubMed.
- A. J. Moreno and F. Lo Verso, Soft Matter, 2018, 14, 7083–7096 RSC.
- P. Holmqvist, P. Mohanty, G. Nägele, P. Schurtenberger and M. Heinen, Phys. Rev. Lett., 2012, 109, 048302 CrossRef CAS PubMed.
- X. Li, J. Zuo, Y. Guo, L. Cai, S. Tang and W. Yang, Polym. Int., 2007, 56, 968–975 CrossRef CAS.
- J. Pinheiro, L. Moura, R. Fokkink and J. Farinha, Langmuir, 2012, 28, 5802–5809 CrossRef CAS PubMed.
- C. Huang, H. Kobayashi, M. Moritaka and M. Okubo, Polym. Chem., 2017, 8, 6972–6980 RSC.
- O. Virtanen, A. Mourran, P. Pinard and W. Richtering, Soft Matter, 2016, 12, 3919–3928 RSC.
- S. Nikolov, A. Fernandez-Nieves and A. Alexeev, Appl. Math. Mech., 2018, 39, 47–62 CrossRef.
- A. Fernandez-Barbero, A. Fernandez-Nieves, I. Grillo and E. Lopez-Cabarcos, Phys. Rev. E: Stat., Nonlinear, Soft Matter Phys., 2002, 66, 051803 CrossRef CAS PubMed.
- J. J. Lietor-Santos, B. Sierra-Martìn, U. Gasser and A. Fernández-Nieves, Soft Matter, 2011, 7, 6370–6374 RSC.
- J. S. Hyatt, A. M. Douglas, C. Stanley, C. Do, T. H. Barker and A. Fernández-Nieves, Phys. Rev. E, 2017, 95, 012608 CrossRef PubMed.
- G. Romeo, L. Imperiali, J.-W. Kim, A. Fernández-Nieves and D. A. Weitz, J. Chem. Phys., 2012, 136, 124905 CrossRef PubMed.
- V. Nigro, R. Angelini, M. Bertoldo, F. Bruni, V. Castelvetro, M. A. Ricci, S. Rogers and B. Ruzicka, J. Chem. Phys., 2015, 143, 114904 CrossRef PubMed.
- M. Bergman, PhD thesis, Lund University, 2019.
- O. Peña-Rodrguez, P. P. González Pérez and U. Pal, Int. J. Spectrosc., 2011 DOI:10.1155/2011/583743.
- N. Al-Manasir, K. Zhu, A.-L. Kjøniksen, K. D. Knudsen, G. Karlsson and B. Nystrom, J. Phys. Chem. B, 2009, 113, 11115–11123 CrossRef CAS PubMed.
- V. Nigro, R. Angelini, M. Bertoldo, V. Castelvetro, G. Ruocco and B. Ruzicka, J. Non-Cryst. Solids, 2015, 407, 361–366 CrossRef CAS.
- A.-M. Philippe, D. Truzzolillo, J. Galvan-Myoshi, P. Dieudonné-George, V. Trappe, L. Berthier and L. Cipelletti, Phys. Rev. E, 2018, 97, 040601 CrossRef CAS PubMed.
- G. M. Conley, C. Zhang, P. Aebischer, J. L. Harden and F. Scheffold, Nat. Commun., 2019, 10, 2436 CrossRef PubMed.
- N. Gnan and E. Zaccarelli, Nat. Phys., 2019, 15, 683–688 Search PubMed.
Footnote |
| † Electronic supplementary information (ESI) available. See DOI: 10.1039/c9sm01253b |
| This journal is © The Royal Society of Chemistry 2019 |

