 Open Access Article
Creative Commons Attribution 3.0 Unported Licence
Uncertainties in contact angle goniometry†
Maja
Vuckovac
 a,
Mika
Latikka
 a,
Kai
Liu
 a,
Tommi
Huhtamäki
a and
Robin H. A.
Ras
 *ab
*ab
aDepartment of Applied Physics, Aalto University School of Science, Puumiehenkuja 2, 02150 Espoo, Finland. E-mail: robin.ras@aalto.fi
bDepartment of Bioproducts and Biosystems, Aalto University School of Chemical Engineering, Kemistintie 1, 02150 Espoo, Finland
First published on 19th August 2019
Abstract
The most widely used method to quantify the wetting properties of surfaces is by measuring contact angles. Even though contact angle goniometry is a powerful technique for characterizing wetting properties, it is not accurate for very hydrophobic surfaces. As the technique relies on image processing, it has inherent errors due to optical limitations, especially near the three-phase contact line. This leads to uncertainties in the positioning of the baseline, which can cause large errors in the measured contact angles. In this paper, we systematically evaluate these errors both theoretically and experimentally, focusing on the importance of image resolution. For ∼9 microliter droplet, displacement of the baseline by a single pixel leads to errors of approximately ±0.5° to ±1° for contact angles up to 150°, and errors increase rapidly in the superhydrophobic regime, up to ±8°. The error in the contact angle can be slightly reduced by increasing the image resolution, but cannot be eliminated entirely.
Introduction
When a liquid droplet is in contact with a solid surface, it will either spread over the surface or remain as a droplet. Whether the liquid will spread or not depends on the ratio between the surface tension (cohesion) force and adhesion force. If adhesion force is much larger than surface tension force, the liquid will wet the surface; if the adhesion force is much smaller than surface tension force, the droplet will bead.1–3 Thus, competition between forces of adhesion and cohesion is essential in the macroscopic behavior of liquids.1,2 Direct measurement of the forces can be done using the Wilhelmy plate method.4,5 However, this technique has several drawbacks: it requires large and uniform samples with strict geometry, an accurate peripheral determination and a relatively large volume of liquid.4,6 Furthermore, an investigation of local wetting properties on a surface is not possible. The easiest way to relate the relative strength of the adhesive and cohesive forces is to observe the contact angle θ between the tangent to the liquid–gas and liquid–solid interfaces at the three-phase contact line, where the liquid comes in contact with the solid surface.1,7,8 The contact angle can be used to define different categories of surfaces: hydrophilic (θ < 90°), hydrophobic (θ > 90°) and superhydrophobic (θ > 150°) surfaces.1 The latter are achieved by combining suitable surface roughness and low-surface-energy materials, and show unique nonwetting properties due to the metastable air layer between the droplet and solid surface. This results in minimal adhesion and friction forces, allowing droplets to shed easily off such surfaces.9–11 Due to these appealing properties, superhydrophobicity shows tremendous potential in industrial applications such as anti-fouling,12,13 self-cleaning7,14 and anti-icing15,16 surfaces. In order to develop next-generation superhydrophobic surfaces and advance them towards real-life applications, characterization of such surfaces needs to be more carefully considered.The characterization of wetting properties of superhydrophobic surfaces has been mainly carried out via measurements of apparent contact angles, which can exhibit a range of values bounded by apparent advancing contact angle at the upper limit and apparent receding contact angle at the lower limit.17,18 An appropriate wetting characterization requires measurement of both the advancing and receding contact angles by increasing and decreasing the volume of the probe droplet, respectively.19 The most commonly used technique for measuring contact angles is the sessile drop method coupled with digital image analysis.19 The sessile drop technique involves placing the liquid droplet on the substrate and capturing the profile of the droplet using a camera (Fig. 1). Image analysis software is employed to estimate the contact angle from the drop profile, for example by using a spherical cap approximation,20,21 polynomial fitting,22,23 tangent line,24 or direct fitting to the numerical solutions of the Young–Laplace equation.25–29 The choice of the image analysis algorithm is important since different algorithms give different values of contact angles.30,31
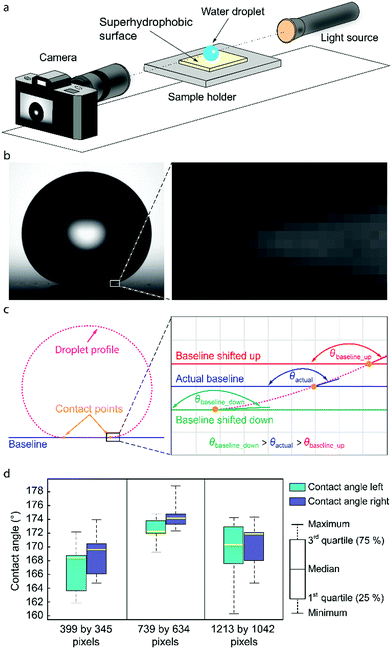 | ||
| Fig. 1 Sessile drop technique for measuring contact angles. (a) Illustration of the sessile drop technique showing water droplet placed on a superhydrophobic surface illuminated by a light source and imaged by the camera. (b) Profile of a water droplet on a superhydrophobic surface with zoom on the contact area illustrating the difficulties in recognition of the correct baseline position. (c) Droplet profile, baseline and contact points used in image processing for determination of the contact angle with zoom in the contact area illustrating the baseline shift and the resulting contact angle change. (d) Results for contact angles obtained by seven independent users using the same image for the analysis as a function of the pixel dimensions of the droplet (the number of pixels along the width and the height of the droplet, see ESI†). | ||
Contact angle goniometry, as a technique that utilizes image processing, is prone to substantial inaccuracies for superhydrophobic surfaces (θ > 150°).32 The area close to the three-phase contact line is distorted or blurred due to optical errors,33–35 leading to systematic errors in the determination of the droplet shape and tangent line (Fig. 1b). This also makes it difficult to accurately determine the location of the baseline, which is the 2D projection of the liquid–solid interface in the side view image, and the intersection points between the droplet profile and the baseline named contact points (Fig. 1c). The uncertainty in the determination of the baseline and the contact points has a significant effect on the accuracies of the measured contact angles35–37 as illustrated in Fig. 1c.
The uncertainties in droplet profile and establishing the baseline strongly depend on the image resolution. An uncertainty as small as 1 μm in baseline location or measured droplet height can lead to uncertainty as large as 10° in measured contact angle.38 For specific image resolution, one subpixel or pixel may correspond to a few μm, and thus uncertainty in contact angle can be even larger than 10°.30
Despite many attempts to improve contact angle measurements,19,30,39–43 the technique remains to a certain degree subjective and depends on the experience and skillfulness of the user. Even for a tiny deviation of the optical path from the horizontal or for a slight tilt of the sample, errors in the measured contact angle can be significant. The measured contact angles strongly depend on the details of how the experiments were performed, such as the used magnification, applied contrast, and whether the baseline positioning is done automatically or manually. Automatic baseline detection can fail and result in incorrect contact angle values (see ESI,† Fig. S1). The results obtained by independent, experienced scientists can also easily vary up to a dozen degrees30,38 even if the same experimental conditions were used, and up to 10° if the same image is analysed (Fig. 1d and ESI,† Fig. S1).
In this article, we study the sensitivity of contact angle measurements to the shift of the baseline for one pixel up or down for different pixel dimensions of the droplet in case of hydrophobic surfaces. Here the pixel dimensions of the droplet refers to the number of pixels along the width and the height of the droplet. By changing the magnification of the camera, we change pixel dimensions of the droplet to estimate how image resolution will affect contact angle measurements both experimentally and theoretically. However, it is crucial to note that high image resolution (i.e., number of pixels) alone does not guarantee more accurate results, as optical resolution determines how small details can be resolved in the recorded image. We analytically and numerically modeled the errors in contact angles produced by shifting baseline for different magnifications. We also experimentally measured the errors in contact angles created by baseline shifting using the available commercial instrument and the same droplet throughout the analysis to eliminate the effect of other error sources such as surface inhomogeneity. Both modeled and experimental data show a decrease of uncertainties with increasing pixel dimensions of the droplet, suggesting that errors in contact angle measurements can be reduced, but not eliminated, by a more performant imaging system.
Theory
Analytical droplet profile
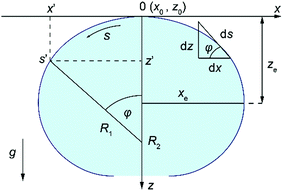
The shape of a sessile droplet (Fig. 2) is theoretically described by the Young–Laplace equation26,44–46 which relates the pressure difference, ΔP, across the curved liquid interface with two principal radii at the apex, R1 and R2, and the surface tension, γ: | (1) |
Eqn (1) can then be recast as a set of three first-order differential equations for the spatial positions x and z and the turning angle θ of the interface as a function of the arc length, s, as depicted in Fig. 2. By using dimensionless variables x* = xc1/2, z* = zc1/2, b* = bc1/2, s* = sc1/2, where  , λc is the capillary length, γ is liquid surface tension, Δρ is the difference between liquid and air density, and g is gravitational acceleration, the first-order differential equations can be written in the following form:
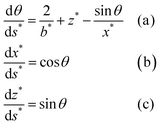 | (2) |
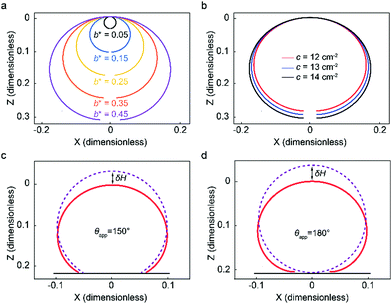
The system of differential equations (eqn (2)) for given b* and c values is solved using the solver in MATLAB®, ode45, which utilizes the fourth-order Runge–Kutta method.45,47Fig. 3a illustrates how sessile droplet profiles derived from Young–Laplace equation change with different b* parameter while keeping c parameter fixed to 13.45 cm−2, the value for water at room temperature. Droplet profiles calculated with a small b* value correspond to small droplet volumes and appear spherical since their size is smaller than or comparable to the capillary length and gravity has little to no effect on their shape. When the b* value is increased, the droplet profiles are flattened due to gravity and thus their dimension in the x direction is larger than in the z direction. Fig. 3b shows how a change in c parameter affects the droplet shape while keeping the b* parameter fixed at 0.43, which approximately corresponds to an 8.8 μl water droplet. Different values of c can, for example, reflect the density and surface tension changes caused by small temperature fluctuations around room temperature. The shape and size of the droplet profiles do not appear to change significantly for the range of c values shown in Fig. 3b.
To calculate analytical drop profile for a specified volume and contact angle, we need to find the solution for eqn (2) and determine the value for parameter b*, which is not trivial. First, we set an initial value for b*, calculate the droplet profile using the specified contact angle and evaluate the droplet volume. If the volume does not match the specified volume, b* is adjusted and the profile is calculated again. This iteration process is repeated until the correct volume is achieved. In Fig. 3c and d we show the profiles of water droplets evaluated by solving eqn (2) with a fixed volume of 8.8 μl and apparent contact angles of 150° and 180°. Droplet shape can also be approximated as a spherical cap with a radius  . The difference between the height of the apex using spherical cap approximation and the height of the apex including gravitational sagging is denoted by δH. As can be seen from Fig. 3c and d, δH is larger for higher apparent contact angles, leading to the failure of the spherical cap approximation. Thus, special care is needed when choosing the method for calculating the theoretical droplet profile.
Numerically calculated contact angles
To numerically model the contact angles, we first fit the experimentally captured droplet profile with the analytical droplet profile. To find the best fit, we define an objective function, E, as the sum of squares of the normal distance, dn, between the measured points, pm, and the calculated curve, l, obtained from the integration of eqn (2) ( , where N is the total number of experimental points). To find dn for each point, first a theoretical curve consisting of approximately 10
![[thin space (1/6-em)]](https://www.rsc.org/images/entities/char_2009.gif) 000 points is generated, and then dn is computed as the distance from the experimental point to the closest of the discrete theoretical points. The objective function depends on four unknown variables: the actual location of the apex xe and ze (Fig. 2), the radius of curvature at the apex, b*, and the capillary length squared, c. To achieve maximal agreement between the analytical Young–Laplace curve and the raw data points, we minimize the objective function concerning the four parameters (∂E/∂qi = 0, i = 1–4). Minimization equations are solved with the Newton–Raphson method using Matlab. Since for a superhydrophobic surface due to high contact angle, the arc length between the contact point and the droplet equator is large, and the area near the three-phase contact line on goniometer image is distorted, the minimization of the objective function does not give the best estimation of b* and c parameters but initial parameters for further analysis. Thus, the locus near the three-phase contact line can be used to find the droplet profile more precisely.46
000 points is generated, and then dn is computed as the distance from the experimental point to the closest of the discrete theoretical points. The objective function depends on four unknown variables: the actual location of the apex xe and ze (Fig. 2), the radius of curvature at the apex, b*, and the capillary length squared, c. To achieve maximal agreement between the analytical Young–Laplace curve and the raw data points, we minimize the objective function concerning the four parameters (∂E/∂qi = 0, i = 1–4). Minimization equations are solved with the Newton–Raphson method using Matlab. Since for a superhydrophobic surface due to high contact angle, the arc length between the contact point and the droplet equator is large, and the area near the three-phase contact line on goniometer image is distorted, the minimization of the objective function does not give the best estimation of b* and c parameters but initial parameters for further analysis. Thus, the locus near the three-phase contact line can be used to find the droplet profile more precisely.46
The loci, P1 with coordinates x1 and z1, and P2 with coordinates x2 and z2, were chosen from the raw data to be close to the contact point (Fig. 4), and were selected from the raw data. Once the loci are selected, the drop-shape function, xAi, can be defined to be xi/b* at the locus Pi with Ai being xi/zi (i is 1 or 2).46 Knowing the drop-shape function, the drop-shape factor can be obtained as the ratio of the drop-shape functions xA1/xA2.46Eqn (2) was then integrated for different c values, initially guessed by best fit described above, to evaluate the drop-shape function and drop-shape factor by finding the suitable range of c values for a specific set of A1 and A2 values. The relationship between coefficients c and b* and the drop-shape function values xA1 and xA2 is constructed by using polynomial equations46c = a0 + a1Q + a2Q2 + a3Q3 and xA2/b* = t0 + t1Q + t2Q2, where Q = xA1/xA2 − 1.46 Polynomial coefficients ai and ti are obtained by fitting46 and calculated in MATLAB®. Once the values of A1 and A2 are selected, the values of P1, P2, x1, x2, z1 and z2 are known from the image and therefore the values of b* and c can be obtained from the polynomial fitting. Once the theoretical Young–Laplace curve fixed by b* and c values is obtained, the baseline is set to be at H distance from the apex (Fig. 4) and the contact angle is the turning angle, φ, at the intercept point between the theoretical sessile droplet profile and the baseline.
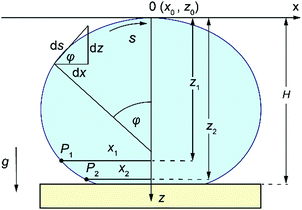 | ||
| Fig. 4 Schematic illustration of selected loci, P1 and P2, from the droplet profile showing parameters x1, x2 and z1, z2, the distances of selected loci from the droplet apex in x and z directions. | ||
Experiments
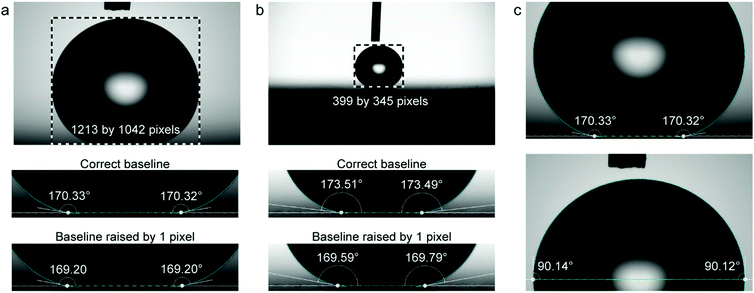
The effect of the pixel dimensions of the droplet was investigated experimentally using a droplet image obtained with Attension Theta contact angle goniometer and Young–Laplace fitting carried out with OneAttension software Version 3.2. An 8.8 μl water droplet was placed on a superhydrophobic copper surface coated with nanorough silver and 1H,1H,2H,2H-perfluorodecanethiol.48 The droplet images were recorded with different magnifications to have different pixel dimensions of the droplet in the image view. Even though we did not use different cameras, the different pixel dimensions can be used to approximate what would be the effect of different camera resolutions. Although the actual number of pixels recorded by the goniometer remains constant, lower magnification reduces the pixel dimensions of the droplet, which is used for the analysis. To obtain the contact angle errors caused by baseline displacement, we first determined the best estimate of the correct baseline positioning by examining the contact region with high magnification in the goniometer software and finding the shortest distance between the contact points. Then we move the baseline up or down 1 pixel from our best estimate of the correct position and examine the change in the measured contact angle. By using the same droplet throughout the analysis, we eliminate the effect of other error sources, such as surface inhomogeneity, and can investigate the effects of baseline errors more accurately.When utilizing the goniometer full camera resolution (1984 by 1264 pixels), raising the baseline for 1 pixel from the estimated correct position causes an error of approximately 1° (Fig. 5a). For a lower magnification image, the apparent size of the droplet is decreased from 1213 by 1042 pixels to 399 by 345 pixels (Fig. 5b). This is similar to using a goniometer with a lower camera resolution. In this case, raising the baseline by 1 pixel causes an error of approximately 4°. There is also a 3° difference between contact angles measured with different magnifications, even when using our best estimates for the correct baseline locations (Fig. 5a and b). This further highlights the uncertainty of contact angle measurements on superhydrophobic surfaces.
In addition to quantifying the effect of pixel dimensions of the droplet, we also studied the error as a function of the contact angle. We achieved this by using the same droplet image and moving the baseline up pixel by pixel, which leads to a gradual decrease in the obtained contact angle and droplet volume (Fig. 5c). Analysing only part of the droplet by raising the baseline is justified, since the shape of the liquid–gas interface is governed only by the Laplace pressure and surface tension, as can be seen from eqn (1).
Results and discussion
The crucial problem of contact angle measurements
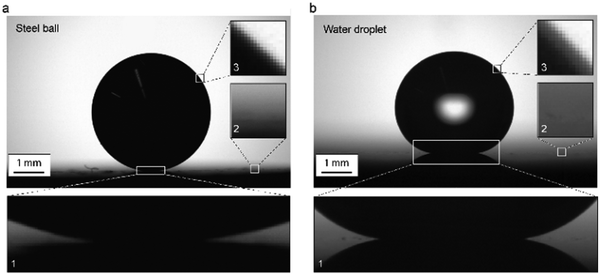
The ideal droplet profile was obtained by analytical modelling shown in Fig. 3c and d. In reality, it is very difficult to measure apparent contact angles of 180° due to optical errors affecting recorded droplet profile. To demonstrate this problem, we used a steel ball, which can be considered as equivalent to a liquid droplet with infinite surface tension and apparent contact angle of 180° (Fig. 6a). For a perfect image of the steel ball sitting on a substrate, one needs to have a flat substrate that is placed perfectly horizontal. Even though efforts were done to place the sample horizontally, the long baseline where the ball meets the substrate seen in Fig. 6a-1 shows that there is a slight tilt in the direction of the camera. Thus instead of having a clear contact point, there is a small part of the contour of the spherical interface in the vicinity of three-phase contact point that becomes undetectable. It is important to note here that the ball-substrate interface (or in case of a droplet the liquid–solid interface) cannot be seen from the image. Therefore, in practice, the liquid–solid interface is determined by extrapolating the air–solid interface in the vicinity of the three-phase contact line, and defined as the baseline. Unfortunately, even if this sounds easy, the diffuse nature of the imaged air–solid interface makes the determination of the baseline difficult (Fig. 6a-2).To determine a contact angle, the edge profile needs to be identified, and theoretical Young–Laplace data and actual physical data need to match. In Fig. 6a-3 it can be seen that even in case of the steel ball, where the contrast should be ideal, there is ambiguity in the ball edge, which causes an additional error to edge detection and thus to contact angle calculations. The numerically calculated contact angle for a steel ball on the flat substrate was 171°. The unavoidable discrepancy in the baseline position leads to an error of 9°. This is a critical issue in contact angle measurements on superhydrophobic surfaces, especially since the mentioned optical problems are even larger for a water droplet than for the steel ball (Fig. 6b and 1b).
The accuracy in image analysis can be improved by developing better algorithms for image analysis, which are based on subpixel edge detection. To introduce subpixel resolution, one first needs to reconstruct the original image in pixel by performing classification in order to determine edge location inside a pixel and divide it into classes based on intensity. By using subpixel resolution in edge detection of the droplet, one needs to have in mind that the discrete structure of a pixel grid significantly reduces edge information.49 Therefore, the edge position with subpixel resolution can only be approximated with some probability as its determination always requires guessing. Furthermore, the subpixel edge detection can be done in various ways, and thus, the errors from such image analysis can vary. For some of them, even if the subpixel resolution is used for edge detection, the accuracy is still at the pixel level. This is primarily due to ill-defined edge points which can disturb the shape of the object.49 Even when the image is carefully reconstructed in subpixel resolution and the edge detection is done with a better precision, still the exact location of the contact points is found using pixel resolution.50 This is because the manually estimated location of the baseline in the horizontal direction is in the pixel resolution not in the calculated subpixel resolution. The vertical position of the contact points can be resolved with subpixel resolution, which usually improves the contact angle determination, but one needs to keep in mind that software cannot accurately find the droplet shape near the contact line due to optical distortions. Simulation of droplet shapes should be done carefully, especially in the vicinity of the contact region, which will be dictated by the wetting properties of the surface.51 It has been shown that for superhydrophobic surfaces with contact angles approaching 180° error in determined contact angles can be up to 5° even when subpixel resolution is used.30
The errors in contact angle produced by one-pixel displacement of the baseline
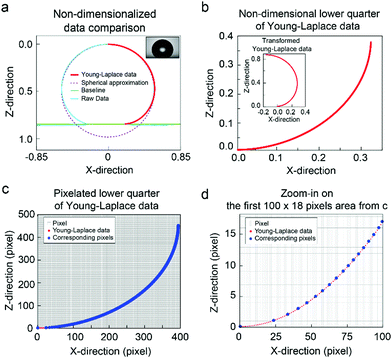
To demonstrate the importance of correct positioning of the baseline, we simulate a one-pixel baseline shift from an actual baseline position. We perform numerical simulations described above, and the results are shown in Fig. 7a. The resulting theoretical drop profiles denoted as Young–Laplace data are matched with physical data indicated as raw data, and by using a modified selected-plane method, the contact angle is calculated to be 174.84°. Then we use Young–Laplace data for simulation of baseline shifting. The spherical cap approximation matches poorly with the original data, which highlights the additional errors produced by choosing the wrong algorithm for image analysis.To evaluate errors in measured contact angles produced by one-pixel displacement of the baseline, the Young–Laplace curve needs to be transformed such that the contact point (intersection point of the droplet profile and baseline) is in origin, as shown in the inset in Fig. 7b. Since we are interested in contact angles from 90° to 180°, we simulate these contact angles for the lower quarter of the Young–Laplace data (Fig. 7b). Pixelation was introduced by scaling non-dimensional curve into pixels and by discretizing the curve in the z-direction. As a result, we have precisely one data point for each vertical pixel (Fig. 7c and d), and thus we can calculate contact angles for a baseline shifted by one pixel. The difference between the contact angles calculated for actual baseline position and for one-pixel displacement is denoted as an error in contact angles and is shown in Fig. 8.
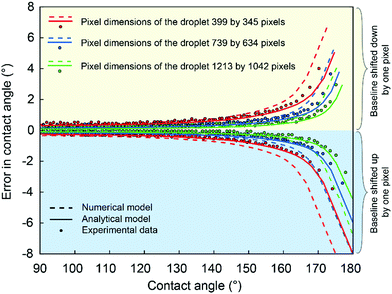
From Fig. 8 it can be seen that generally the contact angle error corresponding to one-pixel displacement is low for small contact angles and increases quickly with increasing contact angle. It should be noted that the errors from the edge detection are not included in the analysis, whereas they are unavoidable in real contact angle measurements and thus the actual contact angle errors may be larger than the ones shown in Fig. 8.
The errors in contact angles for analytical modeling were calculated for analytically obtained droplet profile shown in Fig. 3d in the same way as explained earlier for numerical modeling (Fig. 7c and d). The analytical results present the ideal case with a maximum contact angle of 180° on a homogeneous substrate without image processing, and thus, the errors are smaller. In reality, the errors are larger due to the blurred area around the contact points as shown by the numerical simulations using image analysis. Therefore, for superhydrophobic surfaces, the existing contact angle algorithms based on detection of the contact points will introduce significant error. The experimental errors evaluated using a commercial goniometer software match reasonably well with analytically and numerically calculated errors (Fig. 8) and demonstrate how the errors increase with increasing contact angles. The errors range from 0.5° for contact angles below 150° to 8° for contact angles close to 180°. In this work, we did not take into account the error caused by the drop edge detection, which however is inevitable in real contact angle measurement, and thus the actual contact angle errors can be larger than the error shown in Fig. 8.
The pixel dimensions of the droplet (droplet size in the image) is a very critical parameter in contact angle detection. To demonstrate this, we recorded images of the same droplet using different optical magnifications. First, we used a high magnification on our high-resolution goniometer so that the droplet filled almost the whole captured image (pixel dimensions of the droplet 1213 by 1042, Fig. 5a). This allows us to see in more detail the droplet profile and the contact region on the image. Then we lowered the magnification to obtain smaller images of the droplet, 739 by 634 pixels and 399 by 345 pixels (Fig. 5b), coarsening the droplet edge and the contact region on the image, similar to lower-resolution cameras. The obtained experimental and simulated results are shown in Fig. 8. The contact angle error for one-pixel baseline displacement decreases with increasing pixel dimensions of the droplet, indicating that with a more performant imaging system and sufficient magnification, the uncertainties can be reduced, but unfortunately not eliminated.
Our experiments also highlight the importance of the user experience and details how the experiment was performed. From Fig. 5a and b the significance of chosen magnification can be seen. The lower magnification gives less information about the droplet profile and the contact region (Fig. 5b) compared to the higher magnification (Fig. 5a) and the difference in measured contact angle can be up to 4° depending on where the baseline is placed.
Software-induced errors in contact angle measurements
The experimental analysis of the contact angles was done using OneAttension software Version 3.2. In our experience, the automatic baseline detection does not work well for superhydrophobic surfaces, and thus the user has to determine the correct baseline position manually (ESI,† Fig. S1). Additionally, we noticed that when using a normal full HD (1920 by 1080 pixels) monitor the droplet image available for setting the baseline is shown in a reduced resolution (992 by 632) compared to the camera resolution (1984 by 1264). This reduces the accuracy at which the baseline can be positioned and increases the errors in measured contact angles. This problem can be mitigated by the user using an ultra HD monitor or by stretching the software window over several normal monitors.Conclusions
The shape of a droplet placed on a substrate and its contact angle are governed by the ratio between forces of cohesion and adhesion. Therefore, the wetting properties of surfaces can easily be quantified by measuring the contact angles. Even though contact angle measurement is a standard technique for characterizing wetting properties suitable for a broad range of contact angles, it can be problematic for superhydrophobic surfaces. As an image processing technique, it carries inevitable inaccuracies due to optical limitations, especially near the three-phase contact line. We show that positioning the baseline is difficult and errors of one pixel or more can occur easily. As a result, the existing contact angle algorithms will introduce significant errors when they are used to evaluate the contact angle for the superhydrophobic surfaces, especially for the large contact angles (θ > 170°).We show that the contact angle errors caused by one-pixel displacement of the baseline are significant in commercial method, numerically fitted droplet profiles and even analytically calculated profiles. The errors increase rapidly with increasing contact angle and they can be reduced by a more performant imaging system, but unfortunately, they cannot be eliminated entirely. The results were obtained using Attension Theta goniometer and OneAttension software version 3.2 and will likely be somewhat different for other goniometers with their own internal biases and accuracies due to different optical systems and image analysis methods. However, the overall conclusions should be valid for contact angle goniometry in general.
For developing the next generation of superhydrophobic surfaces, we encourage the research community to rethink the relevance of contact angle measurements and to consider more precise force-based characterization technologies. Recently, sensitive force-based methods with enhanced accuracy have been developed for the characterization of superhydrophobic surfaces. Oscillations of magnetic water droplets allow measurement of friction forces between droplet and surface with nanonewton sensitivity9 while adhesion forces between droplet and surface can be measured and mapped by scanning droplet adhesion microscopy with sensitivity down to nanonewton.11
Conflicts of interest
MV, ML and RHAR have developed alternative wetting characterization techniques, are inventors of related patent applications, and are considering potential commercialization partly supported by Business Finland and ERC.Acknowledgements
The authors acknowledge funding from European Research Council grant ERC-2016-CoG (725513-SuperRepel) and the Academy of Finland Centres of Excellence Programme 2014–2019. The authors acknowledge Dr. Matti Hokkanen, Dr. Cunming Yu, Sakari Lepikko, Junaid Muhammad and Daniel Rapinoja de Carvalho for helping in the collection of the data for Fig. 1d.References
- E. Y. Bormashenko, Wetting of Real Surfaces, Walter de Gruyter GmbH, Berlin/Boston, 2013 Search PubMed.
- P.-G. de Gennes, F. Brochard-Wyart and D. Quéré, Capillarity and Wetting Phenomena Drops, Bubbles, Pearls, Waves, Springer, New York, 2003 Search PubMed.
- M. E. Schrader, Langmuir, 1995, 11, 3585–3589 CrossRef CAS.
- C. Della Volpe and S. Siboni, Surf. Innov., 2017, 6, 120–132 CrossRef.
- Y.-L. Lee, Langmuir, 2002, 15, 1796–1801 CrossRef.
- J. A. Kleingartner, S. Srinivasan, J. M. Mabry, R. E. Cohen and G. H. McKinley, Langmuir, 2013, 29, 13396–13406 CrossRef CAS PubMed.
- W. Barthlott and C. Neinhuis, Planta, 1997, 202, 1–8 CrossRef CAS.
- A. Marmur, in Contact Angle, Wettability and Adhesion, ed. K. L. Mittal, CRC Press, 1st edn, 2009, pp. 3–18 Search PubMed.
- J. V. I. Timonen, M. Latikka, O. Ikkala and R. H. A. Ras, Nat. Commun., 2013, 4, 2398 CrossRef PubMed.
- C. Cottin-Bizonne, J.-L. Barrat, L. Bocquet and E. Charlaix, Nat. Mater., 2003, 2, 237–240 CrossRef CAS PubMed.
- V. Liimatainen, M. Vuckovac, V. Jokinen, V. Sariola, M. J. Hokkanen, Q. Zhou and R. H. A. Ras, Nat. Commun., 2017, 8, 1–7 CrossRef CAS PubMed.
- T. Sun, H. Tan, D. Han, Q. Fu and L. Jiang, Small, 2005, 1, 959–963 CrossRef CAS PubMed.
- B. L. Feng, S. Li, Y. Li, H. Li, L. Zhang, J. Zhai, Y. Song, B. Liu and L. Jiang, Adv. Mater., 2002, 14, 1857–1860 CrossRef.
- R. Fürstner, W. Barthlott, C. Neinhuis and P. Walzel, Langmuir, 2005, 21, 956–961 CrossRef PubMed.
- L. Cao, A. K. Jones, V. K. Sikka, J. Wu and D. Gao, Langmuir, 2009, 25, 12444–12448 CrossRef CAS PubMed.
- A. Amirfazli and C. Antonini, in Non-wettable Surfaces: Theory, Preparation and Applications, ed. R. H. A. Ras and A. Marmur, Royal Society of Chemistry, Cambridge, UK, Cambridge, 2016, pp. 319–346 Search PubMed.
- M. Strobel and C. S. Lyons, Plasma Processes Polym., 2011, 8, 8–13 CrossRef CAS.
- L. Gao and T. J. McCarthy, Langmuir, 2006, 22, 2966–2967 CrossRef CAS PubMed.
- T. Huhtamäki, X. Tian, J. T. Korhonen and R. H. A. Ras, Nat. Protoc., 2018, 13, 1521–1538 CrossRef PubMed.
- G. L. Mack, J. Phys. Chem., 2005, 40, 159–167 CrossRef.
- G. L. Mack and D. A. Lee, J. Phys. Chem., 2005, 40, 169–176 CrossRef.
- E. Atefi, J. A. Mann and H. Tavana, Langmuir, 2013, 29, 5677–5688 CrossRef CAS PubMed.
- A. Bateni, S. S. Susnar, A. Amirfazli and A. W. Neumann, Colloids Surf., A, 2003, 219, 215–231 CrossRef CAS.
- M. W. Yang and S. Y. Lin, Colloids Surf., A, 2003, 220, 199–210 CrossRef CAS.
- D. Li, P. Cheng and A. W. Neumann, Adv. Colloid Interface Sci., 1992, 39, 347–382 CrossRef CAS.
- F. K. Skinner, Y. Rotenberg and A. W. Neumann, J. Colloid Interface Sci., 1989, 130, 25–34 CrossRef CAS.
- P. Chen, D. Y. Kwok, R. M. Prokop, O. I. del Rio, S. S. Susnar and A. W. Neumann, Stud. Interface Sci., 1998, 6, 61–138 CAS.
- A. F. Stalder, T. Melchior, M. Müller, D. Sage, T. Blu and M. Unser, Colloids Surf., A, 2010, 364, 72–81 CrossRef CAS.
- P. Cheng, D. Li, L. Boruvka, Y. Rotenberg and A. W. Neumann, Colloids Surf., 1990, 43, 151–167 CrossRef CAS.
- Z. N. Xu, AIP Adv., 2017, 7, 035210 CrossRef.
- X. Zhang, F. Shi, J. Niu, Y. Jiang and Z. Wang, J. Mater. Chem., 2008, 18, 621–633 RSC.
- V. Konduru, Static and dynamic contact angle measurement on rough surfaces using sessile drop profile analysis with application to water management in low temperature fuel cells, Master thesis, Michigan Technological University, 2010.
- Y. Y. Zuo, C. Do and A. W. Neumann, Colloids Surf., A, 2007, 299, 109–116 CrossRef CAS.
- V. D. Sobolev, V. M. Starov and M. G. Velarde, Colloid J., 2003, 65, 611–614 CrossRef CAS.
- C. Dorrer and J. Rühe, Soft Matter, 2009, 5, 51–61 RSC.
- J. Zimmermann, S. Seeger, P. Institut, U. Zürich, C. Zürich and F. A. Reifler, Text. Res. J., 2009, 79, 1565–1570 CrossRef CAS.
- K. Liu, M. Vuckovac, M. Latikka, T. Huhtamäki and R. H. A. Ras, Science, 2019, 363, 1147–1149 CrossRef CAS PubMed.
- H.-J. Butt, I. V. Roisman, M. Brinkmann, P. Papadopoulos, D. Vollmer and C. Semprebon, Curr. Opin. Colloid Interface Sci., 2014, 19, 343–354 CrossRef CAS.
- J. T. Korhonen, T. Huhtamäki, O. Ikkala and R. H. A. Ras, Langmuir, 2013, 29, 3858–3863 CrossRef CAS PubMed.
- S. Srinivasan, G. H. McKinley and R. E. Cohen, Langmuir, 2011, 27, 13582–13589 CrossRef CAS PubMed.
- A. Kalantarian, Development of axisymmetric drop shape analysis, PhD thesis, University of Toronto, 2011.
- M. Hoorfar and A. W. Neumann, J. Adhes., 2004, 80, 727–743 CrossRef CAS.
- Z. N. Xu, Rev. Sci. Instrum., 2014, 85, 125107 CrossRef CAS PubMed.
- S. Y. Lin, H. C. Chang, L. W. Lin and P. Y. Huang, Rev. Sci. Instrum., 1996, 67, 2852–2858 CrossRef CAS.
- C. Huh and R. L. Reed, J. Colloid Interface Sci., 1983, 91, 472–484 CrossRef CAS.
- Y. L. Hung, Y. Y. Chang, M. J. Wang and S. Y. Lin, Rev. Sci. Instrum., 2010, 81, 065105 CrossRef PubMed.
- R. A. Brown, F. M. Orr and L. E. Scriven, J. Colloid Interface Sci., 1980, 73, 76–87 CrossRef CAS.
- I. A. Larmour, S. E. J. Bell and G. C. Saunders, Angew. Chem., Int. Ed., 2007, 46, 1710–1712 CrossRef CAS PubMed.
- A. Fabijanska, Int. J. Appl. Math. Comput. Sci., 2012, 22, 695–710 Search PubMed.
- S. F. Chini and A. Amirfazli, Colloids Surf., A, 2011, 388, 29–37 CrossRef CAS.
- C. W. Extrand and S. I. Moon, Langmuir, 2010, 26, 17090–17099 CrossRef CAS PubMed.
Footnote |
| † Electronic supplementary information (ESI) available. See DOI: 10.1039/c9sm01221d |
| This journal is © The Royal Society of Chemistry 2019 |

