 Open Access Article
Creative Commons Attribution 3.0 Unported Licence
Gravity-driven syneresis in model low-fat mayonnaise†
Qimeng
Wu
a,
Melle T. J. J. M.
Punter
 b,
Thomas E.
Kodger
 a,
Luben
Arnaudov
c,
Bela M.
Mulder
b,
Simeon
Stoyanov
ac and
Jasper
van der Gucht
*a
aPhysical Chemistry and Soft Matter, Wageningen University and Research, Stippeneng 4, 6708 WE, Wageningen, The Netherlands. E-mail: qimeng.wu@wur.nl
bAMOLF, Department of Living Matter, Amsterdam, The Netherlands
cUnilever Research and Development, Vlaardingen, The Netherlands
First published on 31st October 2019
Abstract
Low-fat food products often contain natural, edible polymers to retain the desired mouth feel and elasticity of their full-fat counterparts. This type of product, however, can suffer from syneresis: densification due to the expulsion of fluid. Gaining insight into the physical principles governing syneresis in such soft hybrid dispersions remains a challenge from a theoretical perspective, as experimental data are needed to establish a basis. We record non-accelerated syneresis in a model system for low-fat mayonnaise: a colloid polymer mixture, consisting of oil in water emulsion with starch in the aqueous phase. We find the flow rate of expelled fluid to be proportional to the difference in hydrostatic pressure over the system. The osmotic pressure of the added starch, while being higher than the hydrostatic pressure, does not prevent syneresis because the soluble starch is lost to the expelled fluid. From these findings, we conclude that forced syneresis in these systems can be described as a gravity-driven porous flow through the densely packed emulsion, explainable with a model based on Darcy's law.
1 Introduction
The acute awareness of the relationship between dietary fat and hypertension, the development of cardiovascular diseases, and obesity has stimulated the need among consumers for food products with reduced fat content.1–3 To retain the desired mouth feel and elasticity of their full-fat counterparts, low-fat food products often contain natural, edible polymers.4 Upon addition of these polymers, however, this type of products can suffer from syneresis: densification due to the expulsion of fluid, usually characterized by the appearance of the continuous phase at the bottom of a scoop, while the scoop retains its initial shape and does not flow on the macroscopic scale. Yet, on the microscopic scale, the material must undergo flow leading to progressive fluid accumulation at the bottom of the scoop, which is considered undesirable. Understanding the physics that govern this phenomenon is crucial to predict and control the properties of such soft hybrid dispersions for product stability against scoop syneresis.Mayonnaise is an oil in water emulsion comprised of dispersed sunflower oil droplets suspended in a continuous phase of water, and stabilized by egg yolk proteins and phospholipids. The rheology of an emulsion depends strongly on the volume fraction of the dispersed phase: at approximately 80 vol% of the dispersed phase, typical of mayonnaise, oil droplets pack together, causing deformation of their interfaces. This repulsive force between the jammed droplets gives mayonnaise its elastic, paste-like behavior. Syneresis does not occur in such full-fat mayonnaise, as an expulsion of fluid requires an applied pressure in excess of the droplet Laplace pressure to further deform the close-packed individual droplets; the scoop-induced hydrostatic pressure difference is a few orders of magnitude lower than the droplet Laplace pressure. When decreasing the volume fraction of the dispersed phase below a critical value, however, the elastic modulus decreases significantly.5,6 To recover the elasticity at low volume fraction, water-soluble (bio)polymers are added. Being an abundant, affordable and natural edible polysaccharide, starch is widely used to control the stability and texture of many food products.7 Starch is a complex composite system, composed of amylose and amylopectin, occurring naturally as insoluble, semi-crystalline granules.8 After heating in water, the starch suspension converts into a turbid viscoelastic paste, in which starch exists in various forms: water-soluble individual polymers, water-swollen starch microgels, and water-insoluble granules.9 At sufficiently high starch concentrations a network forms, consisting of an amylose matrix with deformable swollen granule fillers.10 In addition to the network constructed by starch, soluble starch polymers induce depletion attraction between oil droplets. When droplets are at high enough volume fraction, they may form a space spanning, dynamically arrested network, which can form a colloidal gel.11–13 Both of these networks impart elasticity to the low-fat mayonnaise. Yet, if this elasticity is of insufficient magnitude or breaks down when stressed, the product may experience syneresis. Syneresis is a dynamic process that depends on the interaction forces between the structural elements of the system and external driving forces, such as hydrostatic pressure difference.14
While numerous studies have shown that syneresis of casein gels in cheese is due to rearrangements of the network of casein particles in response to internal stresses, forced syneresis in colloid polymer mixtures like low-fat mayonnaise under external stresses remains largely unexplored.15–17 A common approach in studying syneresis is through accelerated measurements, such as centrifugation, which can be powerful for certain types of instabilities of food emulsions.18,19 However, the magnitudes of the forces involved in the force balance governing syneresis are not necessarily accelerated proportionally, which may lead to different conclusions in accelerated compared to non-accelerated tests.
In this study, we follow the syneresis of model low-fat mayonnaise systematically under hydrostatic pressure difference in a non-accelerated fashion. We explore the effect of added starch on the osmotic pressure and the elasticity of the material and investigate the composition of the expelled fluid during syneresis. Our results indicate that syneresis can be described as a gravity-driven flow of fluid through a porous medium formed by the hybrid colloid–polymer network.
2 Experimental
2.1 Scoop syneresis
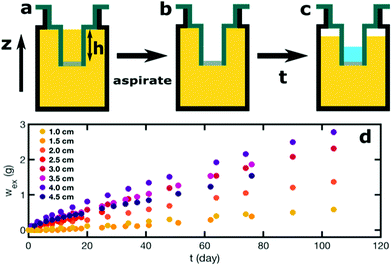
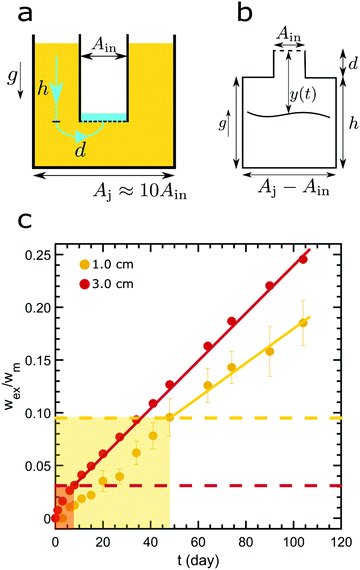
Model low-fat mayonnaise is formulated with 52 vol% sunflower oil and 48 vol% aqueous phase. The aqueous phase contains 4 wt% native rice starch, 7 wt% egg yolk, 5 wt% vinegar and 2.8 wt% NaCl. Native rice starch (4 wt%) (Sigma Aldrich) is dispersed in Milli-Q water and heated at 90 °C for 5 min while gently stirring. The container is partially sealed with parafilm to reduce evaporation during heating. Milli-Q water is added afterward to compensate for evaporation, thereby retaining a 4 wt% starch suspension. Next, the starch suspension is cooled and equilibrated to 50 °C. The starch suspension is subsequently mixed with the egg yolk, NaCl and vinegar. The model low-fat mayonnaise is produced by the slow addition of oil into the aqueous phase while mixing with a Silverson L5M-A Laboratory Mixer with Emulsor Screens at 5800 rpm. The model low-fat mayonnaise is prepared in two batches with each batch serving as one of the duplicates in the syneresis experiments.To study scoop syneresis in model low-fat mayonnaise systematically, we vary the hydrostatic pressure difference between the mayonnaise surface and the bottom of the scoop. To achieve this, we use 3D printed containers which have two chambers, a smaller inner tube and a larger outer reservoir (Fig. 1a–c). The inner tubes have a diameter of 2 cm with different total heights, h: 1.0, 1.5, 2.0, 2.5, 3.0, 3.5, 4.0, 4.5 cm. The inner tubes are sealed at the bottom with filter paper with a pore size of 4–7 μm. We pour the model low-fat mayonnaise into the container both inside and outside the inner tube, see Fig. 1a. After a week, model low-fat mayonnaise is aspirated from the inner tube so as to make the scoop, inducing a height difference between the surface of the model low-fat mayonnaise in the outer reservoir and the bottom of the inner tube, see Fig. 1b. The period of one week was chosen, because the sample has reached a quasi-steady state after one week, based on preliminary rheological measurements. During storage, the container is covered with a screwed lid and sealed with parafilm to prevent evaporation. We measure the fluid accumulated in the inner tube as a function of time, see Fig. 1c and d. All syneresis experiments are performed at room temperature.
2.2 Osmotic pressure measurement
To validate the osmotic pressure measurements, we use solutions of polyethylene glycol (PEG, 20![[thin space (1/6-em)]](https://www.rsc.org/images/entities/char_2009.gif) 000 g mol−1). PEG is dissolved in Milli-Q water to obtain solutions of 0.55 wt%, 1.5 wt%, 1.85 wt% and 2.9 wt%. The solutions have osmotic pressures of 1 kPa, 3 kPa, 5 kPa and 10 kPa correspondingly. The relationship between the PEG concentration and the resultant osmotic pressure has been calibrated previously.20 PEG solution of 1 kPa is transferred into the dialysis cassettes (Slide-A-LyzerTM, 10 K MWCO, 30 ml, Fisher Scientific B.V.) and immersed in PEG solutions with 3 kPa, 5 kPa and 10 kPa. The weight change of the cassettes is then measured as a function of time until equilibrium is reached.
000 g mol−1). PEG is dissolved in Milli-Q water to obtain solutions of 0.55 wt%, 1.5 wt%, 1.85 wt% and 2.9 wt%. The solutions have osmotic pressures of 1 kPa, 3 kPa, 5 kPa and 10 kPa correspondingly. The relationship between the PEG concentration and the resultant osmotic pressure has been calibrated previously.20 PEG solution of 1 kPa is transferred into the dialysis cassettes (Slide-A-LyzerTM, 10 K MWCO, 30 ml, Fisher Scientific B.V.) and immersed in PEG solutions with 3 kPa, 5 kPa and 10 kPa. The weight change of the cassettes is then measured as a function of time until equilibrium is reached.
Next, native rice starch suspensions with 2, 4 and 6 wt% are prepared as described in Section 2.1. The starch suspensions are transferred into the dialysis cassettes and immersed in different PEG solutions of 3 kPa, 5 kPa and 10 kPa. The weight change of the cassettes with starch suspensions after 24 h of dialysis is measured.
2.3 Rheology measurement
Rheology measurements are performed on a stress-controlled rheometer (Anton Paar MCR 501) with a concentric stainless steel cylinder geometry which has inner and outer cylinder radii of 8.33 and 9.04 mm, respectively, and a volume of 4.5 ml. Two tests are carried out. An oscillatory strain sweep from 0.01% to 1000% at a frequency of 1 Hz and a stress sweep from 0.001 Pa to 100 Pa is applied. In all cases, a solvent trap is used to prevent solvent evaporation. All suspensions are rejuvenated after loading by shearing (![[small gamma, Greek, dot above]](https://www.rsc.org/images/entities/i_char_e0a2.gif) = 1 s−1) for 5 min and left to relax for 30 min before commencing the measurement. This procedure is to eliminate the history dependence of the results.
= 1 s−1) for 5 min and left to relax for 30 min before commencing the measurement. This procedure is to eliminate the history dependence of the results.
3 Results and discussion
3.1 Driving force for scoop syneresis
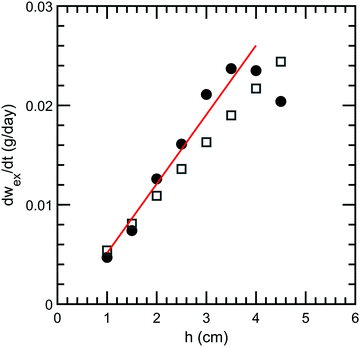
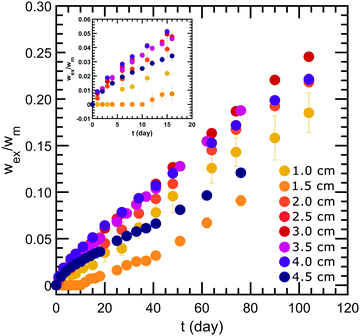
Our forced syneresis experiment is shown schematically in Fig. 1. Model low-fat mayonnaise is poured into a 3D printed container immediately after preparation; this container has two chambers, a smaller inner tube of a total height h, and a larger outer reservoir, see Fig. 1a. The sample is then left to set in the container for one week which allows the microstructure to fully form. After this equilibration period, the material in the inner tube is removed by aspiration to establish a hydrostatic pressure difference, Δp, see Fig. 1b. This height difference mimics a consumer scoop taken from mayonnaise. A gradual accumulation of fluid in the inner tube is seen, as shown in Fig. 1c, which we monitor by carefully measuring the weight of the expelled fluid as a function of time, see Fig. 1d. The fluid expulsion continues for a long time and does not appear to be reaching an equilibrium value, even after 105 days. After a certain period, which is dependent on h, the weight of the expelled fluid appears to be increasing at a near constant rate. This rate is approximately proportional to the height difference h, as shown in Fig. 2. Only for h > 3.5 cm, we find the rate of syneresis to decrease, which might be due to the bottom of the inner tube being spatially close to the bottom of the outer reservoir (the total height of the container is 4.75 cm). The initial linear increase with h is in line with the hypothesis that syneresis in these experiments is driven by the difference in hydrostatic pressure: considering the process as the gravity-driven flow of fluid through a porous medium formed by the droplets and starch network, we expect from Darcy's law a volumetric flux Qs = CΔp, with the proportionality constant C dependent on the permeability of the sample, the geometry of the flow field, and the viscosity of the fluid. Since Δp ∼ h, these results indicate that the proportionality constant C is independent of the height.To further test this, we normalize the expelled weight for each tube height by the theoretical maximum of expelled fluid for that height wm. The latter corresponds to the state where the hydrostatic pressure difference has vanished completely and is approximately proportional to the tube height h. The normalized syneresis curves indeed collapse for a range of tube heights (2–4 cm), reflecting that they share the same normalized flow rate Qs/Δp, see Fig. 3. For the two smallest heights, we see a different behaviour: during the first couple of days, almost no fluid is expelled and syneresis only starts after this delay time. This suggests that there is an energy barrier for syneresis to initiate, which is difficult to overcome if the driving force is small. Nevertheless, after this initial phase, all samples show the same normalized flow rate, which slowly changes over a period of a few months. Note that the driving force Δp changes by at most 25% during the first 100 days, since the amount of expelled fluid after 100 days is about 25% of the maximum, see Fig. 3.
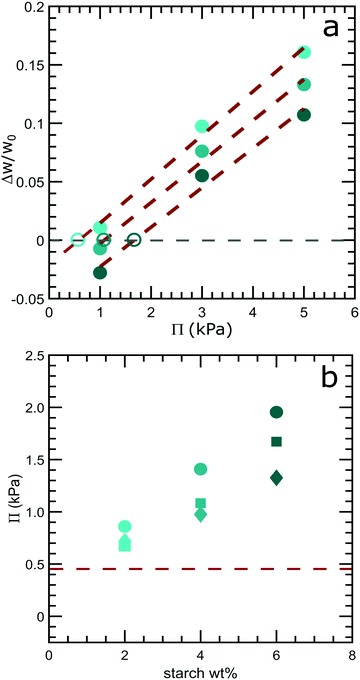
3.2 Osmotic resistance against scoop syneresis
The picture of forced syneresis as hydrostatically driven fluid flow through a porous medium ignores the presence of an osmotic pressure difference between the expelled fluid and the model low-fat mayonnaise. Fluid will be expelled only if the hydrostatic pressure difference is larger than the osmotic pressure difference. Conventionally, osmotic pressure is measured by dialysis when at equilibrium, where there is no mass transfer between inside and outside of a dialysis membrane. However, starch is known to retrograde during storage,21 which may complicate the determination of the osmotic pressure of starch suspensions. We establish a method for determining osmotic pressure under non-equilibrium conditions by dialysis for slurry-like materials, see the ESI† for method validation (Fig. S1). Starch suspensions of 2, 4 and 6 wt% after 8 days of storage are dialyzed against PEG solutions of known osmotic pressure: 1 kPa, 3 kPa and 5 kPa. These pressures are used to limit the volume change of the cassette, which may cause an error in determining the weight change. The weight change of the cassette after 24 h of dialysis, normalized by the initial weight as a function of the osmotic pressure of the dialysis solution, is shown in Fig. 4a. The duration of dialysis is chosen to be 24 h, a compromise between the measurable quantity of weight change and the retrogradation rate of starch. The osmotic pressure of the solution inside the cassette can be found by extrapolation (red dash lines) to the point where there is no weight change during the dialysis, indicated by the grey dashed line in Fig. 4a. At this point, the osmotic pressures inside and outside the cassette are equal. The extrapolated osmotic pressure of 8 days old starch suspensions with 2, 4 and 6 wt% are depicted by the open symbols in Fig. 4a.Utilizing this extrapolation method, we find that starch suspensions after 24 h of dialysis show an increasing osmotic pressure with increasing starch weight percentage, see Fig. 4b. The osmotic pressure of starch suspensions decreases as the storage time increases as shown in Fig. 4b; this is likely to be a consequence of starch retrogradation during storage.21 After 8 days, the osmotic pressure of a 4 wt% starch suspension is approximately 1.1 kPa, which is larger than the largest Δp set by the height difference in the scoop syneresis experiments, which is 0.45 kPa for the 4.5 cm tube as depicted by the red dashed line in Fig. 4b. This would imply that there should be no fluid expelled under the hydrostatic pressure difference in the scoop syneresis experiment.
However, in our syneresis experiments, we do observe the expulsion of fluid, which suggests that the actual difference in osmotic pressure between the expelled fluid and the model low-fat mayonnaise is much smaller. This can be explained if the filter paper is permeable for the soluble component of the starch suspension. Since the osmotic pressure is determined by the number density of molecules, only the soluble fraction of starch contributes significantly to the osmotic pressure of the suspension, while the insoluble granules hardly affect the osmotic pressure. To validate this, we perform a series of tests to investigate the composition of the expelled fluid. The purple color during an iodine test indeed confirms the presence of starch in the expelled fluid (Fig. S2, ESI†), while thermogravimetric analysis (Fig. S3, ESI†) and gel permeation chromatography (Fig. S4, ESI†) indicate that the majority of the soluble starch leaves together with the fluid during the scoop syneresis experiment. We, therefore, assume that the osmotic pressure of the expelled fluid does not differ significantly from that of the model low-fat mayonnaise and that the osmotic pressure does not influence the syneresis process.
3.3 Shear elasticity and yield stress
Another factor that could resist syneresis is the elasticity of the starch network.22 As fluid is expelled, the volume of the hybrid emulsion-starch network decreases, and the resulting compression could lead to an elastic restoring force. To measure the elasticity, we perform rheology experiments on 4 wt% starch suspensions and on our model low-fat mayonnaise, consisting of dispersed oil droplets with 4 wt% starch. For both materials, storage moduli and loss moduli as a function of shear strain are shown in Fig. 5; the storage moduli remain constant, eventually decreasing when the material yields with a corresponding increase in the loss moduli. These features fit the behavior of a soft glassy material.23 Model low-fat mayonnaise has an overall higher storage modulus compared to a 4 wt% starch suspension, implying that an additional network contributes to the elasticity of the model low-fat mayonnaise. Additionally, the yield strain, where the storage modulus starts to decrease, is smaller for the model low-fat mayonnaise than for the 4 wt% starch suspension, see Fig. 5. Indeed, colloidal gels have been shown to be fragile in shear strain.15,24 These observations thus suggest the presence of a space spanning colloidal network, induced by a depletion attraction between the fat droplets caused by the soluble fraction of starch in the model low-fat mayonnaise.25–27 Alternatively, the higher storage modulus in model low-fat mayonnaise compared to 4 wt% starch could be a rigid filler effect for composite suspensions and gels due to the small size and resultant high Laplace pressure of the oil droplets.28 In this case, the relation between the shear moduli and the volume fraction of oil would be described by the empirical Krieger-Dougherty relation.29 However, experimental G* results could not be fitted with this relation (see ESI† Fig. S5), indicating that the increase in modulus is more likely to be due to gelation of the oil droplets.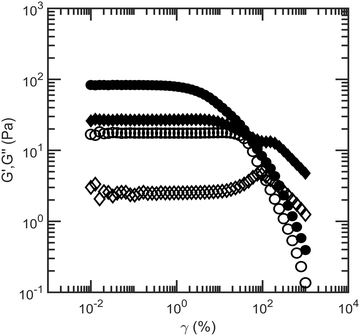 | ||
| Fig. 5 Storage moduli G′ (●) and loss moduli G′′ (♦) of 4 wt% native rice starch suspension (open symbols) and model low-fat mayonnaise (solid symbols) as a function of shear strain amplitude. | ||
The presence of a colloidal droplet network could prevent droplets from flowing together with the fluid during syneresis. To verify this, we test whether the model low-fat mayonnaise has a yield stress that resists the flow of low-fat mayonnaise as a whole. A stress sweep is performed to model low-fat mayonnaise, aqueous phase and 4 wt% starch suspension; the shear rate of each material as a function of shear stress is shown in Fig. 6. The yield stress of the material can be estimated as the stress at which ![[small gamma, Greek, dot above]](https://www.rsc.org/images/entities/i_char_e0a2.gif) ≃ 10−3 s−1 can first be measured in Fig. 6. The apparent yield stress of model low-fat mayonnaise found in this way is higher than that of 4 wt% starch suspension. Notably, both these materials have a relatively low yield stress compared to full-fat mayonnaise and low-fat mayonnaise with other added polymers.30 The smallest Δp in the scoop syneresis experiment, from the 1 cm inner tube, is 100 Pa, which is much higher than the measured yield stress of 0.3 Pa for the model low-fat mayonnaise, implying that the model low-fat mayonnaise should flow even under the smallest hydrostatic pressure difference.
≃ 10−3 s−1 can first be measured in Fig. 6. The apparent yield stress of model low-fat mayonnaise found in this way is higher than that of 4 wt% starch suspension. Notably, both these materials have a relatively low yield stress compared to full-fat mayonnaise and low-fat mayonnaise with other added polymers.30 The smallest Δp in the scoop syneresis experiment, from the 1 cm inner tube, is 100 Pa, which is much higher than the measured yield stress of 0.3 Pa for the model low-fat mayonnaise, implying that the model low-fat mayonnaise should flow even under the smallest hydrostatic pressure difference.
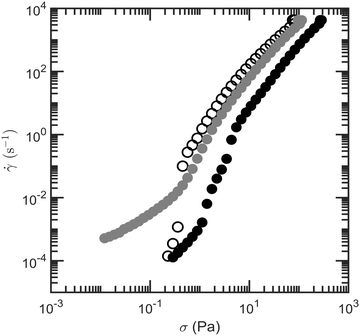 | ||
| Fig. 6 Shear rate of 4 wt% native rice starch suspension (open symbols), model low-fat mayonnaise (black solid symbols) and aqueous phase (grey solid symbols) as a function of shear stress. | ||
3.4 Two-region model for forced syneresis
The scoop syneresis experiment showed that the rate at which fluid is expelled initially decreased and then reached a constant value (Fig. 1d), with a final syneresis rate that is proportional to the height difference h (Fig. 2). To explain these findings, we consider a simple model for flow through a porous medium. We assume that syneresis is driven by the hydrostatic pressure difference Δp = ρg(h − x) where x is the height of the expelled liquid column in the inner tube. Since the hydrostatic pressure difference in all our experiments is much larger than the yield stress of the model low-fat mayonnaise, the emulsion will flow as a whole towards the filter paper. While the continuous phase is expelled, the oil droplets accumulate near the filter paper and form a compacted zone of densely packed droplets. The Laplace pressure of the droplets, γ/2R ∼ 104 Pa is much larger than the hydrostatic pressure difference so that the droplets will not deform significantly. We, therefore, assume that the volume fraction of droplets in the compacted layer is around random close packing, ϕrcp ≈ 0.64. As time progresses, the volume of this compacted zone grows. Further syneresis proceeds by the flow of the continuous phase through this compacted porous bed formed by the compacted droplets. We confirmed that the resistance of the filter paper is negligibly small and that no clogging of the filter paper occurs (see ESI† Section S4) so that the syneresis rate is determined completely by the flow rate of liquid through the porous bed formed by the densely packed droplets.The geometry of the experimental set-up leads to a confinement of the flow towards the filter paper. To account for this geometrical effect in a simplified manner, we develop a 1D-model, in which we divide the flow into two regions: (1) a region right below the filter paper of length d and cross-section Ain where the flow is mostly horizontal, and (2) a region of length h and cross-section Aj − Ain that represents the top part of the container, where the flow is mostly vertical (Fig. 7). Mass balance implies that the velocities in the different zones are related as
| Ainẋ = Ainqh = (Aj − Ain)qv | (1) |
Stage 1: y(t) < d
If y < d, the compacted region is present only in the horizontal region. The volume of the expelled fluid is equal to the volume with which the sample has shrunk due to compaction, so that x(t) = Δϕy(t), with Δϕ = ϕrcp − ϕ0 ≈ 0.12 and ϕ0 = 0.52 the initial volume fraction of oil droplets. Assuming that the flow through the compacted layer can be described by Darcy's law, we get
 | (2) |
 | (3) |
In the scoop syneresis experiment, the height of the expelled fluid column remains much smaller than h, so that h − x ≈ h. With this, the solution of eqn (3) is
 | (4) |
In this regime, the rate of syneresis ẋ is very large initially and then slows down. At time t = t*, the compacted layer reaches the size of the horizontal region, y(t*) = d. The corresponding height of the liquid column is then x* = dΔϕ; with d on the order of Rin = 1 cm, this gives a value for x* on the order of 1 mm.
Stage 2: y(t) > d
Since x* ≪ h, the compacted layer will grow further into the vertical region. The flow now corresponds to two porous layers in series, and the pressure drop is distributed between these two layers. For the horizontal region of size d, Darcy's law gives
 | (5) |
 | (6) |
 | (7) |
3.5 Comparison to experiments
This two-region model gives an explanation for the experimental findings. As long as the compacted region remains in the horizontal region, the syneresis rate slows down due to the growth of the compacted region (eqn (4)). However, when the compacted region enters the vertical region, the syneresis rate stabilizes, because the flow rate in the vertical region is much lower than in the horizontal region. The cross-over between the two stages occurs when x = x* = Δϕd ≈ 1 mm, which corresponds to a weight w* = ρx*Ain ≈ 0.3 g. This is reasonably close to the expelled fluid weight at which the experimental syneresis rate stabilizes. w*/wm is calculated for h = 1 cm and 3 cm, shown in Fig. 7c as dashed lines. Compared with the wex/wm data from the scoop syneresis experiment, it fits reasonably well to where the flow rate starts to be constant, indicating that around w* the transition from stage 1 to stage 2 happened. In the second stage, the rate is proportional to h (eqn (7)). Experimentally, we find ẋ/h = (dwex/dt)/ρAinh ≈ 2 × 10⁻⁸ s−1. The porosity of the compacted region can be estimated from the Kozeny–Carman equation for packed spheres: | (8) |
Using ϕrcp = 0.64 and 〈R〉 = 3 μm (Fig. S8, ESI†), we obtain k = 2 × 10⁻¹⁴ m2. Since the expelled fluid comes from the aqueous phase, we estimate the viscosity of the expelled fluid as the low-shear viscosity of the aqueous/continuous phase, η ≈1 Pa s (Fig. 6). This estimate should be considered as an upper bound, because the aqueous phase contains insoluble components, e.g., water-insoluble starch granules, which are not present in the expelled fluid. By applying the estimated k, we can calculate the constant flow rate in stage 2 for all the heights of the inner tubes based on eqn (7). The calculated flow rates are shown in Fig. 2 as open squares and are in good agreement with the experimental data, solid circles in Fig. 2. Furthermore, using this estimate of η, we find d ≈ 1 cm, which corresponds to the radius of the inner cylinder, Ain. The two-region model thus gives a very good description of the experimental results utilizing the experimental dimensions and known values.
4 Conclusions
We have presented data and analysis which show that syneresis in colloid polymer mixtures like low-fat mayonnaise can be described as a gravity-driven flow of the continuous phase through a densely packed region of particles. A simple 1D-model based on Darcy's law, which accounts for the geometry of the flow field, gives a very good description of the final syneresis rate. For small applied pressures, however, we find a delay period before syneresis starts, indicating that there is an additional energy barrier. This barrier could be related to a delayed collapse of the colloidal network.31,32 It will be interesting to study how these findings are modified for systems which have a yield stress that is on the same order of magnitude as the pressure that drives syneresis. These insights will help in the design of complex soft materials and products with predictable stability.Conflicts of interest
There are no conflicts to declare.Acknowledgements
This work is part of the Industrial Partnership Programme Hybrid Soft Materials that is carried out under an agreement between Unilever Research and Development B. V. and the Netherlands Organization for Scientific Research (NWO). The work of T. E. K. is part of a VENI funding scheme from NWO. The work of J. v. d. G. is part of the SOFTBREAK project funded by a Consolidator grant from the European Research Council.References
- E. H. Asp, Food Policy, 1999, 24, 287–294 CrossRef.
- P. Kris-Etherton, S. Daniels, R. Eckel, M. Engler, B. Howard, R. Krauss, A. Lichtenstein, F. Sacks, S. St. Jeor, M. Stampfer, S. Grundy, L. Appel, T. Byers, H. Campos, G. Cooney, M. Denke, E. Kennedy, P. Marckmann, T. Pearson, G. Riccardi, L. Rudel, M. Rudrum, F. Sacks, D. Stein, R. Tracy, V. Ursin, R. Vogel, P. Zock, T. Bazzarre and J. Clark, J. Nutr., 2001, 131, 1322–1326 CrossRef CAS PubMed.
- M. Nagai, O. Uyama and H. Kaji, Health Educ. J., 2013, 72, 172–179 CrossRef.
- D. J. McClements and K. Demetriades, Crit. Rev. Food Sci. Nutr., 1998, 38, 511–536 CrossRef CAS PubMed.
- T. G. Mason, J. Bibette and D. A. Weitz, Phys. Rev. Lett., 1995, 75, 2051 CrossRef CAS PubMed.
- T. G. Mason, M. D. Lacasse, G. S. Grest, D. Levine, J. Bibette and D. A. Weitz, Phys. Rev. E: Stat. Phys., Plasmas, Fluids, Relat. Interdiscip. Top., 1997, 56, 3150–3166 CrossRef CAS.
- H. Zobel and A. Stephen, Starch: structure, analysis, and application, in Food Polysaccharides and their Application, ed. A. M. Stephen, Marcel Dekker, New York, 1996, pp. 19–66 Search PubMed.
- D. French, J. Jpn. Soc. Starch Sci., 1972, 19, 8–25 CrossRef CAS.
- V. J. Morris, Trends Food Sci. Technol., 1990, 1, 2–6 CrossRef CAS.
- M. J. Miles, V. J. Morris, P. D. Orford and S. G. Ring, Carbohydr. Res., 1985, 135, 271–281 CrossRef CAS.
- W. C. K. Poon, A. D. Pirie and P. N. Pusey, Faraday Discuss., 1995, 101, 65–76 RSC.
- V. Prasad, V. Trappe, A. D. Dinsmore, P. N. Segre, L. Cipelletti and D. A. Weitz, Faraday Discuss., 2003, 123, 1–12 RSC.
- E. Zaccarelli, J. Phys.: Condens. Matter, 2007, 19, 323101 CrossRef.
- T. van Vliet and P. Walstra, J. Food Eng., 1994, 22, 75–88 CrossRef.
- T. van Vliet, H. J. M. van Dijk, P. Zoon and P. Walstra, Colloid Polym. Sci., 1991, 269, 620–627 CrossRef CAS.
- M. Mellema, P. Walstra, J. H. J. Van Opheusden and T. Van Vliet, Adv. Colloid Interface Sci., 2002, 98, 25–50 CrossRef CAS PubMed.
- S. Nöbel, K. Weidendorfer and J. Hinrichs, J. Colloid Interface Sci., 2012, 386, 174–180 CrossRef PubMed.
- P. A. Aichinger, M. Michel, C. Servais, M. L. Dillmann, M. Rouvet, N. D'Amico, R. Zink, H. Klostermeyer and D. S. Horne, Colloids Surf., B, 2003, 31, 243–255 CrossRef CAS.
- T. Amatayakul, F. Sherkat and N. P. Shah, Int. J. Dairy Technol., 2006, 59, 216–221 CrossRef CAS.
- R. P. Rand, Brock University, https://tinyurl.com/y78mxmfh, 2018.
- P. Roulet, W. M. MacInnes, P. Würsch, R. M. Sanchez and A. Raemy, Top. Catal., 1988, 2, 381–396 CAS.
- C. Keetels, T. van Vliet and P. Walstra, Food Hydrocolloids, 1996, 10, 363–368 CrossRef CAS.
- K. Miyazaki, H. M. Wyss, D. A. Weitz and D. R. Reichman, Europhys. Lett., 2006, 75, 915–921 CrossRef CAS.
- J. Kim, D. Merger, M. Wilhelm and M. E. Helgeson, J. Rheol., 2014, 58, 1359–1390 CrossRef CAS.
- A. H. Krall, Z. Huang and D. A. Weitz, Phys. A, 1997, 235, 19–33 CrossRef CAS.
- A. Meller, T. Gisler, D. A. Weitz and J. Stavans, Langmuir, 1999, 15, 1918–1922 CrossRef CAS.
- T. B. J. Blijdenstein, E. van der Linden, T. van Vliet and G. A. van Aken, Langmuir, 2004, 20, 11321–11328 CrossRef CAS PubMed.
- D. B. Genovese, Adv. Colloid Interface Sci., 2012, 171-172, 1–16 CrossRef CAS PubMed.
- R. Pal, J. Colloid Interface Sci., 2002, 245, 171–177 CrossRef CAS PubMed.
- L. Ma and G. V. Barbosa-Cánovas, J. Food Eng., 1995, 25, 409–425 CrossRef.
- J. Sprakel, S. B. Lindström, T. E. Kodger and D. A. Weitz, Phys. Rev. Lett., 2011, 106, 1–4 CrossRef PubMed.
- P. Bartlett, L. J. Teece and M. A. Faers, Phys. Rev. E: Stat., Nonlinear, Soft Matter Phys., 2012, 85, 1–13 CrossRef PubMed.
Footnote |
| † Electronic supplementary information (ESI) available. See DOI: 10.1039/c9sm01097a |
| This journal is © The Royal Society of Chemistry 2019 |

