 Open Access Article
Creative Commons Attribution 3.0 Unported Licence
Bending rigidity of charged lipid bilayer membranes
Hammad A.
Faizi
ab,
Shelli L.
Frey
bc,
Jan
Steinkühler
b,
Rumiana
Dimova
 *b and
Petia M.
Vlahovska
 *d
*d
aDepartment of Mechanical Engineering, McCormick School of Engineering and Applied Science, Northwestern University, Evanston, Illinois 60208, USA
bMax Planck Institute of Colloids and Interfaces, Science Park Golm, 14424 Potsdam, Germany. E-mail: Rumiana.Dimova@mpikg.mpg.de
cDepartment of Chemistry, Gettysburg College, Gettysburg, Pennsylvania 17325, USA
dDepartment of Engineering Sciences and Applied Mathematics, McCormick School of Engineering and Applied Science, Northwestern University, Evanston, Illinois 60208, USA. E-mail: petia.vlahovska@northwestern.edu
First published on 11th July 2019
Abstract
We experimentally investigate the effect of lipid charge on the stiffness of bilayer membranes. The bending rigidity of membranes with composition 0–100 mol% of charged lipids, in the absence and presence of salt at different concentrations, is measured with the flicker spectroscopy method, using the shape fluctuations of giant unilamellar vesicles. The analysis considers both the mean squared amplitudes and the time autocorrelations of the shape modes. Our results show that membrane charge increases the bending rigidity relative to the charge-free membrane. The effect is diminished by the addition of monovalent salt to the suspending solutions. The trend shown by the membrane bending rigidity correlates with zeta potential measurements, confirming charge screening at different salt concentrations. The experimental results in the presence of salt are in good agreement with existing theories of membrane stiffening by surface charge.
1 Introduction
Cells and internal cellular organelles are enveloped by membranes composed primarily of lipid bilayers. Many cell biological functions involve membrane structural and morphological changes.1–3 These processes depend strongly on the mechanical properties of the lipid bilayer. A key characteristic that has been extensively studied is the bending rigidity,4 which quantifies the energy needed to change the membrane curvature. In neutral (charge-free) membranes, the bending rigidity is related to the energy cost for compression and expansion of the inner and outer lipid monolayers in the bent bilayer. Since biological membranes contain charged lipids, e.g., the fraction of phosphatidylglycerol in bacteria Staphylococcus aureus and Caulobacter crescentus can be as high as 80%,5–8 an important question is how the presence of surface charge affects the bending rigidity of lipid bilayer membranes.Surface charge is expected to stiffen the membrane because the repulsion between the charged lipids effectively resists membrane bending. This effect has been extensively studied theoretically within the framework of the Poisson–Boltzmann equation9–19 (reviews on the subject can be found in ref. 20–22). These models, which are strictly valid only for systems with monovalent charges, do predict an increase in the bending rigidity with membrane surface charge.
Experimental data, albeit limited,22 in general support the theoretical results. Of particular interest is the variation of the bending rigidity with surface charge, however, this problem has been investigated either only for relatively low fractions of the ionic species (lipids or surfactants)23–28 or on purely ionic lyotropic systems.29,30 Giant unilamellar vesicles (GUVs) represent a suitable system for systematic measurements on membranes with good control of the composition.31–34 Other advantages of using GUVs are that membranes made of biologically relevant lipids can be studied, and potentially complicating effects due to either high curvature in submicron-sized liposomes or interactions with other bilayers in lamellar stacks are absent. The first attempt to measure the bending rigidity of charged membranes using GUVs was conducted by Song and Waugh25 by tether formation. Membranes made of 1-stearoyl-2-oleoyl-sn-glycero-3-phosphatidylcholine (SOPC) and 1-palmitoyl-2-oleoyl-sn-glycero-3-phosphatidyl-L-serine (sodium salt) (POPS) show negligible stiffening for up to a 16% POPS molar fraction. Using fluctuation spectroscopy of giant unilamellar vesicles, Rowat et al.26 detected a modest increase of 3–5 kBT in the bending rigidity for a membrane system of dimyristoyl phosphatidylcholine with 1–5 mol% ionic surfactants, and Mitkova et al.27 measured an increase of 7 kBT for a 20% fraction of negatively charged lipids in membranes made of SOPC:DOPS (dioleolylphosphatidylcholine) in acidic solutions. Membranes containing larger fractions of charged lipids (up to 40%) were studied by Vitkova et al.28 Micropipette aspiration of giant vesicles made of POPC:POPS mixtures showed an increase in membrane bending rigidity by 10 kBT. However, these experiments were conducted in a high sucrose concentration (0.17 M sucrose), at which sugars bind quite strongly to a lipid bilayer, resulting in membrane lateral expansion and thinning.35 This results in a softer membrane,36,37 making it difficult to isolate the electrostatic contribution to the membrane bending rigidity. Overall, a comprehensive investigation of the bending rigidity as a function of surface charge over a broad range of charged lipid fraction is lacking.
In this paper, we report an experimental study of the dependence of the bending rigidity on the charge content of bilayer membranes using GUVs made of a mixture of neutral and monovalently charged lipids. The whole range of 0–100% lipid charge fraction is explored. We take precautions to minimize the effects of sugars, salt and bilayer asymmetry. We implement two independent non invasive techniques, equilibrium shape fluctuations and time correlations, to measure the membrane bending rigidity. Several new statistical methods are introduced to improve the equilibrium shape fluctuation analysis. The effect of surface charge is also investigated at different ionic strengths of the suspending solution. The experimental results are compared to existing theoretical models of the bending rigidity of membrane systems with monovalent charges.
2 Materials and methods
2.1 Materials
Giant unilamellar vesicles (GUVs) were prepared from lipids, 1-palmitoyl-2-oleoyl-sn-glycero-3-phosphatidylcholine (POPC) and 1-palmitoyl-2-oleoyl-sn-glycero-3-phosphatidyl-(1′-rac-glycerol) (sodium salt) (POPG), using the electroformation38,39 or spontaneous swelling method;40,41 see Dimova and Marques34 for an overview of the preparation methods. The lipids were purchased from Avanti Polar Lipids (Alabaster, AL). The vesicles were fluorescently labeled with 0.05 mol% of 1,2-dioleoyl-sn-glycero-3-phosphatidylethanolamine-N-(lissamine rhodamine B sulfonyl) (ammonium salt), 18![[thin space (1/6-em)]](https://www.rsc.org/images/entities/char_2009.gif) :
:![[thin space (1/6-em)]](https://www.rsc.org/images/entities/char_2009.gif) 1 Liss Rhod PE (Avanti), to detect defects. All other chemicals were purchased from Sigma unless stated otherwise.
1 Liss Rhod PE (Avanti), to detect defects. All other chemicals were purchased from Sigma unless stated otherwise.
2.2 Vesicle preparation
Stock solutions of POPC and POPG at 10 mg ml−1 in chloroform were mixed at different molar ratios to a final concentration of 5 mM. For electroformation, a small volume (5 μl) of lipid solution was spread on the conductive surface of two glass slides coated with indium tin oxide (ITO) (Delta Technologies). The glass slides were then stored under a vacuum for 1–2 hours to remove traces of organic solvent. Afterwards, a 2 mm Teflon spacer was sandwiched between the glass slides and the chamber was gently filled with 20 mM sucrose solution or 20 mM sucrose solution with 1 mM NaCl or 5 mM NaCl. Ultrapure water (22934 HPLC grade, purchased from Fisher Scientific) was used to prepare the sugar/salt suspending solutions. The slides (conductive side facing inward) were connected to an AC signal generator Agilent 33220A (Agilent Technology GmbH, Germany). An AC field of voltage 1.5 V and frequency 10 Hz (for solutions without salt) and 50 Hz (for solutions with salt) was applied for 2 hours at room temperature, resulting in 10–50 μm sized vesicles. They were stored in amber vials at 25 °C and were analyzed within a day of formation.The spontaneous swelling method was also used, especially for GUVs made solely of the charged lipid POPG, which are difficult to electroform. Initially, 30 μl of 5 mM (in chloroform) lipid solution was dissolved in 200 μl of chloroform in a 20 ml vial. Lipid films were formed from evaporation by blowing a N2 stream. Afterwards, the vials were dried under a vacuum for 1–2 hours. The lipid films were hydrated in the suspending solutions (20 mM sucrose solution in 1 mM NaCl) and placed at 60 °C in an oven for 7–8 hours.
After formation, the vesicles were diluted 10 times in 22 mM glucose and NaCl solution (with the same ionic strength) to achieve better optical contrast for vesicle contour detection.
Charged GUVs prepared via electroformation exhibit transbilayer asymmetry right after electroformation but equilibrate after about 24 hours.42 Hence, in order to achieve symmetric leaflets, we analyzed the vesicles 24 hours after electroformation to confirm the absence of tubular structures (tubes are indicative of bilayer asymmetry). We also worked with vesicles under symmetric salt solutions (same concentration inside and outside) to avoid effects associated with membrane curvature.43
To quantify the surface charge in the POPC/POPG membranes, we measured the zeta potential of large unilamellar vesicles (LUVs).44 LUVs were prepared with the extrusion method. Lipid films were evaporated with a stream of N2 from 5 mg ml−1 stock solutions of POPC and POPG in chloroform and then dried under a vacuum for two hours to remove any trace of organic solvent. After that the lipid films were hydrated in their respective aqueous solution (20 mM sucrose with various concentrations of NaCl) to a final lipid concentration of 2.75 mM via 10 minutes of vortexing at room temperature. The vesicles were treated with 7 freeze/thaw cycles in ethanol/dry ice and warm water baths and then extruded 11 times through a 100 nm pore polycarbonate filter (Avanti).
2.3 Measurement of the bending rigidity
We employ the fluctuation spectroscopy technique, which analyses the thermal undulations of a membrane. The details of the procedure are given in ref. 45. In essence, a time series of vesicle contours in the focal plane (the equator of the quasi-spherical vesicle) is recorded. The quasi-circular contour is decomposed into Fourier modes, . The fluctuating amplitudes uq are independent and have a mean square amplitude dependent on the membrane bending rigidity κ and the tension σ
 | (1) |
![[small sigma, Greek, macron]](https://www.rsc.org/images/entities/i_char_e0d2.gif) = σR2/κ.
= σR2/κ.
The equilibrium shape fluctuations are stable and relax with rate46,47
 | (2) |
| C(q,Δt) = 〈uq(t)u−q(t + Δt)〉 = 〈|uq|2〉 exp(−tγq) | (3) |
 | (4) |
Note that eqn (2) assumes that the suspending solution and the solution enclosed by the vesicle have the same viscosity μ, which is approximately the case for our system.
In the experiment, we check that the membrane fluctuation modes are independent by computing the temporal cross correlations
| G(Δt) = 〈uq(t)uq+m(t + Δt)〉 | (5) |
Furthermore, to rule out any effects of external environmental conditions on the fluctuations, we examine if the shape fluctuations uq follow a Gaussian distribution by performing a chi-squared distribution test of every mode number.48 This helps to eliminate vesicles that are close to the cover glass where fluctuations can be modified by nearby small structures (SUVs, LUVs, small GUVs or lipid aggregates) below the optical resolution of the microscope that affect the vesicle fluctuations. We chose only vesicles that passed this test with a confidence interval of 95%.
2.4 Image acquisition and processing
Membrane fluctuations were observed using a phase contrast and epifluorescent microscope (A1 Axio Observer, Zeiss, Germany) with 100× (1.4 NA) and 63× (0.75 NA) (Zeiss, Germany) objectives. High speed video recording and imaging were performed using a SA1.1 high speed camera (Photron, Japan) and Pco.Edge (PCO AG, Kelheim, Germany). Images were acquired at 60 fps but the frame rate was optimized from vesicle to vesicle for equilibrium fluctuation analysis to ensure image acquisition slower than the mode correlation time eqn (2); typical rates ranged from 10 to 20 fps. For time correlations, the image acquisition rate was set to 1000 fps, in order to resolve the mode dynamics on the time scale eqn (2).In order to reduce the influence of the integration time effect, a shutter speed was used corresponding to an exposure time of 200 μs. 10![[thin space (1/6-em)]](https://www.rsc.org/images/entities/char_2009.gif) 000 images were obtained for each set of experiments. Only defect-free quasi-spherical vesicles were analyzed.
000 images were obtained for each set of experiments. Only defect-free quasi-spherical vesicles were analyzed.
We developed our own software for vesicle contour detection. The program was coded and compiled in MATLAB (Mathworks, USA) with the help of in-built MATLAB functions. The software performs three important steps to detect the contour: (i) image processing, (ii) pixel and sub-pixel resolution contour detection and (iii) fitting the vesicle contour by a Fourier series.
Based on the resolution of the microscope and the high speed camera, for a vesicle 20 μm in radius, the number of resolved modes is approximately 20. The fluctuation spectrum is sensitive to the bending rigidity only for modes larger than  (q < qc modes are governed by tension). Hence, we worked with vesicles with low tension values 10−7–10−9 N m−1 and radius size 10–20 μm to ensure low crossover modes qc ∼ 3–7.
2.5 Dynamic light scattering and zeta potential measurements
Zeta potential measurements with GUVs are challenging, hence we used LUVs since their composition and zeta potential correlate well with those of GUVs.44 The zeta potential and vesicle diameter were measured at 22 °C by quasi-elastic light scattering analysis with a Zetasizer ZS90 (Malvern Instruments, Worcestershire, UK) with a HeNe laser (632.8 nm), a scattering angle of 90°, and a temperature controlled cuvette holder. The vesicle size was determined with five dynamic light scattering measurements consisting of 10–20 consecutive runs to obtain intensity size distributions. The diameter of the LUVs formed from the extrusion process for different suspending solutions was in the range 110–170 nm. For the zeta potential, 2.75 mM lipid concentration samples were run in DST1070 folded capillary cells with integral gold electrodes (Malvern). The zeta potential was deduced from the electrophoretic mobility, μe, data using the Henry equation:| ζ = (3μeμ)/(2εwεf(R/λD)) | (6) |
![[thin space (1/6-em)]](https://www.rsc.org/images/entities/char_2009.gif) log(R/λD) + 1, is used when 1 < R/λD < 1000; in this case, for all vesicle solutions containing NaCl (1–100 mM). This dependence was taken into account in the analysis of the zeta potential measurements.49
log(R/λD) + 1, is used when 1 < R/λD < 1000; in this case, for all vesicle solutions containing NaCl (1–100 mM). This dependence was taken into account in the analysis of the zeta potential measurements.49
3 Results and discussion
Fig. 1 shows a typical spectrum of the shape fluctuations and illustrates the q−4 dependence of the mean-squared amplitude on the mode number. For this measurement it is important that the modes are equilibrated, i.e., the acquisition rate (data sampling) is slower than the correlation time of the modes (given by eqn (2)). As seen in Fig. 2a, which plots the time autocorrelation function of modes q = 2…7, all modes above wavenumber 3 are equilibrated after about 0.1 s, suggesting an image acquisition rate of 10 fps. Fitting the data in Fig. 1 with eqn (1) yields κ = 42.1 ± 3.0 kBT and σ = 7 ± 2 × 10⁻⁹ N m−1. A higher acquisition rate, 50 fps, results in a higher bending rigidity κ = 45.3 ± 2.5 kBT due to the mode correlations. Such correlations are observed for all examined compositions.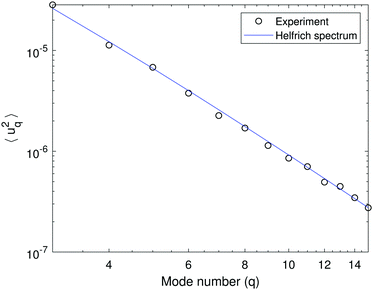 | ||
Fig. 1 A fluctuation spectrum of a 50![[thin space (1/6-em)]](https://www.rsc.org/images/entities/char_2009.gif) : :![[thin space (1/6-em)]](https://www.rsc.org/images/entities/char_2009.gif) 50 POPC 50 POPC![[thin space (1/6-em)]](https://www.rsc.org/images/entities/char_2009.gif) : :![[thin space (1/6-em)]](https://www.rsc.org/images/entities/char_2009.gif) POPG GUV in the absence of salt. The variance of the amplitude 〈|uq|2〉 dependence on mode number q if fitted with eqn (1) yields bending rigidity κ = 42.1 ± 3.0 kBT and tension σ = 7 ± 2 × 10⁻⁹ N m−1. The vesicle radius is R = 12.7 μm. POPG GUV in the absence of salt. The variance of the amplitude 〈|uq|2〉 dependence on mode number q if fitted with eqn (1) yields bending rigidity κ = 42.1 ± 3.0 kBT and tension σ = 7 ± 2 × 10⁻⁹ N m−1. The vesicle radius is R = 12.7 μm. | ||
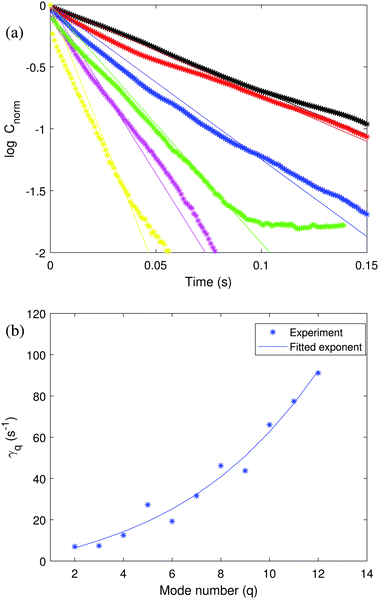 | ||
Fig. 2 (a) Normalized time autocorrelation function of a 50![[thin space (1/6-em)]](https://www.rsc.org/images/entities/char_2009.gif) : :![[thin space (1/6-em)]](https://www.rsc.org/images/entities/char_2009.gif) 50 symmetric POPC 50 symmetric POPC![[thin space (1/6-em)]](https://www.rsc.org/images/entities/char_2009.gif) : :![[thin space (1/6-em)]](https://www.rsc.org/images/entities/char_2009.gif) POPG GUV (same vesicle as in Fig. 1) for mode number 2 ≤ q ≤ 7. Black, red, blue, green, magenta and yellow symbols represent q from 2 to 7 in order. The solid lines correspond to the fit to the experimental data with theoretical eqn (4). (b) Relaxation dynamics of the shape fluctuations of a 50 POPG GUV (same vesicle as in Fig. 1) for mode number 2 ≤ q ≤ 7. Black, red, blue, green, magenta and yellow symbols represent q from 2 to 7 in order. The solid lines correspond to the fit to the experimental data with theoretical eqn (4). (b) Relaxation dynamics of the shape fluctuations of a 50![[thin space (1/6-em)]](https://www.rsc.org/images/entities/char_2009.gif) : :![[thin space (1/6-em)]](https://www.rsc.org/images/entities/char_2009.gif) 50 symmetric POPC 50 symmetric POPC![[thin space (1/6-em)]](https://www.rsc.org/images/entities/char_2009.gif) : :![[thin space (1/6-em)]](https://www.rsc.org/images/entities/char_2009.gif) POPG GUV. The fitted eqn (2) yields the bending rigidity κ = 49.1 ± 6.4 kBT. POPG GUV. The fitted eqn (2) yields the bending rigidity κ = 49.1 ± 6.4 kBT. | ||
The time autocorrelation data can also be used to extract the bending rigidity. The decay rates extracted from the slopes in Fig. 2 (top panel) were fitted with eqn (2) in Fig. 2 (bottom panel). The obtained value of the bending rigidity is κ = 49.1 ± 6.4 kBT, a value somewhat higher than the one determined from the fluctuation spectrum. The discrepancy likely originates from the more noisy time correlation data.
3.1 Membrane stiffening at increased surface charge
We measured the bending rigidity of membranes with composition ranging from a 100% neutral lipid, POPC, to a 100% charged lipid, POPG, in 20 mM sucrose in the absence of salt, and in the presence of 1 mM and 5 mM NaCl. Between 18 to 20 vesicles were analyzed for each composition unless stated otherwise.The bending rigidity determined from shape fluctuation analysis for different vesicle compositions is shown in Fig. 3 for the system without added salt. The data show that surface charge significantly stiffens the membrane: adding just 20% of charged lipids increases the bending rigidity by as much as 80% relative to the charge-free membrane (from 28 kBT to about 50 kBT).
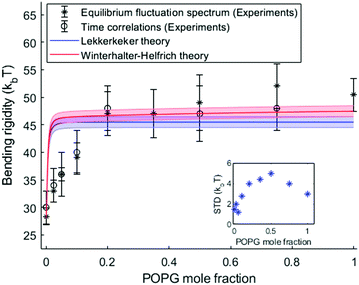 | ||
| Fig. 3 Bending rigidity as a function of the fraction of charged lipids in the absence of added salt. The blue and red solid lines represent the theoretical predictions by the Lekkerkerker and Winterhalter and Helfrich models eqn (8). The color bands represent the uncertainty introduced in the theoretical predictions by solution conductivity measurements. The inset shows the standard deviation in the bending rigidity as a function of the amount of charged lipids. | ||
The addition of salt screens the surface charge thereby decreasing the electrostatic contribution to the bending rigidity. Fig. 4 and 5 confirm that the membrane stiffening with charged lipid fraction is a lot less pronounced in 1 mM and 5 mM NaCl salt. Note that we have plotted data only from the equilibrium fluctuation spectrum in Fig. 4 and 5 for the salt-containing cases. We found it experimentally challenging to grow large charged GUVs (R > 10 μm) in salt-containing solutions. This affected the number of modes resolved from the time autocorrelation function.
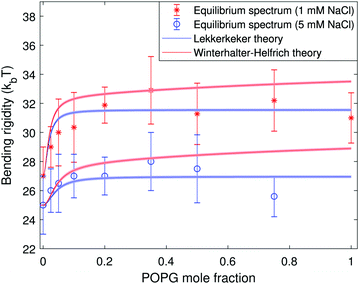 | ||
| Fig. 4 Bending rigidity as a function of the fraction of charged lipids in the membrane in the presence of 1 mM NaCl (red stars) and 5 mM NaCl (blue circles). The blue and red solid lines represent the Lekkerkerker and the Winterhalter–Helfrich theories eqn (8), respectively. The color bands represent the uncertainty introduced in the theoretical predictions by the solution conductivity measurements. | ||
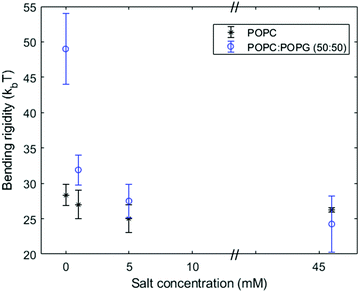 | ||
Fig. 5 Bending rigidity (from the equilibrium fluctuation spectrum) of pure POPC and POPC![[thin space (1/6-em)]](https://www.rsc.org/images/entities/char_2009.gif) : :![[thin space (1/6-em)]](https://www.rsc.org/images/entities/char_2009.gif) POPG (50 POPG (50![[thin space (1/6-em)]](https://www.rsc.org/images/entities/char_2009.gif) : :![[thin space (1/6-em)]](https://www.rsc.org/images/entities/char_2009.gif) 50) membranes as a function of the NaCl concentration in the bulk solution. 50) membranes as a function of the NaCl concentration in the bulk solution. | ||
Several theoretical models have been developed for the membrane stiffening due to surface charge9–12,14,15,17–19
| κ = κ0 + κel | (7) |
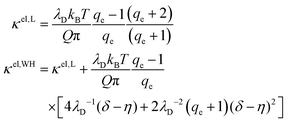 | (8) |
 is the Bjerrum length, e is the electronic charge, and
  , where p = (2πQΛλD)/A, where Λ is the fraction of charged head groups and A is the area per molecule. The theories, which involve no adjustable parameters, show relatively good agreement with the experiments, see Fig. 3. The model parameters (δ,η,λD,Q,A) for the theoretical curves were experimentally determined. Q is 0.714 nm for a 1
![[thin space (1/6-em)]](https://www.rsc.org/images/entities/char_2009.gif) :
:![[thin space (1/6-em)]](https://www.rsc.org/images/entities/char_2009.gif) 1 electrolyte solution at 25 °C. The POPC and POPG area per lipid considered are 68.3 A2 and 66.1 A2 respectively.50,51 For intermediate POPG fractions, we assumed a linear change in the area per lipid with varying POPG molar fraction. At room temperature, the bilayer thickness (the monolayer thickness, δ, is 1/2 of the bilayer thickness) and the hydrocarbon region thickness (the hydrophobic tail thickness, η, is 1/2 of the hydrocarbon region thickness) for POPC are 3.91 nm and 2.88 nm respectively.51,52 Similarly, the bilayer thickness and the hydrocarbon region thickness of POPG are 3.66 nm and 2.78 nm respectively.51,52 Linear approximations of the thickness values were made for intermediate compositions with varying POPG molar content. The Debye length was calculated from the measured solution conductivity
1 electrolyte solution at 25 °C. The POPC and POPG area per lipid considered are 68.3 A2 and 66.1 A2 respectively.50,51 For intermediate POPG fractions, we assumed a linear change in the area per lipid with varying POPG molar fraction. At room temperature, the bilayer thickness (the monolayer thickness, δ, is 1/2 of the bilayer thickness) and the hydrocarbon region thickness (the hydrophobic tail thickness, η, is 1/2 of the hydrocarbon region thickness) for POPC are 3.91 nm and 2.88 nm respectively.51,52 Similarly, the bilayer thickness and the hydrocarbon region thickness of POPG are 3.66 nm and 2.78 nm respectively.51,52 Linear approximations of the thickness values were made for intermediate compositions with varying POPG molar content. The Debye length was calculated from the measured solution conductivity | (9) |
 nm at room temperature 25 °C.
The agreement between theory and experimental data is very good in the salt-containing systems as seen in Fig. 4. In both the salt-free and salt-containing solutions the agreement between the experimental data and the Lekkerkerker model is better compared to the more complex Winterhalter and Helfrich one. In the case of the salt-free solutions, both models overestimate the membrane rigidity at low surface charge, see Fig. 3. This may be due to the approximations made in the model, such as the assumption of spherical geometry. On the experimental side, impurities in the commercially obtained chemicals4,54 or variations in membrane composition due to preparation issues42,55 could lead to underestimation of the surface charge. Discrepancies between the starting lipid mixture and the final vesicle composition are suggested by the observed behavior of the standard deviation in the measured bending rigidity (from the equilibrium fluctuation spectrum), see the inset in Fig. 3: it increases from a purely neutral POPC membrane (1.5 kBT) to a mixed 50![[thin space (1/6-em)]](https://www.rsc.org/images/entities/char_2009.gif) :
:![[thin space (1/6-em)]](https://www.rsc.org/images/entities/char_2009.gif) 50 composition (5 kBT) and decreases again for a fully charged POPG membrane (3 kBT). To check if the preparation protocol influences the results, we compared the bending rigidity of GUVs with 10% of POPG prepared by electroformation and natural swelling and found them to be virtually the same, 39.01 ± 4.00 kBT and 37.75 ± 2.87 kBT, correspondingly. This indicates that the discrepancy with the theory at low surface charge density and no added salt does not originate from the experimental protocol.
50 composition (5 kBT) and decreases again for a fully charged POPG membrane (3 kBT). To check if the preparation protocol influences the results, we compared the bending rigidity of GUVs with 10% of POPG prepared by electroformation and natural swelling and found them to be virtually the same, 39.01 ± 4.00 kBT and 37.75 ± 2.87 kBT, correspondingly. This indicates that the discrepancy with the theory at low surface charge density and no added salt does not originate from the experimental protocol.
3.2 Zeta potential and bending rigidity
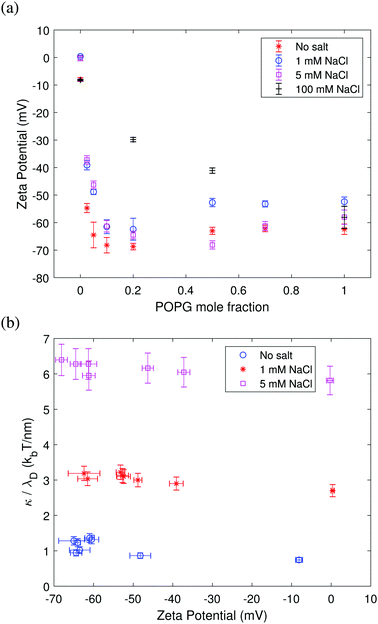
The dependence of the zeta potential on surface charge shown in Fig. 6 mirrors the bending rigidity trend seen in Fig. 3–5. Fig. 6a shows that a higher proportion of charged lipids results in a more negative zeta potential value. The screening effect due to the addition of salt is also evident: in the absence of salt, the zeta potential is more negative than in the presence of 1 mM NaCl and 5 mM NaCl. The screening effect becomes very pronounced at a high salt concentration of 100 mM NaCl. Fig. 6b shows that the ratio of the bending rigidity and Debye length is insensitive to the zeta potential. This behavior is predicted by Lekkerkerker's theoretical model eqn (8) in the limit of high surface charge p ≈ q ≫ 1, κel,L/λD ∼ kBT/Qπ. These results confirm the trend seen in Fig. 3 and 4 that the bending rigidity quickly becomes insensitive to the charged lipid fraction above a few % POPG. The results in Fig. 6b also imply that the bending rigidity of membranes with an increasing fraction of charged lipids can be directly assessed from that of the neutral membrane measured at the respective salt concentration after rescaling by the respective Debye length.4 Conclusions and outlook
We experimentally studied the effects of surface charge on the bending rigidity of lipid bilayer membranes. Using POPC (neutral)/POPG (negatively charged) lipids we quantifed the membrane stiffening in the full range of membrane compositions – from neutral to 100% charged – as well as at different salt concentrations. To measure the bending rigidity we employed the fluctuation spectroscopy technique with giant unilamellar vesicles. We analyzed both the mean amplitude and the time autocorrelations of the shape fluctuation modes. Our results show that the membrane bending rigidity increases rapidly with surface charge and for the first time demonstrate the theoretically predicted plateau above 20% surface charge. Addition of salt to the bulk solutions reduces the bending rigidity of the charged membranes due to surface charge screening. The experimental data are in very good agreement with the theoretical models, without any adjustable parameters. Only for intermediate fractions of the charged lipid and in the absence of salt do the theoretical models overestimate the bending rigidity, suggesting the need for further improvement either of the theoretical models or the experimental precision. The trends in bending rigidity qualitatively match the dependence of the zeta potential of LUVs on the membrane composition and bulk salt concentration.Our contribution highlights the importance of charge in membrane mechanics. A question that still remains to be addressed experimentally relates to the effect of multivalent ions such as calcium and magnesium on the bending rigidity of membranes. Multivalent ions are theoretically predicted to soften the membrane,56–58 and experimental data are scarce.59 Our experimental methodology using GUV shape fluctuations provides a foundation for future studies on membrane electromechanics such as the effect of multivalent ions on the membrane dynamics and elastic properties.
Conflicts of interest
There are no conflicts to declare.Acknowledgements
This research was funded in part by NSF-CMMI awards 1748049 and 1740011. PV acknowledges support from the Alexander von Humboldt Foundation for a visit to the Max Planck Institute of Colloids and Interfaces. JS and RD acknowledge the stimulating environment of the MaxSynBio consortium which is jointly funded by the Federal Ministry of Education and Research in Germany and the Max Planck Society. Open Access funding provided by the Max Planck Society.References
- L. Chernomordik and M. Kozlov, Nat. Struct. Mol. Biol., 2008, 15, 675–683 CrossRef CAS PubMed.
- J. C. Stachowiak, F. M. Brodsky and E. A. Miller, Nat. Cell Biol., 2013, 15, 1019–1027 CrossRef CAS PubMed.
- P. Bassereau, R. Jin, T. Baumgart, M. Deserno, R. Dimova, V. A. Frolov, P. V. Bashkirov, H. Grubmüller, R. Jahn, H. J. Risselada, L. Johannes, M. M. Kozlov, R. Lipowsky, T. J. Pucadyil, W. F. Zeno, J. C. Stachowiak, D. Stamou, A. Breuer, L. Lauritsen, C. Simon, C. Sykes, G. A. Voth and T. R. Weikl, J. Phys. D: Appl. Phys., 2018, 51, 343001 CrossRef PubMed.
- R. Dimova, Adv. Colloid Interface Sci., 2014, 208, 225–234 CrossRef CAS PubMed.
- W. Kim, W. Zhu, G. Hendricks, D. Van Tyne, A. Steele, C. Keohane, N. Fricke, A. Conery, S. Shen, W. Pan, K. Lee, R. Rajamuthiah, B. Fuchs, P. Vlahovska, W. Wuest, M. Gilmore, H. Gao, F. Ausubel and E. Mylonakis, Nature, 2018, 556, 103–107 CrossRef CAS PubMed.
- Y.-F. Chen, T.-L. Sun, Y. Sun and H. W. Huang, Biochemistry, 2014, 53, 5384–5392 CrossRef CAS PubMed.
- T.-Y. Lin and D. B. Weibel, Appl. Microbiol. Biotechnol., 2016, 100, 4255–4267 CrossRef CAS PubMed.
- W. Dowhan, Annu. Rev. Biochem., 1997, 66, 199–232 CrossRef CAS PubMed.
- M. Winterhalter and W. Helfrich, J. Phys. Chem., 1988, 92, 6865 CrossRef CAS.
- D. J. Mitchell and B. W. Ninham, Langmuir, 1989, 5, 1121 CrossRef CAS.
- H. N. W. Lekkerkerker, Physica A, 1989, 159, 319–328 CrossRef.
- H. N. W. Lekkerkerker, Physica A, 1990, 167, 384–394 CrossRef.
- A. Fogden, D. J. Mitchell and B. W. Ninham, Langmuir, 1990, 6, 159–162 CrossRef CAS.
- B. Duplantier, R. E. Goldstein, A. I. Pesci and V. Romero-Rochin, Phys. Rev. Lett., 1990, 65, 508 CrossRef CAS PubMed.
- M. Winterhalter and W. Helfrich, J. Chem. Phys., 1992, 96, 327–330 CrossRef CAS.
- J. Harden, C. Marques, J. Jonanny and D. Andelman, Langmuir, 1992, 8, 1170–1175 CrossRef CAS.
- P. A. Kralchevsky, T. D. Gurkov and K. Nagayama, J. Colloid Interface Sci., 1996, 180, 619–622 CrossRef CAS.
- S. May, J. Chem. Phys., 1996, 105, 8314–8323 CrossRef CAS.
- B. Loubet, P. L. Hansen and M. A. Lomholt, Phys. Rev. E: Stat., Nonlinear, Soft Matter Phys., 2013, 88, 062715 CrossRef PubMed.
- D. Andelman, Structure and dynamics of membranes, Elsevier, 1995, pp. 603–641 Search PubMed.
- A. Fogden and B. Ninham, Adv. Colloid Interface Sci., 1999, 83, 85–110 CrossRef CAS.
- I. Bivas and Y. A. Ermakov, Advances in Planar Lipid Bilayers and Liposomes, 2006, vol. 5, pp. 313–343 Search PubMed.
- R. Bradbury and M. Nagao, Soft Matter, 2016, 12, 9383–9390 RSC.
- R. Schomaecker and R. Strey, J. Phys. Chem., 1994, 98, 3908–3912 CrossRef CAS.
- J. Song and R. E. Waugh, J. Biomech. Eng., 1990, 112, 235–240 CrossRef CAS PubMed.
- A. C. Rowat, P. L. Hansen and J. H. Ipsen, EPL, 2004, 67, 144 CrossRef CAS.
- D. Mitkova, N. Marukovich, Y. A. Ermakov and V. Vitkova, Colloids Surf., A, 2014, 460, 71–78 CrossRef CAS.
- V. Vitkova, J. Genova, O. Finogenova, M. Mitov, Y. Ermakov and I. Bivas, C. R. Acad. Bulg. Sci., 2004, 57, 25–30 CAS.
- N. Delorme, J. F. Bardeau, D. Carriere, M. Dubois, A. Gourbil, H. Mohwald, T. Zemb and A. Fery, J. Phys. Chem., 2007, 111, 2503–2505 CrossRef CAS PubMed.
- B.-S. Lu, S. P. Gupta, M. Belika, R. Podgornik and G. Pabst, Langmuir, 2016, 32, 13546–13555 CrossRef CAS PubMed.
- R. Dimova, S. Aranda, N. Bezlyepkina, V. Nikolov, K. A. Riske and R. Lipowsky, J. Phys.: Condens. Matter, 2006, 18, S1151–S1176 CrossRef CAS PubMed.
- P. Walde, K. Cosentino, H. Engel and P. Stano, ChemBioChem, 2010, 11, 848–865 CrossRef CAS PubMed.
- R. Dimova, Annu. Rev. Biophys., 2019, 48, 93–119 CrossRef CAS PubMed.
- R. E. Dimova and C. E. Marques, The Giant Vesicle Book, CRC Press, Boca Raton, 2020 DOI:10.1201/9781315152516.
- H. D. Andersen, C. Wang, L. Arleth, G. H. Peters and P. Westh, Proc. Natl. Acad. Sci. U. S. A., 2011, 108, 1874–1878 CrossRef CAS PubMed.
- V. Vitkova, J. Genova, M. D. Mitov and I. Bivas, Mol. Cryst. Liq. Cryst., 2006, 449, 95–106 CrossRef CAS.
- D. Mitkova and V. Vitkova, Russ. J. Electrochem., 2016, 52, 1172–1178 CrossRef CAS.
- M. I. Angelova and D. S. Dimitrov, Faraday Discuss. Chem. Soc., 1986, 81, 303–311 RSC.
- S. L. Veatch, in Electro-Formation and Fluorescence Microscopy of Giant Vesicles With Coexisting Liquid Phases, ed. T. J. McIntosh, Humana Press, Totowa, NJ, 2007, pp. 59–72 Search PubMed.
- J. P. Reeves and R. M. Dowben, J. Cell. Physiol., 1969, 73, 49–60 CrossRef CAS PubMed.
- H. Stein, S. Spindler, N. Bonakdar, C. Wang and V. Sandoghdar, Front. Physiol., 2017, 8, 63 Search PubMed.
- J. Steinkühler, P. De Tillieux, R. L. Knorr, R. Lipowsky and R. Dimova, Sci. Rep., 2018, 8, 11838–11845 CrossRef PubMed.
- M. Karimi, J. Steinkühler, D. Roy, R. Dasgupta, R. Lipowsky and R. Dimova, Nano Lett., 2018, 18, 7816–7821 CrossRef CAS PubMed.
- K. Carvalho, L. Ramos, C. Roy and C. Picart, Biophys. J., 2008, 95, 4348–4360 CrossRef CAS PubMed.
- R. S. Gracia, N. Bezlyepkina, R. L. Knorr, R. L. Lipowsky and R. Dimova, Soft Matter, 2010, 6, 1472–1482 RSC.
- F. Brochard and J. F. Lennon, J. Phys., 1975, 36, 1035–1047 CrossRef.
- J. Seiwert and P. M. Vlahovska, Phys. Rev. E: Stat., Nonlinear, Soft Matter Phys., 2012, 87, 022713 CrossRef PubMed.
- J. R. Taylor, An Introduction to Error Analysis: the Study of Uncertainties In Physical Measurements, University Science Books, Sausalito, Calif., 2nd edn, 1997 Search PubMed.
- B. Klasczyk, V. Knecht, R. Lipowsky and R. Dimova, Langmuir, 2010, 26, 18951–18958 CrossRef CAS PubMed.
- N. Kučerka, S. Tristram-Nagle and J. F. Nagle, Biophys. J., 2006, 90, L83–L85 CrossRef PubMed.
- J. Pan, F. A. Heberle, S. Tristram-Nagle, M. Szymanski, M. Koepfinger, J. Katsaras and N. Kučerka, Biochim. Biophys. Acta, Biomembr., 2012, 1818, 2135–2148 CrossRef CAS PubMed.
- N. Kučerka, M.-P. Nieh and J. Katsaras, Biochim. Biophys. Acta, Biomembr., 2011, 1808, 2761–2771 CrossRef PubMed.
- G. Gramse, A. Dols-Perez, M. Edwards, L. Fumagalli and G. Gomila, Biophys. J., 2013, 104, 1257–1262 CrossRef CAS PubMed.
- C. G. Sinn, M. Antonietti and R. Dimova, Colloids Surf., A, 2006, 282–283, 410–419 CrossRef.
- N. Bezlyepkina, R. Gracia, P. Shchelokovskyy, R. Lipowsky and R. Dimova, Biophys. J., 2013, 104, 1456–1464 CrossRef CAS PubMed.
- A. W. C. Lau and P. Pincus, Phys. Rev. Lett., 1998, 81, 1338–1341 CrossRef CAS.
- T. T. Nguyen, I. Rouzina and B. I. Shklovskii, Phys. Rev. E: Stat. Phys., Plasmas, Fluids, Relat. Interdiscip. Top., 1999, 60, 7032–7039 CrossRef CAS.
- Y. Y. Avital, N. Grønbech-Jensen and O. Farago, Eur. Phys. J. E: Soft Matter Biol. Phys., 2014, 37, 69 CrossRef PubMed.
- M. Simunovic, K. Y. C. Lee and P. Bassereau, Soft Matter, 2015, 11, 5030–5036 RSC.
| This journal is © The Royal Society of Chemistry 2019 |

