
 Open Access Article
 This Open Access Article is licensed under a Creative Commons Attribution-Non Commercial 3.0 Unported Licence
Effects of droplet size and surfactants on anchoring in liquid crystal nanodroplets†
Zeynep
Sumer
 and
Alberto
Striolo
*
and
Alberto
Striolo
*
Department of Chemical Engineering, University College London, London WC1E 7JE, UK. E-mail: a.striolo@ucl.ac.uk
First published on 12th April 2019
Abstract
Liquid crystal (LC) droplets attract scientific attention for many advanced applications, including, but not limited to optical and sensing devices. To aid experimental advancements, theoretical calculations have been conducted to quantify molecular driving forces responsible for the collective behaviour of LC molecules within micrometer-size spherical droplets. To quantify the LC molecular anchoring within spherical physical constraints, molecular simulations at atomistic resolution would be useful. In an attempt to bridge the gap between computational capabilities and experimental interest, coarse-grained simulations are used here to study nematic LC nanodroplets dispersed in water. A LC phase diagram is generated as a function of droplet size and temperature. The effect of adding surfactants on LC anchoring was quantified, considering surfactants of different molecular features. When few surfactants are present, they self-assemble at the droplet boojums regardless of their molecular features. All surfactants tested shifted LC orientation from bipolar to uniaxial. When the surfactants have a hydrophobic tail of sufficient length, they cause deviations from the spherical symmetry of LC droplets. Increasing the concentration of these surfactants enhances such phenomenon. Simulations were also conducted to assess the ability of the surfactants to prevent the agglomeration between two LC droplets. The results showed that coalescence was inevitable at all conditions and suggested that large enough surfactant concentrations can delay the phenomenon. The results presented could be helpful for designing novel surface-active compounds to develop optical and/or sensing devices at conditions in which mutual solubility between water and LCs is low.
1. Introduction
Liquid crystals (LCs) are utilized in many technological advancements due to their phase transition properties. As their phase shifts from isotropic to nematic, their optical signature as observed via, e.g., polarized microscopes, changes.1,2 This LCs property is ultimately the reason LCs are used in displays, sensors, and other devices.3 Many researchers investigated how to tune the LC phases via external stimuli; such as electric4 or magnetic5 fields, and the introduction of, e.g., block copolymers6 or nanoparticles7 to LC-containing systems. Although the results are promising, many molecular-level mechanisms remain to be completely understood, especially the interactions between LCs and chemicals, the anchoring strength, and how these properties are affected by changes in temperature.Researchers have focused on identifying the molecular mechanisms responsible for changes in LC order, in an effort to quantify the properties of LC-nanoparticle preparations,8 as well as uses of LC in gas sensing,9,10 and optical detection of protein binding,11 bacteria and viruses.12 For example, Alino et al. used polyethylene imine – coated LCs to detect proteins such as immunoglobin G (IgG) and human serum albumin (HSA).13 The proteins were detected by a transition of LC order in droplets from radial to bipolar. These groups reported that to detect smaller proteins it was necessary to reach higher protein concentrations compared to those at which larger proteins were detected. Specifically, because HSA is smaller than IgG, the radial-to-bipolar LCs transition was observed at 100 μg mL−1 for HSA, but only at 50 μg mL−1 for IgG. Wang et al. studied the configuration of LC droplets in inhomogeneous interfacial environments,14 as they created Janus-like LC droplets by sedimentation at the aqueous–glycerol interface. In a previous study, the same group reported on the effect of surfactants on the orientations of TL205 LCs (a mixture composed of cyclohexane-flourinated biphenyls and fluorinated terphanyls) and 5CB LCs (4-pentyl-4′-cyanobiphenyl). The surfactants used included sodium dodecyl sulfate (SDS), linear dodecanesulfonate (LDS), linear dodecylbenzenesulfonate (L-DBS), and branched dodecylbenzenesulfonate (BR-DBS).15 While SDS, LDS and L-DBS triggered a planar-to-homeotropic transition for TL205, BR-DBS did not affect LCs orientation, and planar anchoring was reported at all BR-DBS concentrations. Wang et al. concluded that the molecular structure of the surfactants affects the anchoring of LCs, with interactions between surfactant tails and LCs dictating the orientational order. Wang et al. also reported that increasing LDS concentration leads to tail-mesogen interactions that favour homeotropic anchoring of both TL205 and 5CB due to an increase in interfacial surfactant density. Amundson and Srinivasarao considered polymer-dispersed liquid crystal (PDLC) films and reported that the polymer side groups control anchoring.16 Their results also show that the anchoring transition temperature decreases as the polymer side chain length decreases.
Sivakumar and coworkers12 quantified the ability of LC droplets to detect three bacteria (Escherichia coli, Bacillus subtilis, and Micrococcus luteus) and two viruses (M13 helper phage and A/NWS/Tokyo/67). Detection depended on the ability of bacteria or viruses to change the order within LC droplets. Bera and Fang documented bipolar-to-radial configuration changes in 5CB LC droplets due to charged macromolecules, namely poly(amidoamine) PAMAM dendrimers and poly(styrenesulfonate) PSS. The results showed that the bipolar-to-radial transition is affected by the macromolecules concentration, and also by size and number of LC droplets.17 Miller and Abbott also reported on the size-dependency of LC ordering transitions using bacterial lipopolysaccharide endotoxin.18
Most computational studies in the literature focus on bulk LC properties,19,20 LC–solvent flat interfaces,21 LC self-assembled aggregates,22 or mixtures of LCs and other compounds forced to maintain spherical shapes.23 Relevant to this work, Tsujinoue et al. recently studied size and temperature dependency of LC molecules and surfactants trapped inside a spherical cavity.24 They reported that phase transition temperature depends on the cavity size. Several simulation studies performed by the de Pablo group quantified the size and/or temperature dependency of surface anchoring, which leads to isotropic-to-radial transitions.23,25,26 In our previous study, we modelled three rod-coil amphiphiles as surfactants adsorbed on cylindrical LC bridges. We quantified the effect of amphiphiles morphological differences on the LC anchoring.27 The results showed that varying the number of hydrophilic coils and hydrophobic rods in such a model surfactant can largely affect LCs’ anchoring alongside surfactant tail–LC interactions. Those results depend on the internal elasticity, which tends to preferentially align the director along the axis of the cylinder. Thus, it is expected that the results on a cylindrical bridge are significantly different than those on a spherical LC droplet. In this paper we systematically study LC molecules assembled in spherical nanodroplets. We quantify the effect of temperature and surfactants on the alignment of the LC molecules.
In experimental works, LC droplets vary in size: while emulsion studies focus on LC droplets of 4–8 μm size,12,28,29 or as large as 40–60 μm,13,14,30 polymer-dispersed LC (PDLC) droplets can have size as low as 250–650 nm,31 and in some cases even 20 nm.32 It is known that different size droplets could yield different LC ordering under similar conditions.33 Gupta and co-workers stated that as the droplet size decreases from 3 μm to 700 nm, droplet order changes from bipolar to radial, respectively, and characterization was not possible for smaller droplets.33 Simulations could perhaps help predict order in such nm-size LC droplets.
In this work, we use molecular simulations to quantify the LC order as a function of droplet size. A coarse-grained simulation approach is implemented to observe the properties of LC systems at length- and time-scales larger and longer, respectively, than those accessible via atomistic simulations, although smaller than those accessible to continuum theory calculations. The length scale of our study fits in between the two extremes identified by Tomar and co-workers,25 who showed that when a certain anchoring strength is applied to mesogens at the surface of a LC droplet, ordering (radial or bipolar) depends on the droplet size. A droplet can be large enough for the total ordering driving force to be bulk-induced, or small enough for it to be surface-induced. In our systems, it is expected that surface effects are dominant; these effects could be manipulated by the presence of surfactants that preferentially adsorb at the LC droplet–water interface.
It is important to note that in continuum theory calculations, the chemical identity of the molecules is ignored, and that their orientation is calculated as a function of predefined surface anchoring energy and elastic energy, which are treated as input to the model. Continuum theory has been extremely useful for interpreting and understanding the self-assembly of LCs and their behavioural change with respect to elastic energy and surface anchoring energy changes. For LC droplets of 200–500 nm radius, continuum calculations yield very detailed insights for the mesogens collective properties.25 Molecular interactions, on the other hand, are expected to become dominant at nm length scales, at which conditions both surface anchoring and elastic energy depend on inter- and intra-molecular interactions. These are the input parameters in our study. The conditions chosen for our study are representative of low mutual solubility between the solvent and LCs. The presence of surfactants can affect these interactions, and therefore control LC order. In the systems we simulated, surfactant molecules tend to agglomerate at the boojums of droplets, regardless of the size of the surfactant tail lengths. This observation is consistent with previous experimental studies in literature for systems containing LC droplets and nanoparticles.34 In our study, the surfactants are found to have a relatively minor effect in determining the order of LC droplets, indeed because they tend to accumulate at the boojums.
Because surfactants are often used to stabilise dispersions, we implement our methods to investigate the coalescence between LC droplets immersed in water, in the presence of surfactants. Our results show that, for the systems considered here, surfactants are not effective at stabilising LC droplet emulsions. This is due to the tendency of the surfactants to accumulate at the droplet boojums, instead of uniformly covering the LC droplets. However, large enough densities of surfactants can in some cases delay LC droplets coalescence.
The remainder of this manuscript is organized as follows: in Section 2 we describe the models and algorithms implemented in the study. In Section 3 we discuss representative results, attempting to identify the molecular driving forces that are responsible for the observations. In Section 4 we summarize our main conclusions, and we comment on their possible relevance for practical applications and future research.
2. Computational details
2.1 Molecular models
The molecular models utilized here are taken from our previous work.27 The simulations are conducted in a coarse-grained framework. For example, one water bead (W) represents five water molecules. In our models, the liquid crystal molecules (LCs) are composed of 6 beads each. The coarse-grained LC model described here is a representation of LCs from the rod-like mesogens family, which has been widely investigated through computational and experimental studies. Three different surfactants are modelled as rod-coil oligomers. Rod-coil di-block oligomers are a widely-used class of surfactants with varying head and tail lengths. In our simulations, each surfactant molecule is composed of 10 beads. The three surfactants considered have 3, 5, 7 bead-long hydrophobic tails and 7, 5, 3 bead-long hydrophilic heads, respectively. The tails are rigid, representing a rod, while the heads are fully flexible, representing a coil.Consecutive beads are connected with a harmonic spring defined for both surfactant and LC molecules. Bond length potential Ebond = kbond × (r − r0)2 and bond bending potential Eangle = kangle × (θ − θ0)2 are used, where r0 is 0.6 and θ0 is 180°. To preserve the rigidity of rod-like LCs and surfactant tails, kbond and kangle are defined as 100kBT/rc2 and 100kBT respectively, between consecutive beads. For the surfactant head groups, which are flexible, kbond and kangle are set at 50kBT/rc2 and 30kBT, respectively.
2.2 Simulation details
The simulations were conducted by implementing the Dissipative Particle Dynamics (DPD) algorithm.35 The LAMMPS software package was used.36 All simulations were performed in the NVT ensemble (constant number of molecules, volume, and temperature), with integration time Δt = 0.01τ. As explained elsewhere,27,37 one integration time corresponds to 14.9 ps. Configurations were recorded for 106 steps (last 0.149 μs of the simulations) after droplets were stabilized. Within these 106 steps of simulation production, data are collected in every 104 steps and averages of 100 frames are used for quantitative analysis. To ensure that the simulations were properly equilibrated, a minimum of 2 × 10⁶ steps were used to equilibrate the systems containing single droplets. The number of steps was determined based on similar studies in the literature;38,39 it was confirmed that equilibration had been achieved by noting that once equilibration was completed, the system pressure and energy did not vary, nor did the orientational order. To ensure reproducibility, each system was simulated three times, starting from different initial configurations. The friction coefficient and the random force which are related by the equation σ2 = 2γkBT, were taken as γ = 4.5 and σ = 3, respectively.35 Repulsion coefficients, αij, which determine the strength of the conservative force between beads i and j are set as shown in Table 1.| Water | LC | S head | S tail | |
|---|---|---|---|---|
| Water | 25 | 50 | 25 | 50 |
| LC | 25 | 50 | 25 | |
| S head | 25 | 50 | ||
| S tail | 25 |
During the parametrization it was desired to achieve conditions at which mutual solubility between LCs and the water medium was low. As described in ESI,† our simulations confirmed that (i) at 1.0kBT the LC molecules in droplets are not desolved in water and remain isotropically aligned; and (ii) when the parameter describing the repulsive interactions between water and LC beads was reduced from 50 to 30kBT/rc, dissolution occurred at 0.62kBT. Therefore, we concluded that setting the repulsive parameter at 50kBT/rc described limited mutual solubility at the conditions chosen for this study.
2.3 Algorithms
The orientational order parameter (S) is a quantitative alignment tensor that characterizes the distribution of the order of LC molecules within a certain volume.40S is calculated by taking the ensemble average of the traceless second-rank tensor for each molecule that contributes to the orientation of the system.41S is calculated as a function of a predefined direction vector, chosen as basis for alignment of the LC mesogens: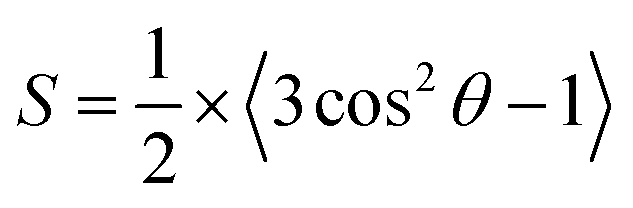 | (1) |
3. Results and discussion
3.1 Nematicity in liquid crystal droplets
It is known that LC nanodroplets dispersed in a medium will eventually coalesce.22 To study the properties of LC nanodroplets of different sizes, individual droplets were prepared as initial configurations dispersed in model water. Our prior simulations for the LC model considered here showed that, in the bulk, the reduced temperature of 0.7kBT was sufficiently low to provide nematic order, and high enough to allow for molecular motion. At this temperature, we investigated the properties of LC cylindrical structures.27Once the LCs are organised in nanodroplets, it is not known how the transition temperature changes with droplet size. To quantify this, we modelled 5 LC droplets of different sizes. Representative snapshots for these droplets are shown in Fig. 1(a–e). Each droplet contains a different number of mesogens. The radius of each LC droplet was determined by calculating its radius of gyration (rgyr).42 The radii of the 5 nanodroplets were calculated as (a) 6.2rc, (b) 9.7rc, (c) 13.6rc, (d) 16.9rc, and (e) 21rc, respectively, which correspond to ∼(a) 4.75, (b) 7.43, (c) 10.42, (d) 12.95, and (e) 16.08 nm, respectively. These droplets are composed of (a) 500, (b) 2000, (c) 6000, (d) 13![[thin space (1/6-em)]](https://www.rsc.org/images/entities/char_2009.gif) 000 and (e) 23000 LC molecules, respectively. The snapshots in Fig. 1 were obtained at the reduced temperature of 0.6kBT. In these simulations, only LC mesogens and water beads were simulated. The simulation box size varies from 30 × 30 × 30 to 50 × 50 × 50rc3, depending on the nanodroplet size. To identify the transition temperature, these five systems were simulated within the temperature interval of 0.6–0.7kBT, every 0.02kBT, for a total of 30 simulations (each replicated 3 times).
000 and (e) 23000 LC molecules, respectively. The snapshots in Fig. 1 were obtained at the reduced temperature of 0.6kBT. In these simulations, only LC mesogens and water beads were simulated. The simulation box size varies from 30 × 30 × 30 to 50 × 50 × 50rc3, depending on the nanodroplet size. To identify the transition temperature, these five systems were simulated within the temperature interval of 0.6–0.7kBT, every 0.02kBT, for a total of 30 simulations (each replicated 3 times).
 | ||
| Fig. 1 LC droplets with radii of (a) 6.2rc, (b) 9.7rc, (c) 13.6rc, (d) 16.9rc, and (e) 21rc, respectively, dispersed in water at 0.6kBT. Water beads are not shown for clarity. | ||
The simulation results were used to generate the orientational phase diagram shown in Fig. 2(a). For each droplet, we differentiated the order parameter, which identified anisotropic vs. nematic ordering. The results show that the transition temperature from nematic to isotropic alignment changes as the nanodroplet radius varies. It is important to note that as the droplet size decreases, molecular aggregates are eventually obtained. In a previous simulation study, it was considered that 1720 mesogens yield a nanodroplet.22 Using this number as a threshold, all the systems considered here, except the one in Fig. 1(a), are nanodroplets. Results obtained when 500 mesogens aggregate are nevertheless useful to provide a complete overview of the systems considered, although they are affected by relatively large uncertainties.
 | ||
| Fig. 2 (a) Orientational order parameters (S) of spherical LC droplets with respect to temperature. (b) Asphericity of LC droplets with respect to temperature. Error bars are obtained as one standard deviation from the average. The legend is the same for both (a and b). | ||
At 0.6kBT, all droplets simulated here show nematic alignment, with S between 0.50–0.63. For the droplets of radii 6.2rc and 9.7rc, transition to isotropic phase is observed above 0.64–0.66kBT. At 0.7kBT these droplets possess a fully-formed isotropic phase, with S ∼ 0.22 ± 0.06 and 0.33 ± 0.05, respectively. For larger spherical droplets, the nematic–isotropic transition is observed at temperatures higher than 0.66–0.68kBT. To put these results in perspective, it should be remembered that, due to the scale of the simulations, LC orientation in the systems considered here is driven by the surface energy. This implies that the mesogens anchor planarly to water molecules at the interface. It is also helpful to relate the results just discussed to those obtained for LC in cylindrical structures. Our prior results for such systems show that, although temperature and density are the same, cylindrical LC structures yield higher orientational order than spherical nanodroplets, regardless of the radius. For instance, at 0.7kBT, in cylindrical LC structures, S ∼ 0.53,27 while in the spherical droplets considered in Fig. 2, S is at most 0.38 ± 0.02. This is a consequence of the director alignment preference along the axis of the cylinder.
Visual analysis of the LC nanodroplets suggests that their shape is not spherical, but rather elongated. To quantify the deviation from spherical shape we quantified the asphericity43 of each droplet as a function of temperature. When the asphericity is 0, the shape of a droplet is spherical. The maximum value asphericity can assume is 1, in which case the droplet is extended in one dimension.44 Our analysis revealed that the asphericity ranges between 0.08–0.34 for all the systems considered in Fig. 2(a), which means that the nanodroplets are only approximately spherical, unless the temperature increases [see Fig. 2(b)]. It is likely that increasing temperature reduces the interfacial tension and increases the flexibility of the mesogens, resulting in more spherical droplets. The results in Fig. 2(b) also show a decrease in asphericity as the radius of the droplet increases. This was expected when size ratio between a single LC molecule and the droplet decreases. Indeed, it would be challenging for few LC molecules within a molecular aggregate (i.e., a few hundred mesogens) to form a perfectly spherical droplet due to their rod-like morphology, which is due to low molecular flexibility. Our results show that once the droplet radius is 21rc, the droplets tend to be spherical. Note also that the error bars become smaller as the droplet radius increases in Fig. 2(b).
The results in Fig. 2 allow us to select the conditions at which to quantify, using simulations, the effect of surfactants on the properties of the LC nanodroplets. Specifically, a droplet chosen for subsequent studies must be in nematic phase and it must be large enough to distinctly separate core and surface of the droplet. For the following analysis, the nanodroplets considered contain 6000 mesogens, so that the conditions are well above the threshold at which molecular aggregates would form, rather than nanodroplets.
3.2 Surfactants adsorption on LC nanodroplets
On the nanodroplet of radius 13.6rc (10.42 nm), we investigated the effect of surfactants adsorption. This droplet is large enough to differentiate core and surface. The simulations were conducted at 0.62kBT. The temperature is low enough to obtain nematic order within the droplet, low enough to ensure low mutual solubility between LCs and water, and high enough to allow for molecular mobility. In the DPD formalism implemented, random forces are included to mimic Brownian dynamics, achieved by adding a Gaussian white noise to the forces.35 It is expected that, because of this random force, the system can escape from local minima in the free energy landscape. To ensure reliability of the results, each system is simulated at least three times.The models for simulating the surfactants were introduced previously.27 Three morphologies were chosen to represent rod-coil di-block oligomers of the same length, but with different distributions of beads in the tail vs. head-groups. The tails are modelled here as rods, while the heads are modelled as coils. The three surfactants have short, moderate and long tails, respectively. We previously reported that changing the length of the surfactant headgroups does not affect the LCs anchoring, but it rather affects the kinetics relevant for lateral phase separation on the droplets.27 The interaction parameters are shown in Table 1. For the three surfactants, simulations were conducted at low surfactant concentration to identify the preferential adsorption sites at the LC nanodroplet–water interface. In all cases considered, 1000 surfactant molecules were added to the 6000 LC molecules, yielding 14 mole%. Representative equilibrated simulation snapshots are shown in Fig. 3.
 | ||
| Fig. 3 Equilibrated simulation snapshots for LC nanodroplets of radius 13.6rc (10.42 nm) covered with low concentration of surfactants. From left to right, the surfactants have tail-groups of 3, 5, and 7 beads, respectively. The simulations are conducted at T = 0.62 kBT. In all cases, water beads are not shown for clarity. In the bottom panels, only LC mesogens are shown, also for clarity. | ||
Visual analysis of the simulation snapshots shows that the surfactants self-assemble at the droplets boojums, regardless of the tail length. At the boojums there is a larger concentration of LC–water interfacial ‘defects’, which increases locally the interfacial tension.45 The surfactants clearly adsorb in these locations to reduce the total system energy. The adsorption of the surfactants caused a change in orientation of the LC mesogens located at boojums of the droplets, which became oriented perpendicularly to the interface due to homeotropic anchoring, and as a consequence the droplets became uniaxial. This is reflected in the overall orientational order parameter of these droplets. Without surfactants, the nanodroplets with radius 13.6rc (10.42 nm) were characterised by an order parameter S ∼ 0.57 ± 0.02. In the presence of 1000 surfactants, S increased to 0.65 ± 0.02, 0.73 ± 0.03 and 0.72 ± 0.01, for surfactants with 3-, 5-, and 7-bead-long tails, respectively.
To quantify the range of interactions due to surfactant adsorption, the order within LC molecules was studied within core and outer regions. The core was considered within a radius of 7rc from the center, the outer region at distances larger than 12rc. The core region is large enough to contain sufficient LC molecules for quantifying S. It is expected that surfactants would directly affect the outer region, close to the interface. In fact, after the surfactants adsorb the droplet size increases from 13.6 to 15rc. LC molecules located (based on their center of mass) further than 12rc are considered to be part of the outer region. A transitional region could be defined between 7–12rc from the droplet center. The order of LC molecules, shown in Fig. 3, was also quantified with respect to their distance to the core of the droplet. The results are shown in Fig. S3 of ESI† and reveal that radial configuration was never achieved, probably because of the high orientational order maintained within the core region.
The results (Fig. 3 and Fig. S3, ESI†) show that the surfactants have a stronger effect in the LC orientation within the outer region. When no surfactants are present, S ∼ 0.40 ± 0.02 in this region, as schematically shown in Fig. 4. When the surfactants are present, especially for surfactants with long hydrophobic tail groups, more LC mesogens at the boojums became parallel to the direction vector. The S parameter in the outer region became 0.55 ± 0.02, 0.69 ± 0.04, and 0.74 ± 0.02, for surfactants with 3-, 5-, and 7-bead-long tails, respectively. S in the core regions was not much affected by the surfactants. For all cases, with or without surfactants, S ∼ 0.77 ± 0.02 in the core of the nanodroplet. As already mentioned, due to the size of the droplets considered here, LC orientation is surface driven. In other words, interactions between water molecules and LC droplet surface yield a surface force larger than the elastic forces within LC molecules, yielding planar anchoring of LC mesogens with the surroundings. The surfactants affect the interfacial energy, reducing the defects at the boojums, but this contribution is always local.
 | ||
| Fig. 4 Vector representations of LCs at the outer region at distances larger than 12rc within the droplet where (a) no surfactant added (b) surfactants with 3 bead-long (c) 5 bead-long and (d) 7 bead-long surfactants were added. | ||
To quantify changes in nanodroplet shape, the droplet asphericity was calculated. Only the LC mesogens were considered for this calculation. The results showed that adding surfactants with 3- or 5-bead-long tails decreased the asphericity from 0.23 ± 0.04 to 0.08 ± 0.03 and 0.09 ± 0.04, respectively. On the other hand, adding surfactants with 7 bead-long tails did not affect asphericity, which remained ∼0.20 ± 0.04. This is due to the deformation at the droplets boojums described above.
3.3 Effect of surfactant concentration
Because only the surfactants with 7-bead-long tail-groups were able to deform the LC nanodroplets upon adsorption at the droplets boojums, these surfactants were chosen to investigate the effect of surfactant concentration. Their number within the simulation box was increased from 1000 to 1500 for the 6000 LC molecules, which yields a concentration of 20 mole%. The snapshots of the equilibrated structures are shown in Fig. 5. Visual inspection suggests that the LC nanodroplet surface is almost fully covered by surfactants, the droplet is clearly deformed at the surface, and the surfactants seem to form ordered domains. Quantification of order shows that S decreased to 0.27 ± 0.04. Perhaps more interesting is to point out that in the droplet outer region S decays to ∼0, because the LC mesogens in this region assume almost every orientation with respect to the direction vector. The mesogens at the nanodroplet core show the same overall orientation as those in the droplet with no-surfactants. | ||
| Fig. 5 (a) LC nanodroplet of radius 13.6rc (10.42 nm) covered with high concentration of surfactants whose tail-group is of 7 beads. No water beads are shown for clarity. (b) Same as (a), but without surfactants, for clarity. (c) Orientation of mesogens within the droplet outer region (located at distances larger than 12rc from the droplet centre); the red arrow indicates the direction vector. The simulations were conducted at 0.62kBT. | ||
Comparing the results in Fig. 5 to those in Fig. 3, we conclude that when few surfactants are present, they self-assemble at the droplet boojums regardless of their molecular features. When the surfactant concentration increases, the entire droplet surface can be covered by surfactants, at the expense of a deformation of the droplet. In this event, the LC mesogens at the outer region become perpendicular to the interface, whereas those in the core remain parallel to direction vector. These observations constitute deviations from predictions from the continuum theory, according to which, due to predefined boundaries and interactions at the interface, droplet shape deformation cannot be predicted. These differences are due to the ability of simulations to account for individual mobility of the LC molecules, as well as for their elastic properties (a direct consequence of the model implemented). The simulation results show that while at contact with water the LCs assume a planar orientation, the presence of surfactants can change this orientation to perpendicular. However, the effect is local, as the LC orientation near the droplet centre remains planar. Quantifying how these observations affect practical applications is the subject of future research.
3.4 Coalescence of eight surfactant-covered droplets
Apart from surfactants causing homeotropic anchoring, it is important to analyse whether the surfactants are able to stabilize LC nanodroplets in water. For this analysis surfactants with 7-bead-long tails were considered. Two simulations were conducted: (i) droplets covered with 1000 surfactants, and (ii) droplets covered with 1500 surfactants. In both cases, eight LC droplets were simulated in water. To construct the initial configurations, we used the simulation corresponding snapshot in Fig. 3 and 5(a), respectively, and we replicated them within a larger simulation box: each having the size of 80 × 80 × 80rc3 which corresponds to 61.3 × 61.3 × 61.3 nm3. The simulations were then conducted for 5 × 10⁶ steps, which correspond to 0.745 μs. The results are shown in Fig. 6 and 7, respectively, where we identify the initial configurations (panel a) and the snapshots after 0.745 μs (b). | ||
| Fig. 6 Eight LC nanodroplets, each covered with 1000 surfactant molecules with 7 bead-long tails at (a) 0 μs and (b) 0.745 μs. On the right we report an enlargement of the cross-section of the largest droplet obtained (∼24rc radius). | ||
 | ||
| Fig. 7 Eight LC nanodroplets, each covered with 1500 surfactant molecules with 7 bead-long tails at (a) 0 μs and (b) 0.745 μs. On the right we report an enlargement of the cross-section of largest droplet obtained (∼19rc radius). | ||
1000 surfactant molecules were not enough to cover the entire LC droplet surface, and instead the surfactants agglomerated at the droplet boojums. The simulations (Fig. 6) confirmed that for this system, agglomeration was inevitable: in 0.745 μs, the 8 initial droplets yield 4, two of which maintained their initial size and shape, two of which the result of 2 initial droplets coalescing, and 1 of which the results of 4 initial droplets coalescing. As two LC droplets merge, they yield larger and more spherical droplets, in qualitative agreement with results in Fig. 2(b). Perhaps interestingly, as the droplets become wider, the surfactants are found to distribute more evenly on the droplet surface. This is because as the droplet size increases, the surface to volume ratio decreases, and the surface density of the surfactants anchored to the surface increases.
When the number of surfactants is increased to 1500 (Fig. 7), droplets agglomeration occurs more slowly. After 0.745 μs of simulations, only two pairs of droplets merged, yielding 6 LC droplets. The surfactants are found to be more effective at delaying droplet agglomeration because they cover the entire LC droplets surface. It might be interesting to point out that when two LC droplets merge in this situation, the resultant droplet remains deformed. As can be seen from the cross section in Fig. 7(b), the resultant droplet is not spherical, and some of the surfactants remain trapped inside it after agglomeration.
Because of computer power limitations, we cannot confirm whether the final snapshots shown in Fig. 6 and 7 correspond to the equilibrated system. Analysis of energy profiles suggest that the systems have reached metastable conditions at which long-lived structures have been achieved (they did not change for 0.298 μs), but it is indeed possible that further agglomeration will occur. As the droplet size increases and the surface to volume ratio decreases, the surfactants will cover more and more of the droplet surface, and perhaps will be able to stabilise LC droplets. Experimentally, small LC droplets are used in PDLC applications, where they are trapped within polymer matrix where agglomeration is more difficult than in emulsions.31,32
The results in Fig. 6 and 7 suggest that the shape of the LC droplets depends on the surfactant coverage, but also on the droplet size. When the surface to volume ratio is high and the surfactant surface density low, surfactants accumulate at the boojums. For such droplets, as the surfactant concentration increases, the droplet is deformed. However, when the surface to volume ratio is low (i.e., large droplets), it is possible that increasing surfactants concentration will not result in deformations of the droplet.
4. Conclusions
Using the coarse-grained Dissipative Particle Dynamics approach, we investigated LC nanodroplets at a scale between continuum mechanics and atomistic simulations (4.5–16 nm radius). The results showed both size and temperature dependency on the nematic alignment; droplets of similar size yield nematicity at low temperatures. At high temperature all droplets become isotropic. At a given temperature, larger droplets yield more ordered structures.At low concentration, surfactants tend to accumulate at the boojums of the droplets regardless of their tail size. However, the length of the surfactant tail group can affect the droplets asphericity. While surfactants with short or moderate tails decrease asphericity, those with long tails did not change it. As their concentration increases, surfactants distribute on the whole droplets surface. These surfactants can affect LC anchoring, but only at the outer region of the droplets, regardless of the size of droplets and morphology of the surfactants.
Finally, we studied the effect of surfactants on LC droplets coalescence. While increasing surfactants concentration can decrease the rate of coalescence, the results suggest that, in our systems, coalescence is inevitable. Although as coalescence progresses, the droplets increase in size and the surface density of the surfactants increases, the simulation results suggest that once the droplets become large enough, their shape tend to become spherical.
The results presented here could help interpret experimental results and guide the design of LC-systems for advanced applications. When using the results in this manuscript to foster practical applications, it should be remembered that the conditions chosen here are such that the mutual solubility between LCs and water is low, the nanodroplets, larger than molecular aggregates, are composed of at most a few thousand mesogens, and the mesogens considered represent the rod-like family. It is likely that the results could change for different mesogens, as well as for surfactants with different features.
Conflicts of interest
There are no conflicts to declare.Acknowledgements
Generous allocations of computing time were provided by the Research Computing Platforms Support – University College London. The Authors acknowledge useful discussions with Dr Stefan Guldin and his group at University College London.References
- G. Vertogen and W. H. de Jeu, Thermotropic Liquid Crystals, Fundamentals, Springer Science & Business Media, 2012 Search PubMed.
- S. F. Sun, Physical Chemistry of Macromolecules: Basic Principles and Issues, John Wiley & Sons, 2004 Search PubMed.
- D.-K. Yang, Fundamentals of Liquid Crystal Devices, John Wiley & Sons, 2014 Search PubMed.
- T.-Z. Shen, S.-H. Hong and J.-K. Song, Nat. Mater., 2014, 13, 394 CrossRef CAS PubMed.
- A. Mertelj, D. Lisjak, M. Drofenik and M. Čopič, Nature, 2013, 504, 237 CrossRef CAS PubMed.
- P. Feng, X. Bu and D. J. Pine, Langmuir, 2000, 16, 5304–5310 CrossRef CAS.
- L. M. Lopatina and J. V. Selinger, Phys. Rev. Lett., 2009, 102, 197802 CrossRef.
- O. Tongcher, R. Sigel and K. Landfester, Langmuir, 2006, 22, 4504–4511 CrossRef CAS PubMed.
- Y.-T. Lai, J.-C. Kuo and Y.-J. Yang, Sens. Actuators, A, 2014, 215, 83–88 CrossRef CAS.
- A. Sen, K. A. Kupcho, B. A. Grinwald, H. J. VanTreeck and B. R. Acharya, Sens. Actuators, B, 2013, 178, 222–227 CrossRef CAS PubMed.
- D. Hartono, C. Y. Xue, K. L. Yang and L. Y. L. Yung, Adv. Funct. Mater., 2009, 19, 3574–3579 CrossRef CAS.
- S. Sivakumar, K. L. Wark, J. K. Gupta, N. L. Abbott and F. Caruso, Adv. Funct. Mater., 2009, 19, 2260–2265 CrossRef CAS.
- V. J. Alino, J. Pang and K.-L. Yang, Langmuir, 2011, 27, 11784–11789 CrossRef CAS PubMed.
- X. Wang, Y. Zhou, Y.-K. Kim, D. S. Miller, R. Zhang, J. A. Martinez-Gonzalez, E. Bukusoglu, B. Zhang, T. M. Brown and J. J. de Pablo, Soft Matter, 2017, 13, 5714–5723 RSC.
- N. A. Lockwood, J. J. de Pablo and N. L. Abbott, Langmuir, 2005, 21, 6805–6814 CrossRef CAS PubMed.
- K. R. Amundson and M. Srinivasarao, Phys. Rev. E: Stat. Phys., Plasmas, Fluids, Relat. Interdiscip. Top., 1998, 58, R1211 CrossRef CAS.
- T. Bera and J. Fang, J. Mater. Chem., 2012, 22, 6807–6812 RSC.
- D. S. Miller and N. L. Abbott, Soft Matter, 2013, 9, 374–382 RSC.
- X. Wei, J. B. Hooper and D. Bedrov, Liq. Cryst., 2017, 44, 332–347 CAS.
- S. D. Peroukidis, A. G. Vanakaras and D. J. Photinos, Phys. Rev. E: Stat., Nonlinear, Soft Matter Phys., 2015, 91, 062501 CrossRef PubMed.
- O. Gürbulak and E. Cebe, J. Mol. Liq., 2018, 256, 611–619 CrossRef.
- W. M. Brown, M. K. Petersen, S. J. Plimpton and G. S. Grest, J. Chem. Phys., 2009, 130, 044901 CrossRef PubMed.
- S. Hernández, J. Moreno-Razo, A. Ramírez-Hernández, E. Díaz-Herrera, J. Hernández-Ortiz and J. J. de Pablo, Soft Matter, 2012, 8, 1443–1450 RSC.
- T. Inokuchi and N. Arai, Liq. Cryst., 2019, 1–12, DOI:10.1080/02678292.2019.1573326.
- V. Tomar, S. Hernandez, N. L. Abbott, J. P. Hernández-Ortiz and J. De Pablo, Soft Matter, 2012, 8, 8679–8689 RSC.
- J. K. Whitmer, X. Wang, F. Mondiot, D. S. Miller, N. L. Abbott and J. J. de Pablo, Phys. Rev. Lett., 2013, 111, 227801 CrossRef PubMed.
- Z. Sumer and A. Striolo, Phys. Chem. Chem. Phys., 2018, 20, 30514–30524 RSC.
- J. K. Gupta, J. S. Zimmerman, J. J. de Pablo, F. Caruso and N. L. Abbott, Langmuir, 2009, 25, 9016–9024 CrossRef CAS.
- U. Manna, Y. M. Zayas-Gonzalez, R. J. Carlton, F. Caruso, N. L. Abbott and D. M. Lynn, Angew. Chem., Int. Ed., 2013, 52, 14011–14015 CrossRef CAS PubMed.
- S. Munir and S.-Y. Park, Sens. Actuators, B, 2018, 257, 579–585 CrossRef CAS.
- E. Perju, E. Paslaru and L. Marin, Liq. Cryst., 2015, 42, 370–382 CrossRef CAS.
- Y. Liu, X. Sun, H. Elim and W. Ji, Appl. Phys. Lett., 2006, 89, 011111 CrossRef.
- J. K. Gupta, S. Sivakumar, F. Caruso and N. L. Abbott, Angew. Chem., 2009, 121, 1680–1683 CrossRef.
- M. Rahimi, T. F. Roberts, J. C. Armas-Pérez, X. Wang, E. Bukusoglu, N. L. Abbott and J. J. de Pablo, Proc. Natl. Acad. Sci. U. S. A., 2015, 112, 5297–5302 CrossRef CAS PubMed.
- R. D. Groot and P. B. Warren, J. Chem. Phys., 1997, 107, 4423–4435 CrossRef CAS.
- S. Plimpton, J. Comput. Phys., 1995, 117, 1–19 CrossRef CAS.
- H. Fan and A. Striolo, Phys. Rev. E: Stat., Nonlinear, Soft Matter Phys., 2012, 86, 051610 CrossRef PubMed.
- Z. Zhang and H. Guo, J. Chem. Phys., 2010, 133, 144911 CrossRef PubMed.
- T. Zhao and X. Wang, J. Chem. Phys., 2011, 135, 244901 CrossRef PubMed.
- B. Jerome, Rep. Prog. Phys., 1991, 54, 391 CrossRef CAS.
- M. Greschek, M. Melle and M. Schoen, Soft Matter, 2010, 6, 1898–1909 RSC.
- F. Sicard and A. Striolo, Nanoscale, 2017, 9, 8567–8572 RSC.
- A. Striolo, J. M. Prausnitz and A. Bertucco, Macromolecules, 2000, 33, 9583–9586 CrossRef CAS.
- J. Rudnick and G. Gaspari, J. Phys. A: Math. Gen., 1986, 19, L191 CrossRef.
- O. D. Lavrentovich, Liq. Cryst., 1998, 24, 117–126 CrossRef CAS.
Footnote |
| † Electronic supplementary information (ESI) available: Snapshots from the simulation conducted at 1.0kBT, in which the repulsion coefficient between water/LC beads was 50kBT/rc. Snapshots from the simulation conducted at 0.62kBT, in which the repulsion coefficient between water/LC beads was 30kBT/rc. Orientational order of LC molecules shown in Fig. 3 with respect to their distance to the core of the droplet for every 3rc. See DOI: 10.1039/c9sm00291j |
| This journal is © The Royal Society of Chemistry 2019 |