DOI:
10.1039/C8SM02588F
(Paper)
Soft Matter, 2019,
15, 4276-4283
Control over the formation of supramolecular material objects using reaction–diffusion†
Received
21st December 2018
, Accepted 22nd April 2019
First published on 22nd April 2019
Abstract
Controlled diffusion, reaction and assembly of hydrogelator precursors can be used to create soft hydrogel objects of defined shape and size. In this study we show that controlling local reaction kinetics by means of pH, diffusion length and the concentrations of reactants allows control over the dimensions of formed supramolecular structures. By correlating a reaction diffusion model to experimental results, we show that the influence of all these control parameters can be unified using the Damköhler number, thus providing an easy-to-use relation between experimental parameters and structure dimensions. Finally, our study suggests that control over concentration gradients and chemical reactivity in combination with supramolecular chemistry is a promising platform for the design of soft matter objects of defined sizes, a concept that has received little attention up until now.
Introduction
Control over structure formation is an important requirement in the fields of hydrogel micro- and nanofabrication.1 Techniques for controlling the size and/or shapes of structures include photo-lithography,2,3 printing,4–6 and microfluidics.7 Contrary to artificially made structures, the shape and dimensions of naturally formed structures are often dependent on conditions created by a dynamic environment.8 For selected parameter ranges, chemical gradients can develop from minute concentration differences into natural structures,9 without additional input of energy.10,11 However, transport of components in natural settings is often not only by means of diffusion, but facilitated by a series of transport enzymes separated by small distances.12,13 Although enzymatic transport is active as it is facilitated by a series of chemical reactions, molecules cross short distances between enzymes purely by diffusion. Since diffusion is coupled to a series of enzymatic chemical reactions, the overall process is called reaction–diffusion (RD) and it is essential for various cellular mechanisms. Examples from nature include calcium waves,10,11 glucose-induced oscillations,14 transport of ATP to ATP-deficient sites,12,13,15 and building and maintaining of microtubules.16 First evidence that links RD to pattern formation in living systems was provided by Alan Turing17 and Boris Belousov.18 Both Turing's and Belousov's systems contain (nonlinear) coupling between reactions and feedback loops which are abundantly employed mechanisms in nature for various regulatory processes and spatial organization. For example, their discoveries provide a suggestion to explain skin pattern formation on animals.19–21 Therefore, the spontaneous formation of concentration gradients by coupled reaction and diffusion in dynamic systems should enable the production of novel and diverse artificial materials.
Abundantly present in nature, approaches to use dynamic conditions for the design of structured soft materials are still rare. Some recent examples include imposed gradients of carbon dioxide22 and oxygen23 to control the growth of complex inorganic structures, various examples using precipitation of inorganic salts,24 as well as approaches using DNA assembly networks25 or enzymatic reaction networks.26 Recently, we reported a self-assembling system capable of reproducing defined macroscopic objects with varying shape and composition using an RD approach.27 Imposed concentration gradients were exploited in combination with reaction rates controlled by acid catalysis to control the spatial distribution of soft matter structure formation. We also verified the observed behavior with an RD model. In general, the major drawback of experimental exploration of such large parameter space is that it is often time-consuming. Numerical simulations of the RD model can facilitate this process since they can execute the same task in a matter of hours. On the other hand, writing a custom code for the specific set of RD equations might still require significant time. Therefore, to fully benefit from the RD approach as a tool for object formation, one would ideally want an easy-to-use relation between experimental conditions and complex desired object characteristics.
In this work we demonstrate the facile use of the Damköhler expression for quick order-of-magnitude estimates of the RD object size from experimental conditions. As a starting point, we focus on a 1D approach. In the future, this may be extended to more dimensions as we demonstrated experimentally in our previous work.27a We start by briefly exploring how diffusion and reaction rates influence supramolecular object size, and compare these experimental results with the established RD model. The comparison shows that both the dimensions and the growth process of the supramolecular object are quite well captured by the RD model. This growth process, where the object ceases to grow some time after initial structure formation, is captured in the RD model through hampering of diffusion of reactants and reaction products by the supramolecular object itself. After presenting the experimental verification of the full RD model, we simplify the model to obtain a simple to use dimensionless Damköhler-based relation between object size and experimental parameters. We anticipate that the methodology developed herein outlines a general approach towards rational design of RD experiments, eliminating laborious experimental investigation of large sets of parameters to optimize the desired object dimensions.
Approach
In our approach towards control of supramolecular object formation by RD we made use of the reactive formation of supramolecular hydrogels from hydrazide (H) and aldehyde (A) derived compounds.27 In the RD setup, these precursors H and A are separately dissolved in an aqueous buffer and injected in two containers on opposite sides of a pre-formed agar hydrogel matrix (Fig. 1). Over time, H and A diffuse through the agar matrix forming concentration gradients within. At locations where their gradients overlap H and A react to give the hydrogelator HA3, which will subsequently form a fibrous hydrogel network through self-assembly. The width of the resulting supramolecular hydrogel depends on the rates of diffusion and reaction. To understand the relation between the resulting width and the experimental control parameters, we explored three of them: the pH of the buffer, the initial concentration of H (cH,0) while fixing the ratio between the initial concentration of H and A (cA,0) to cH,0![[thin space (1/6-em)]](https://www.rsc.org/images/entities/char_2009.gif) :cA,0 = 1:4, and the diffusion distance (L). While cH,0 and L control the concentration gradient, pH controls the reaction rate constants. In general, the concentration gradient becomes steeper as cH,0 increases and L decreases, while the reaction rate constants increase for decreasing pH.
:cA,0 = 1:4, and the diffusion distance (L). While cH,0 and L control the concentration gradient, pH controls the reaction rate constants. In general, the concentration gradient becomes steeper as cH,0 increases and L decreases, while the reaction rate constants increase for decreasing pH.
 |
| | Fig. 1 Formation of an object by reaction–diffusion of a two component self-assembling hydrogelator. (a) H and A react to form gelator HA3 which assembles under ambient conditions in water to form a supramolecular gel, with the reaction rate being controlled by acid catalysis. (b) Schematic representation of reaction–diffusion setup for the object formation. Reactants H (blue, right) and A (yellow, left) are placed into containers on opposite sides of an agar gel matrix. Over time H and A diffuse through the matrix (indicated with arrows), and react upon crossing of their diffusional fronts to form gelator HA3, which subsequently self-assembles into a fibrous gel network. This process results in the formation of a turbid white line within the agar matrix. A sketch of the concentration profiles during this process is shown in the bottom. | |
Results
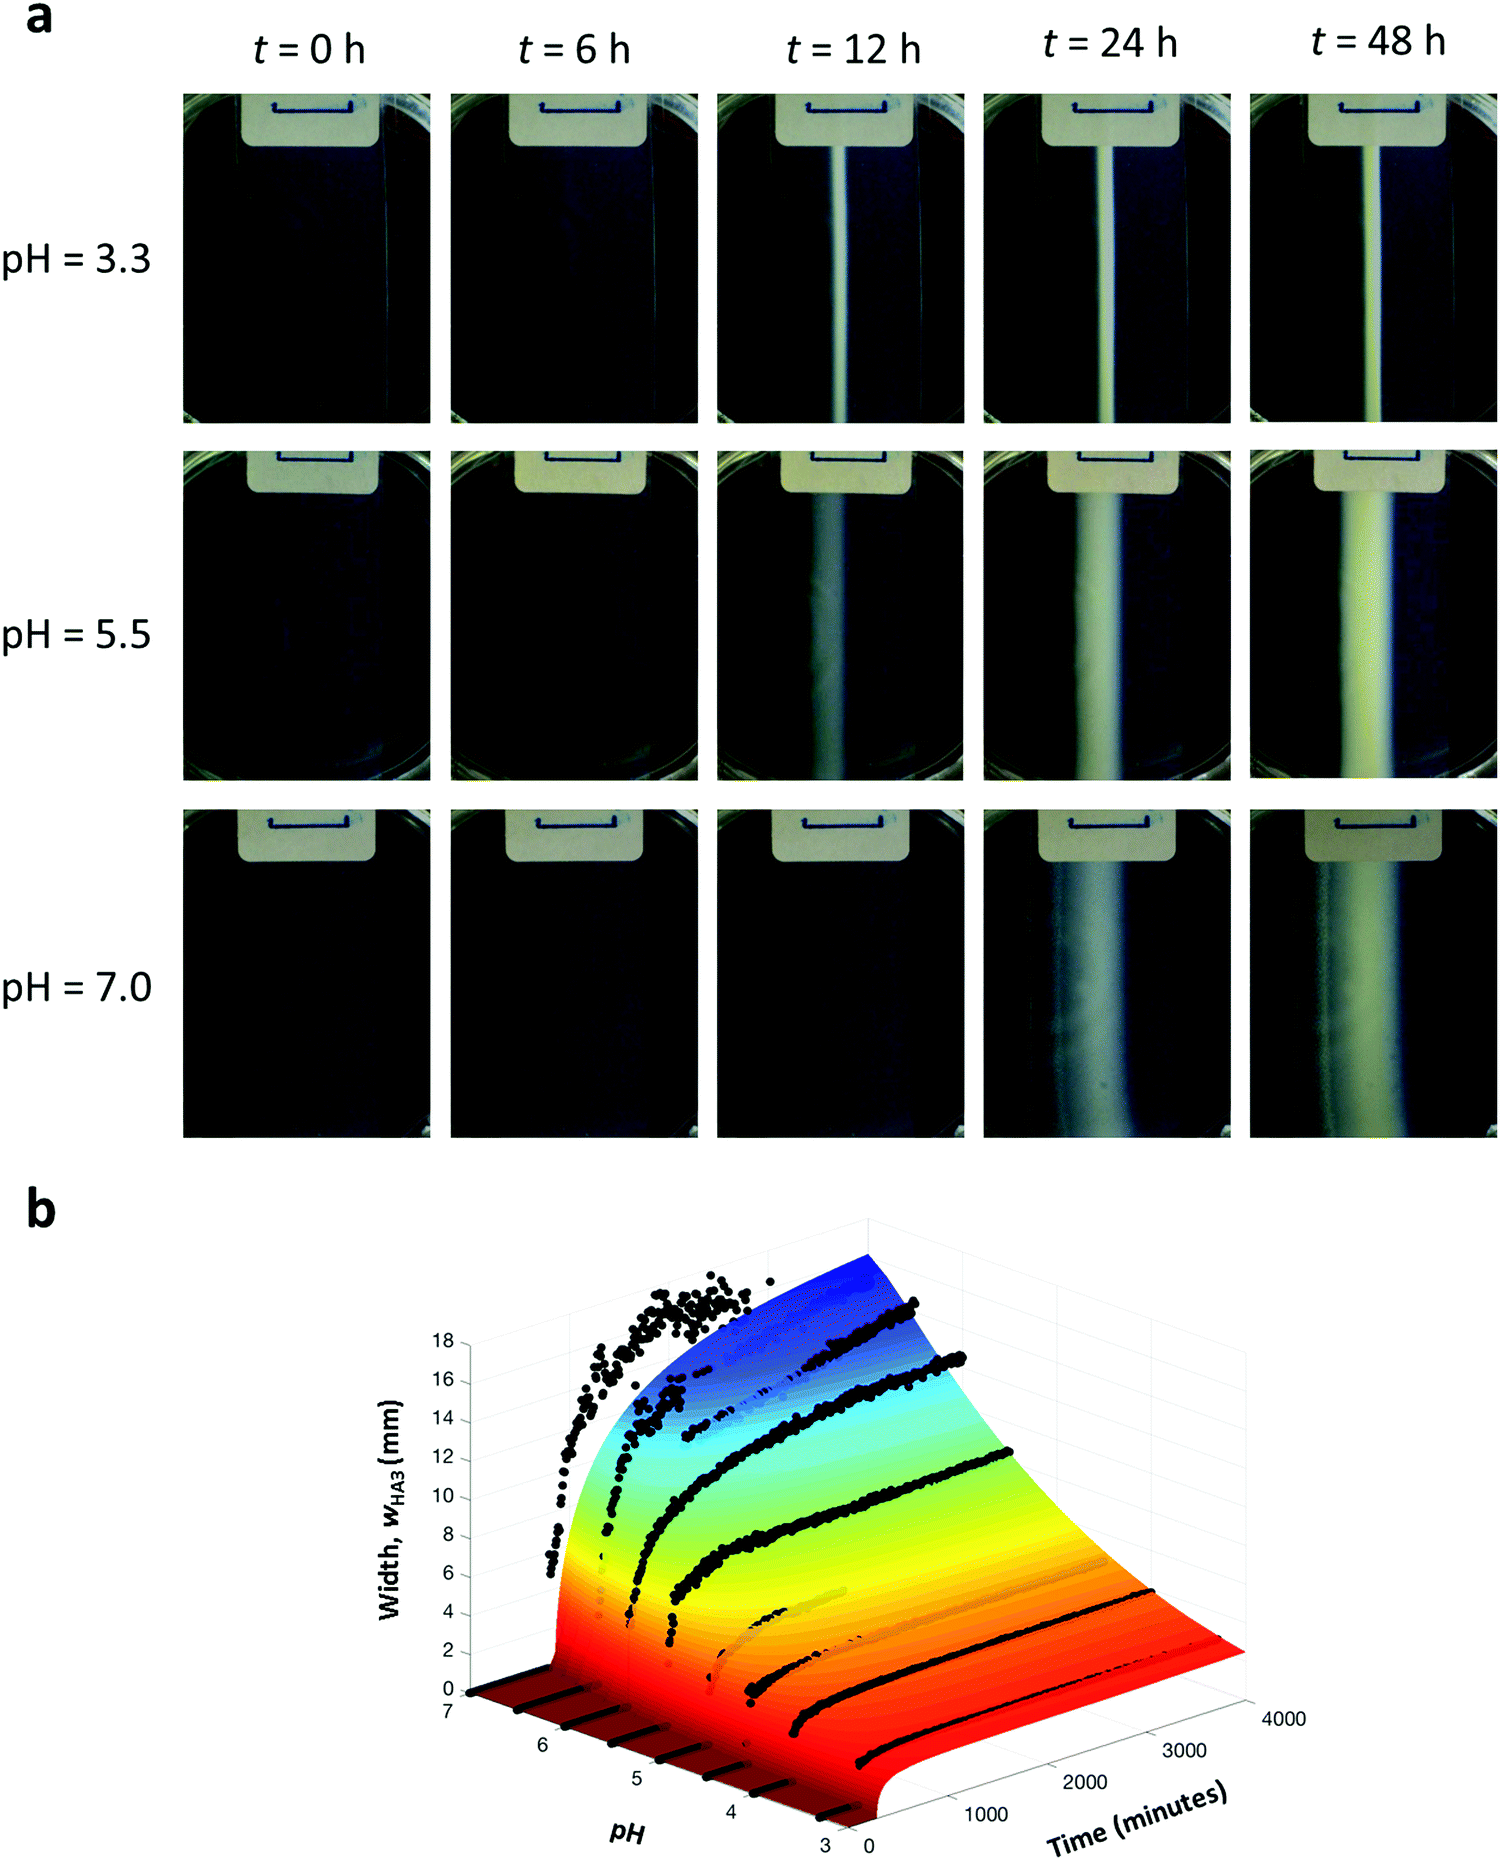
Firstly, we investigated experimentally how the width of the supramolecular object (wHA3) depends on pH while fixing the other two control parameters (L = 20 mm; cH,0 = 40 mM). We hereby defined the width as the distance between the edges of the object, see ref. 27 for further details. In all our experiments, it takes at least the diffusion time before the supramolecular object starts to form, and after its initial formation, the growth slows down and the width approaches a steady value, see Fig. 2a. With increasing pH, object formation started later and the object became wider (from 2.6 to 16.7 mm for pH between 3.3 and 7.0). Both these observations are qualitatively explained from the known reduction in the reaction rate constants at increased pH, such that larger amounts of reagents have diffused to the reaction zone, thus effectively widening it, before reacting to HA3 and the subsequent self-assembly of HA3 into the supramolecular gel. Purely from the reaction rate constants it can be estimated that the reaction rate in the reaction zone is 500–1500 times higher at pH 3.3 than at pH 7.0.
 |
| | Fig. 2 Controlling the width of the supramolecular object by pH. (a) Time snapshots of experiments conducted at pH of 3.3, 5.5 and 7.0, i.e. in conditions ranging from high reaction rate (3.3) to low reaction rate (7.0). (b) Comparison between the RD model (colored surface) and experiment (black dots). The initial pH in the experiments was 3.3, 4.0, 4.5, 5.0, 5.5, 6.0, 6.5, and 7.0. | |
Secondly, we investigated the effect of cH,0 on wHA3 while fixing L = 20 mm, and pH = 4.0. As can be seen in Fig. 3a, object formation started slightly earlier and the final width decreased (from 3.2 to 2.7 mm) when increasing the initial concentrations. These observations are in line with the notion that larger amounts of reagents near the reaction zone lead to faster formation and self-assembly of HA3 and thus smaller object dimensions. From the model discussed later it can be estimated that the reaction rate in the reaction zone is around 13 times higher when cH,0 is 40 mM than when it is 10 mM.
 |
| | Fig. 3 Controlling the width of the supramolecular object by the initial concentration of H. (a) Time snapshots of experiments conducted at 10 mM, 20 mM, and 40 mM H. (b) Comparison between the RD model (colored surface) and experiment (black dots). The initial concentration of H in the experiments was 10.0, 15.0, 20.0, 22.5, 25.0, 27.5, 30.0, 35.0, and 40.0 mM. | |
Finally, the effect of L on wHA3 was investigated by varying the distance between reservoirs of H and A from 5 to 20 mm, while fixing cH,0 = 40 mM and pH = 4.0. Increasing the driving force for diffusion by decreasing this distance shows similar behavior as for increased initial concentrations, with final widths between 1.6 and 2.7 mm, for L = 6.7 and 19 mm, respectively. (Fig. 4a). In this case, the reaction rate in the reaction zone is around 60 times higher when L is 6.7 mm than when it is 19 mm. Taken together, the experimental results show that the final width of the object is most sensitive to changes in pH, while the sensitivity towards the other two control parameters (cH,0 and L) is modest. The reason is that the local reaction rates vary less than 100-fold depending on chosen values for cH,0 and L, while they vary over two or three orders of magnitude by changing the pH in the here studied range.
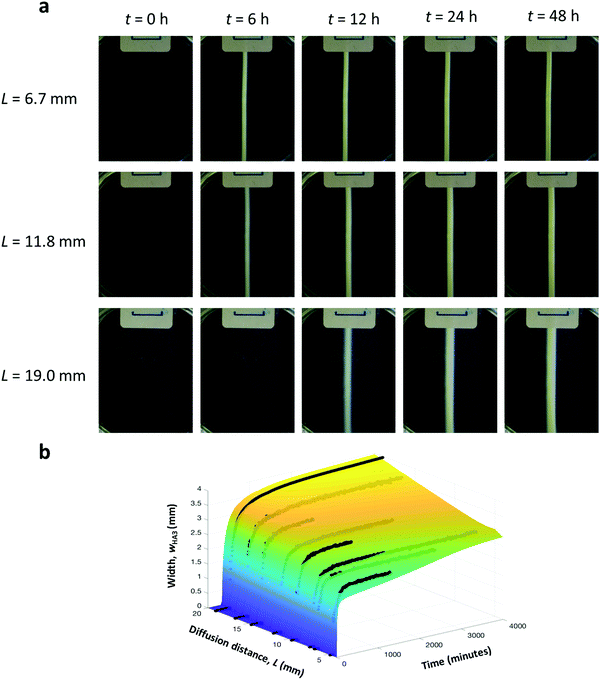 |
| | Fig. 4 Controlling the width of the supramolecular object by distance between reservoirs. (a) Time snapshots of experiments conducted at distances of 6.7 mm, 11.8 mm, and 19.0 mm H. (b) Comparison between the RD model (colored surface) and experiment (black dots). The distance between containers in the experiments was 6.7, 7.3, 9.5, 11.8, 14.6, 16.6, and 19.0 mm. | |
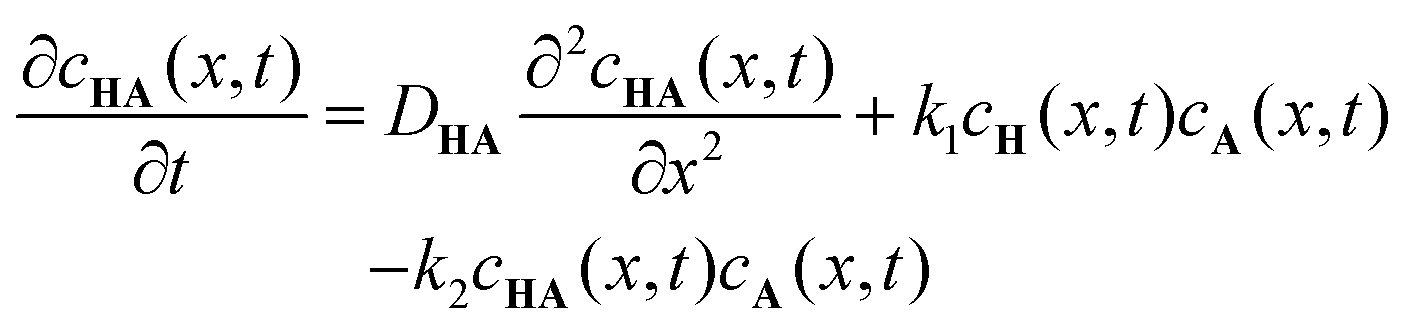
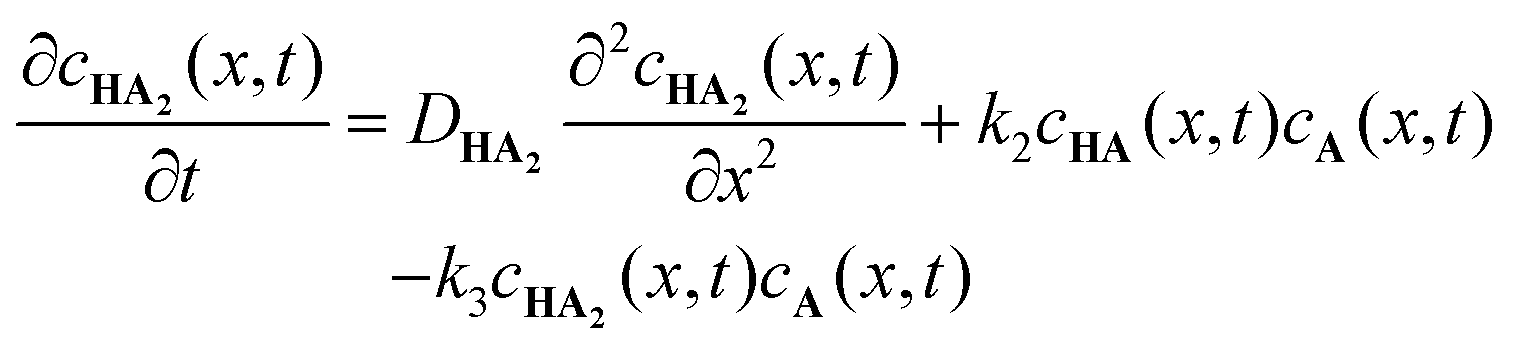
To further understand the formation dynamics of the supramolecular object and its dependence on the experimental control parameters, we developed a quantitative RD model.27 The model is discussed in full detail in our previous work, so we briefly mention its main characteristics herein. The RD process is described as a 1D mathematical problem (along the x axis), in line with geometry used for the experiments in which the net mass transport of the components by diffusion is primarily in one direction. The supramolecular gelator HA3 forms from H and A, through a 3-step reaction via intermediates HA and HA2. These reactions are first order with respect to the concentrations,28,29 and described with reaction rate constants k1, k2, and k3. The following system of coupled differential equations containing diffusion and reaction terms describes the spatio-temporal concentrations of all species:
| |  | (1) |
| | 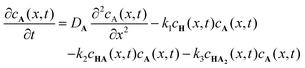 | (2) |
| |  | (3) |
| |  | (4) |
| |  | (5) |
with initial conditions defined as
cH(0, 0) =
cH,0 = 40 mM and
cA(
L, 0) =
cA,0 = 160 mM, and boundary conditions defined as
cHA3(0,
t) =
cHA3(
L,
t) = 0 mM (alike for
HA and
HA2) in line with the lack of observed gel formation in any of the reservoirs during the experiment. Initially, the diffusion coefficients
DH,
DA,
DHA,
DHA2 are set equal to the values found for the diffusion of these components in water inside an agar gel matrix. However, diffusion of
H,
A,
HA and
HA2 changes during the course of each simulation (and experiment) due to the formation of the supramolecular
HA3 gel that slows it down, see ESI
† for more details on the implementation of this behavior. For simplicity, the gelation of
HA3 was simulated by setting
DHA3 to a very low initial value which did not change during the course of simulation (around 5 × 10
5 times smaller than the other diffusion coefficients). The RD model was solved numerically and the resulting concentration profile of
HA3cHA3(
x,
t) was used to determine the evolution of the width
wHA3(
t), allowing direct comparison with the experimental data.
27
The RD model has the same control parameters as those used in the experiments, with the reaction rate constants k1, k2 and k3 being controlled by the pH through established relations.27 A direct comparison between experiments and RD model is presented in Fig. 2b, 3b and 4b. In general, the model shows good agreement with experimental data for all investigated parameters. Fig. 2b shows that wHA3(t) follows the expected trend when changing the reaction rates through the pH. The model captures the experimental data most accurately for lower values of the pH for which objects with sharply defined edges were obtained. For larger pH, i.e. slow reaction kinetics, the edges are less well defined as can be seen in Fig. 2a for pH = 7.0. The difficulty in defining these edges in the experiments due to considerable smearing partly explains the larger discrepancies between the experimental data and the model observed above pH = 5.5. All plateauing values of the width predicted by the model are within 18% of the experimental ones. Good agreement is also found between experiment and the RD model when varying the initial concentration (Fig. 3b) and the diffusion distance (Fig. 4b). As mentioned, the local concentration gradient becomes steeper as cH,0 increases and as L decreases, which leads to higher local concentration of H and A along x (see Fig. S2 and S3, ESI†). Overall, the plateauing values for wHA3 from the model were up to 6.5% larger than the experimental ones for variations in cH,0, and within 15% for variations in L, demonstrating the validity of the RD model.
In an effort to build a tool for quick order-of-magnitude estimation of achievable object dimensions from known experimental parameters, we here present an approach to simplify the mathematical model described in eqn (1)–(5). First, instead of considering three subsequent reactions forming the gelator HA3, we consider the simplified version in which H reacts with A forming a non-diffusing gelator HA (DHA = 0), the reaction rate constant being k. Second, we consider H and A to diffuse equally fast (DH = DA = D). Third, we use a fixed value of D, instead of one that depends on the formation of the gel and its concentration. Fourth, we fix the concentration of H in the container at the left boundary to its initial value, i.e. cH(x = 0, t) = cH,0, and consider sufficiently fast reactions for which H cannot penetrate beyond the reaction zone without having been consumed, such that cH(x = L, t) = 0. Conversely for A: cA(x = L, t) = cA,0, cA(x = 0, t) = 0. Fifth, we set the initial concentrations of H and A equal, i.e. cH,0 = cA,0 = c0. Through these simplifications, the full RD model reduces to the following RD equation
| |  | (6) |
We note that a similar equation holds for
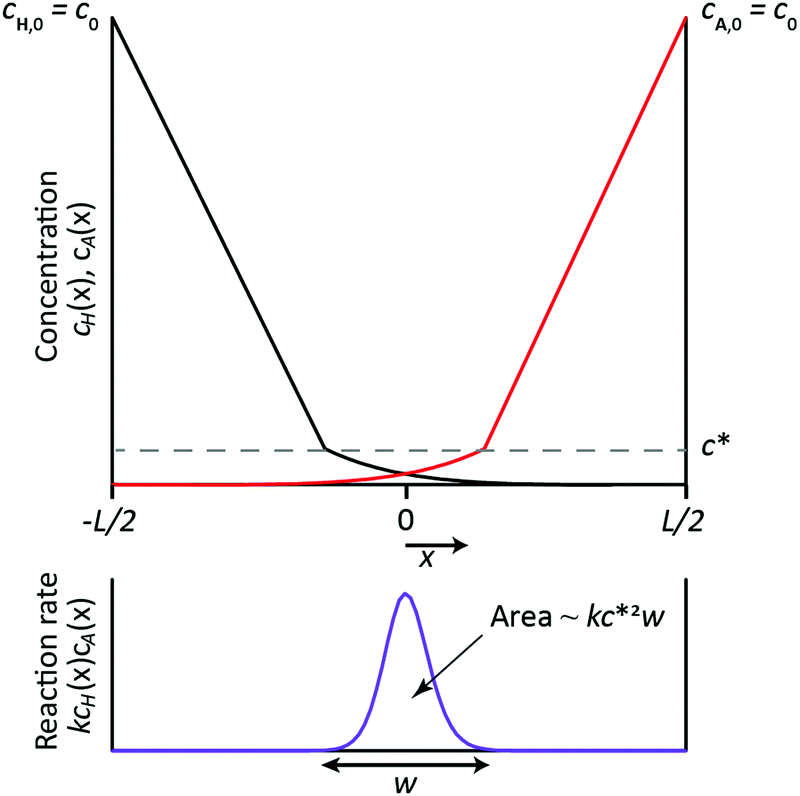
cH, but to obtain a scaling relation for the object dimensions considering one equation is sufficient. A sketch of the concentration profiles of
H and
A, which are mirror symmetric around
x = 0, is shown in the top of
Fig. 5. The reaction between
H and
A occurs in the ‘reaction zone’ where their concentrations overlap, which is a feature common to a reaction front in A + B → C systems.
30 The reaction zone is characterized by the concentration
c* and the width
w, which both need to be determined. Although the simplified model does not include hampering of diffusion of
H and
A by the formation of
HA such that the gel eventually stops growing, it is possible to estimate the final width
w of this reaction zone. This is done based on the notion that the reaction zone does not grow further once
w and
c* reach their steady values. From then onwards, the rate at which
H and
A diffuse into the reaction zone is equal to the rate at which they react inside the reaction zone.
31 Using this notion together with the steady state version of
eqn (6), we can formulate two relations between the two unknowns
w and
c*. First, we set the diffusive flux of
A into the reaction zone equal to the rate at which
A is consumed inside the zone. This equality formally follows from integration of the steady state version of
eqn (6) over the reaction zone:

. The left hand side indeed immediately reduces to the diffusive flux entering the reaction zone as evident from
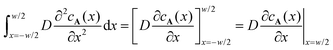
, where we used that the gradient in
cA(
x) vanishes at
x = −
w/2. The concentration profile being linear outside of the reaction zone where no reaction occurs, the order of magnitude of the diffusive flux at the boundary of the reaction zone is simply estimated as

, since the fast reaction allows
c* ≪
c0 and
w ≪
L. The right hand side represents the rate at which
A is consumed in the entire reaction zone as evident from the integration of the local reaction rate
kcH(
x)
cA(
x) over the width of the reaction zone. It represents the area under the curve in the graph in the bottom of
Fig. 5 and its order of magnitude is estimated as
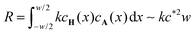
. Equating the two obtained terms

and
kc*
2w, we find the first relation between the unknowns
w and
c*
| |  | (7) |
Second, we consider the reaction zone itself and relate
w and
c* based on the notion that
A and
H diffuse over the width of the zone before being fully consumed. This relation formally follows by integration of the steady state version of
eqn (6) twice over the reaction zone. This gives
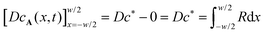
, where the integral over
R is proportional to
kc*
2w2. Hence, we find
| |  | (8) |
Combining
eqn (7) and (8) we obtain the steady width of the reaction zone
| |  | (9) |
where we introduced the dimensionless Damköhler number:

. This number can be seen as a ratio between the time scales for diffusion
τD and reaction
τR and hence naturally appears in RD systems, while the scaling with the −1/3 exponent is characteristic for the here analyzed system.
 |
| | Fig. 5 Schematic representation of a simplified 1D RD setup, gelation being represented as 1-step reaction between H and A, with H and A having the same diffusion coefficient and the same initial concentration c0. Top: Sketch of the steady state concentration profiles of A and H, which diffuse from the boundaries of the domain (at x = −L/2 and x = L/2) towards the center of the domain, with their reaction taking place in a thin zone of width w. Outside this reaction zone, the concentration profiles of H and A are determined purely by diffusion and therefore change linearly from c0 at the boundaries of the domain to c* at boundaries of the reaction zone. Reactants are fully consumed within the reaction zone, such that their concentrations are zero outside of this zone. Bottom: Sketch of the local reaction rate, which is of order kcH*cA* ≈ kc*2 inside the reaction zone and zero elsewhere. The area under the curve represents the rate at which the reactants are consumed in the entire reaction zone, which is estimated as R ∼ kc*2w. | |
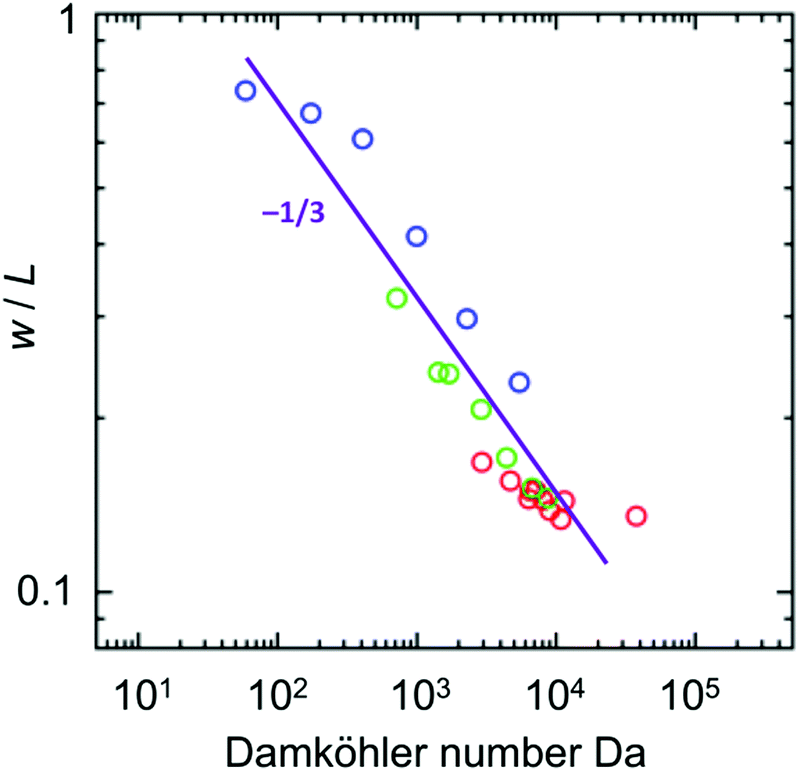
The simple expression for the width of the reaction zone (eqn (9)) can be readily used as a quick order of magnitude estimation of the resulting size of the supramolecular gel from the experimental parameters. This analysis teaches that all experimental data points in Fig. 2b, 3b and 4b should collapse on a single master curve when plotting the final width of the supramolecular hydrogel against Da. As can be seen in the log–log plot in Fig. 6, the slope of the plot is −0.35 ± 0.03, in good agreement with the exponent of −1/3 obtained from the simplified model. We do note a slight deviation for the data set with different initial concentrations (red points). Although the reason is unknown, we confirm this deviation is also seen in the full model, so not an artifact of the experiments. The quantitative agreement between experiments and full model (Fig. 2b, 3b and 4b) together with the qualitative agreement (scaling behavior) between experiments and simplified model (Fig. 6) show that the used assumptions are reasonable and that the simplified model captures the features of the here studied reaction–diffusion system. This shows that knowing the experimental parameters of the RD system, one can obtain a quick order-of-magnitude estimates of the resulting object dimensions through the use of the Damköhler number. We note that one of the key assumptions in this work is that the reaction is fast compared to diffusion, such that the reaction occurs in a well-defined reaction zone. The simplified model hence is developed for RD systems with Da ≫ 1. Previously, Grzybowski showed that the size of cores made inside of cubical particles using RD can be estimated from analysis of underlying RD equations.24 In this work, we showed that the same is valid for a different experimental system suggesting the generality of this approach for estimation of the size of object in other object-forming RD systems. Therefore, the rational experimental design should include this type of analysis followed by experimental confirmation. Then, if desired, the full RD model can be used to explore the parameter space at a higher precision.
 |
| | Fig. 6 Control of the width of supramolecular object by pH (blue), the initial concentration of H (cH,0, red), and the distance between the reservoirs (L, green) represented in terms of Damköhler number Da. The diffusion coefficient used for calculation was 5.40 × 10⁻⁶ cm2 s−1, and the reaction rate constant was defined with the term 10−(0.74pH+0.42) mM−1 s−1.27 The experimental data fits to a power law (purple line) with a slope of −0.35 ± 0.03 which is in agreement with the theoretical slope of −1/3 (eqn (9)). | |
Conclusions
In summary, this study finds that controlling local reaction kinetics by means of pH, diffusion length and the concentrations of reactants allows control over the dimensions of formed supramolecular objects. Furthermore, it is shown that the influence of all these control parameters on object width can be unified using the Damköhler number, thus providing a simple to use relation between experimental parameters and structure dimensions. This relation can be used as a tool for quick order-of-magnitude estimates of structure dimensions for chosen experimental conditions. Finally, our study suggests that control over concentration gradients and reactivity combined with self-assembly can be a powerful tool for the design of soft matter objects of defined sizes.
Conflicts of interest
There are no conflicts to declare.
Acknowledgements
This work is supported by the Dutch Organisation for Scientific Research (Vidi grant to R. E., Complexity programme R. E., J. H. v. E. and W. E. H.), Marie Curie initial training network ‘SMARTNET’ (project no. 316656; J. H. v. E. and M. L.) and NanoNextNL, a micro and nanotechnology consortium of the Government of the Netherlands and 130 partners (project no. 07 A.11; J. H. v. E. and M. L.).
References
- M. Verhulsel, M. Vignes, S. Descroix, L. Malaquin, D. M. Vignjevic and J. L. Viovy, Biomaterials, 2014, 35, 1816–1832 CrossRef CAS PubMed.
- R. Gauvin, Y. C. Chen, J. W. Lee, P. Soman, P. Zorlutuna, J. W. Nichol, H. Bae, S. C. Chen and A. Khademhosseini, Biomaterials, 2012, 33, 3824–3834 CrossRef CAS PubMed.
- A. P. Zhang, X. Qu, P. Soman, K. C. Hribar, J. W. Lee, S. C. Chen and S. L. He, Adv. Mater., 2012, 24, 4266 CrossRef CAS PubMed.
- F. Pati, J. Jang, D.-H. Ha, S. Won Kim, J.-W. Rhie, J.-H. Shim, D.-H. Kim and D.-W. Cho, Nat. Commun., 2014, 5, 3935 CrossRef CAS PubMed.
- B. Duan, E. Kapetanovic, L. A. Hockaday and J. T. Butcher, Acta Biomater., 2014, 10, 1836–1846 CrossRef CAS PubMed.
- T. Q. Huang, X. Qu, J. Liu and S. C. Chen, Biomed. Microdevices, 2014, 16, 127–132 CrossRef PubMed.
- B. G. Chung, K.-H. Lee, A. Khademhosseini and S.-H. Lee, Lab Chip, 2012, 12, 45–59 RSC.
-
(a) P. J. Heaney and A. M. Davis, Science, 1995, 269, 1562–1565 CrossRef CAS PubMed;
(b) I. R. Epstein and B. Xu, Nat. Nanotechnol., 2016, 11, 312–319 CrossRef CAS PubMed.
- J. Tabony, N. Glade, J. Demongeot and C. Papaseit, Langmuir, 2002, 18, 7196–7207 CrossRef CAS.
- E. A. Newman and K. R. Zahs, Science, 1997, 275, 844–847 CrossRef CAS PubMed.
- S. V. Straub, D. R. Giovannucci and D. I. Yule, J. Gen. Physiol., 2000, 116, 547–559 CrossRef CAS PubMed.
- P. P. Dzeja and A. Terzic, J. Exp. Biol., 2003, 206, 2039–2047 CrossRef CAS.
- P. P. Dzeja and A. Terzic, FASEB J., 1998, 12, 523–529 CrossRef CAS PubMed.
- T. Mair, C. Warnke, K. Tsuji and S. C. Muller, Biophys. J., 2005, 88, 639–646 CrossRef CAS PubMed.
-
J. G. Reich and E. E. Sel'kov, Energy metabolism of the Cell: A Theoretical Treatise, Academic Press, London, 1981 Search PubMed.
- J. Tabony, N. Glade, J. Demongeot and C. Papaseit, Langmuir, 2002, 18, 7196–7207 CrossRef CAS.
- A. M. Turing, Philos. Trans. R. Soc. London, Ser. B, 1952, 237, 37–72 Search PubMed.
- A. N. Zaikin and A. M. Zhabotinsky, Nature, 1970, 225, 535–537 CrossRef CAS PubMed.
- S. Kondo and R. Asai, Nature, 1995, 376, 765–768 CrossRef CAS PubMed.
- S. Kondo, Genes Cells, 2002, 7, 535–541 CrossRef CAS PubMed.
- T. X. Jiang, R. B. Widelitz, W. M. Shen, P. Will, D. Y. Wu, C. M. Lin, H. S. Jung and C. M. Chuong, Int. J. Dev. Biol., 2004, 48, 117–135 CrossRef CAS PubMed.
-
(a) W. L. Noorduin, A. Grinthal, L. Mahadevan and J. Aizenberg, Science, 2013, 340, 832–837 CrossRef CAS PubMed;
(b) C. N. Kaplan, W. L. Noorduin, L. Li, R. Sadza, L. Folkertsma, J. Aizenberg and L. Mahadevan, Science, 2017, 355, 1395–1399 CrossRef CAS PubMed.
- T. S. Shim, S. M. Yang and S. H. Kim, Nat. Commun., 2015, 6, 6584 CrossRef PubMed.
-
B. A. Grzybowski, Chemistry in Motion: Reaction-Diffusion Systems for Micro- and Nanotechnology, Wiley, 2009 Search PubMed.
-
(a) S. M. Chirieleison, P. B. Allen, Z. B. Simpson, A. D. Ellington and X. Chen, Nat. Chem., 2013, 5, 1000–1005 CrossRef CAS PubMed;
(b) A. S. Zadorin, Y. Rondelez, J. C. Galas and A. Estevez-Torres, Phys. Rev. Lett., 2015, 114, 068301 CrossRef CAS PubMed;
(c) A. S. Zadorin, Y. Rondelez, G. Gines, V. Dilhas, G. Urtel, A. Zambrano, J.-C. Galas and A. Estevez-Torres, Nat. Chem., 2017, 9, 990–996 CrossRef CAS PubMed.
- S. N. Semenov, A. J. Markvoort, T. F. de Greef and W. T. Huck, Angew. Chem., Int. Ed., 2014, 53, 8066–8069 CrossRef CAS PubMed.
-
(a) M. Lovrak, W. E. J. Hendriksen, C. Maity, S. Mytnyk, V. van Steijn, R. Eelkema and J. H. van Esch, Nat. Commun., 2017, 8, 15317 CrossRef CAS PubMed;
(b) M. Lovrak, S. J. Picken, R. Eelkema and J. H. van Esch, ChemNanoMat, 2018, 4, 772–775 CrossRef CAS.
- A. Dirksen, S. Dirksen, T. M. Hackeng and P. E. Dawson, J. Am. Chem. Soc., 2006, 128, 15602–15603 CrossRef CAS PubMed.
- D. Larsen, M. Pittelkow, S. Karmakar and E. T. Kool, Org. Lett., 2015, 17, 274–277 CrossRef CAS PubMed.
- L. Gálfi and Z. Rácz, Phys. Rev. A: At., Mol., Opt. Phys., 1988, 38, 3151(R) CrossRef.
-
W. M. Deen, Analysis of Transport Phenomena, OUP USA, 1998 Search PubMed.
Footnote |
| † Electronic supplementary information (ESI) available. See DOI: 10.1039/c8sm02588f |
|
| This journal is © The Royal Society of Chemistry 2019 |
Click here to see how this site uses Cookies. View our privacy policy here. 
 Open Access Article
 This Open Access Article is licensed under a Creative Commons Attribution-Non Commercial 3.0 Unported Licence
 ,
Wouter E.
Hendriksen
,
Michiel T.
Kreutzer
,
Volkert
van Steijn
,
Wouter E.
Hendriksen
,
Michiel T.
Kreutzer
,
Volkert
van Steijn


 . The left hand side indeed immediately reduces to the diffusive flux entering the reaction zone as evident from
  , where we used that the gradient in cA(x) vanishes at x = −w/2. The concentration profile being linear outside of the reaction zone where no reaction occurs, the order of magnitude of the diffusive flux at the boundary of the reaction zone is simply estimated as
  , since the fast reaction allows c* ≪ c0 and w ≪ L. The right hand side represents the rate at which A is consumed in the entire reaction zone as evident from the integration of the local reaction rate kcH(x)cA(x) over the width of the reaction zone. It represents the area under the curve in the graph in the bottom of Fig. 5 and its order of magnitude is estimated as
 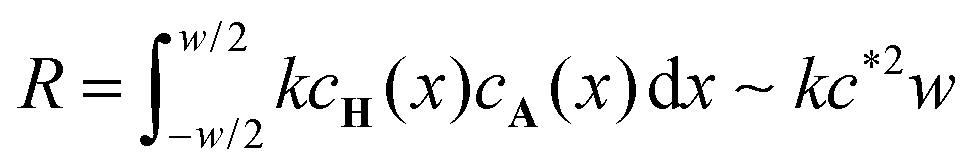 . Equating the two obtained terms
  and kc*2w, we find the first relation between the unknowns w and c*
 , where the integral over R is proportional to kc*2w2. Hence, we find

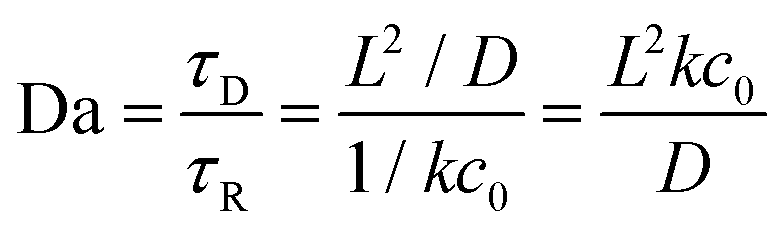 . This number can be seen as a ratio between the time scales for diffusion τD and reaction τR and hence naturally appears in RD systems, while the scaling with the −1/3 exponent is characteristic for the here analyzed system.