
 Open Access Article
 This Open Access Article is licensed under a Creative Commons Attribution-Non Commercial 3.0 Unported Licence
Formation of phase separated vesicles by double layer cDICE†
Katharina
Dürre
and
Andreas R.
Bausch
 *
*
Lehrstuhl für Zellbiophysik E27, Technische Universität München, James-Franck-Straße 1, 85748 Garching, Germany. E-mail: abausch@mytum.de
First published on 30th October 2019
Abstract
Recently, continuous droplet interface crossing encapsulation (cDICE) was developed, which allows fast and efficient production of giant unilamellar vesicles (GUVs) under high salt conditions, at low temperature and with low consumption of the encapsulated proteins. Unfortunately, cholesterol encapsulation within the lipid bilayer was not efficient for the cDICE protocol so far and thus the formation of phase separated vesicles was limited. Here we present a modified version of cDICE that allows incorporation of cholesterol into lipid bilayers and enables the reproducible formation of phase-separated vesicles. We show that cholesterol incorporation relies on the amount of mineral oil in the lipid–oil emulsions, which is essential for protein encapsulation inside GUVs by cDICE. The possibility of creating phase separated vesicles by cDICE will enable the study of the interdependence between phase separation and cytoskeletal proteins under confinement.
Introduction
The molecular composition of cellular membranes is heterogeneous and their lateral organization is diverse. Over the last two decades, the lipid raft model was established to account for lateral membrane inhomogeneities. Lipid rafts are dynamic nano-domains of nanoscale size and have the ability to fuse into large micro-domains. They are typically enriched with cholesterol, sphingomyelins and proteins and serve as a functional platform for various cellular processes like signal transduction and molecular trafficking.1–4 In reconstituted membrane systems, lipids have been shown to also enable phase separation. When a high melting temperature lipid is mixed with a low melting temperature lipid the membrane phase separates into a liquid phase and a solid lipid phase (liquid–solid separation) below a certain transition temperature TM. The addition of cholesterol leads to the separation into two liquid phases. They are called the liquid-ordered (Lo) and liquid-disordered (Ld) phases (liquid–liquid phase separation). The Lo phase is enriched with cholesterol and the high-melting temperature lipid, whereas the low-melting temperature lipid mainly sorts predominantly into the Ld phase. The Lo phase is less fluid compared to the Ld phase as lipids and cholesterol are tightly packed.5–7 Over the past years, such model membranes have been used to study the lipid raft dynamics and the interplay between actin network formation and membrane organization.8–12 Polymerization of dendritic actin networks around phase separated GUVs reveals that actin polymerization induces phase separation and controls their organization.13 Studies on the interaction of contractile actin networks with supported lipid bilayers showed reorganization of membrane dynamics upon network contraction.14,15 Still, an important question of how network organization can steer cytoskeletal network formation and control force transduction between the cytoskeleton and the cellular membrane remains.Encapsulation of actin networks inside the droplets and giant unilamellar vesicles (GUVs) by inverted emulsion techniques is a common approach to study actin membrane interactions.16–20 In particular, continuous droplet interface crossing encapsulation (cDICE) has been effectively used to encapsulate large proteins (>10 kDa).21–24 The cDICE approach is based on an inverted emulsion technique.17,19 It allows efficient encapsulation of large proteins even under high salt conditions, at fast production times (∼5 min), at low temperatures (∼4 °C), and with low protein consumption and waste (∼50 μl).17 Briefly, a capillary is filled with an aqueous protein solution and inserted into a rotating chamber. At first droplets are formed in the innermost decane layer. The centrifugal forces push the droplets into the lipid–oil solution. A first monolayer assembles around the aqueous protein solution. This monolayer then zips together with a second monolayer, which assembles at the interface between the lipid–oil solution and the outermost aqueous solution. As a result GUVs are formed and can be harvested.17
The production of phase separated vesicles by cDICE is possible but very limited. Only low fractions of cholesterol (<10%) are incorporated into the membrane,25 which are not sufficient to induce phase separation into liquid–liquid coexistence.8 Phase separation could be only observed upon external addition of cholesterol to already formed vesicles.25 Yet, it has recently been shown that the emulsion phase transfer technique allows the incorporation of sufficient amounts of cholesterol into the final lipid bilayer to enable liquid–liquid separation. However full sized proteins could not be encapsulated.26
Here, a modified protocol of cDICE was developed, which enables the production of phase separated vesicles at room temperature. At first the incorporation efficiency of cholesterol into the lipid bilayer was investigated. These results were used to adapt the final production protocol of cDICE. Only in the absence of any mineral oil enough cholesterol segregated into the vesicle's membrane and separation into liquid–liquid coexistence was observed. The yield of phase separated vesicles could be improved significantly, when an additional lipid–oil layer was introduced before the glucose solution. This layer was free of mineral oil and contained cholesterol. With this protocol almost 100% of the harvested vesicles phase separated into liquid–liquid coexistence below the miscibility temperature TM. The membrane morphology depended on the ratio between the low melting temperature lipid (DOPC) and the high melting temperature lipid (DPPC). The Ld phase was functionalized by NiNTA lipids and specifically binds His-tagged GFP.
Materials and methods
Materials
1,2-Dipalmitoyl-sn-glycero-3-phosphocholine (DPPC), 1,2-dioleoyl-sn-glycero-3-phosphocholine (DOPC), 1,2-dioleoyl-sn-glycero-3-[(N-(5-amino-1-carboxypentyl)iminodiacetic acid)succinyl] (nickel salt) (NiNTA), and 1,2-dipalmitoyl-sn-glycero-3-phosphoethanolamine-N-[methoxy(polyethylene glycol)-2000] (PEG2000) were ordered from Avanti Polar Lipids (850335, 850375, 790404, and 880160). All lipids were ordered in the chloroform dissolved form. Texas Red™ 1,2 dihexadecanoyl-sn-glycero-3-phosphoethanolamine, triethylammonium salt (Texas Red-DHPE), was ordered from Thermo Fischer Scientific (T1395MP). Cholesterol was ordered from Sigma Aldrich (C8667). Texas Red-DHPE and cholesterol were dissolved in 100% chloroform (Sigma Aldrich, 372978). The silicone oil was ordered from Carl Roth (4020.1), and mineral oil and decane were both purchased from Sigma Aldrich (M3516, 457116).Lipid–oil emulsions
The mineral oil rich lipid–oil emulsion (lipid–oil phase 1) was prepared according to recently published data.23 To prepare 10 ml of the cholesterol rich lipid–oil emulsion (lipid–oil phase 2) the desired amounts of phospholipids and cholesterol were dissolved at first in 600 μl decane, and then 9.4 ml silicone oil were added while gently vortexing. The total amount of lipids within the emulsion is 0.5 mM (including cholesterol and corresponding to approx. 0.4 mg ml−1). In all used lipid–oil emulsion 0.06% of Texas Red-DHPE lipids were added to visualize the phase separation. The lipid–oil emulsions were used within the same day of preparation.Vesicle production
The vesicles were produced according to a modified protocol of cDICE, where an emulsion transfer was achieved using a rotating chamber (see also Fig. 2).17 Glass capillaries with a final diameter of 20 μm were used to insert the aqueous sucrose droplets into the rotating chamber. The centrifugal forces transfer the droplets into the mineral-oil rich phase (lipid–oil phase 1) and then into the cholesterol rich lipid–oil phase 2. Finally, the coated aqueous sucrose droplets zip together with a second monolayer assembled at the W/O interface between the lipid–oil phase 2 and the outermost aqueous glucose solution. Vesicles can be collected from the glucose solution. Vesicle production was performed at room temperature with a speed of rotation of 1800 rpm. The final aqueous glucose solution adapted 10–20 mOsmol higher compared to the encapsulated sucrose solution.His-GFP encapsulation
3 μM of His-GFP stored in PBS (pH 7.4) were encapsulated with 30% sucrose inside GUVs. Thereby the lipid–oil phase 1 contained 50% DPPC, 50% DOPC, 0.06% Texas Red-DHPE and 5% NiNTA. The lipid–oil phase 2 contained 60% cholesterol, 20% DPPC, 15% DOPC, 0.06% Texas Red-DHPE and 5% NiNTA. The osmotic pressure of the outer glucose solution adapted 10–20 mOsmol higher than the encapsulated His-GFP solution.Microscopy
Bright-field and epifluorescence images of the vesicles were taken using a 100× numerical aperture (N.A.) 1.4 oil immersion objective on a commercially built Leica Microscope DMI3000 B in combination with a Hamamatsu ORCA-ER camera. A home-built temperature control system was used. 3D-stacks of the vesicles were taken every 30 seconds. The heating rate was ∼0.025 °C s−1 and the cooling rate was ∼0.016 °C s−1. The confocal images of His-GFP GUVs were taken with a Leica TSC SP5 and a 63× N.A. 1.4 oil immersion objective. Turbidity measurements were performed with a UV/Vis spectrometer (DU 730, Beckman Coulter).Results
Liquid–liquid coexistence depends on mineral oil content
Experiments with the standard cDICE method indicated that the incorporation efficiency of cholesterol depended on the presence of mineral oil. For vesicle fabrication, a composition of 1/1 DOPC/DPPC and 40% cholesterol was dissolved in a mixture of 14% mineral oil, 6% decane and 80% silicone oil. To visualize phase separation, a small fraction of the fluorescent lipid Texas Red-DHPE (0.06%), which is known to sort into the liquid disordered phase, was added to the lipid–oil mixture.27 Phase separation only occurred in about 30% of the observed vesicles (see Fig. 1). The boundaries between two phases were non-circular and non-dynamic, which is characteristic of the separation into a liquid disordered phase and a (bright) gel-like solid phase (dark).28,29 The remaining 70% of the vesicles were not phase separated and the dye was homogeneously distributed within the lipid bilayer. A decrease of the amount of mineral oil to 7% did not improve the yield of phase separated vesicles. Only about 4% showed liquid–solid phase separation at all (see Fig. 1). Next, mineral oil was completely omitted in the lipid–oil mixtures to determine its influence on phase separation. More than 80% of the vesicles showed phase separation, the rest were not phase separated. In about 75% of the phase separated vesicles, the bilayer segregated into large bright and dark domains (see Fig. 1). The boundaries were circular and fusion of smaller domains into larger ones could be observed. This is characteristic of the coexistence of two liquid phases, a bright Ld phase and a dark Lo phase. These only appear when enough cholesterol (≥10%) is incorporated into the membrane.8,28 The main components of the Lo phase are the high-melting temperature lipid DPPC and cholesterol.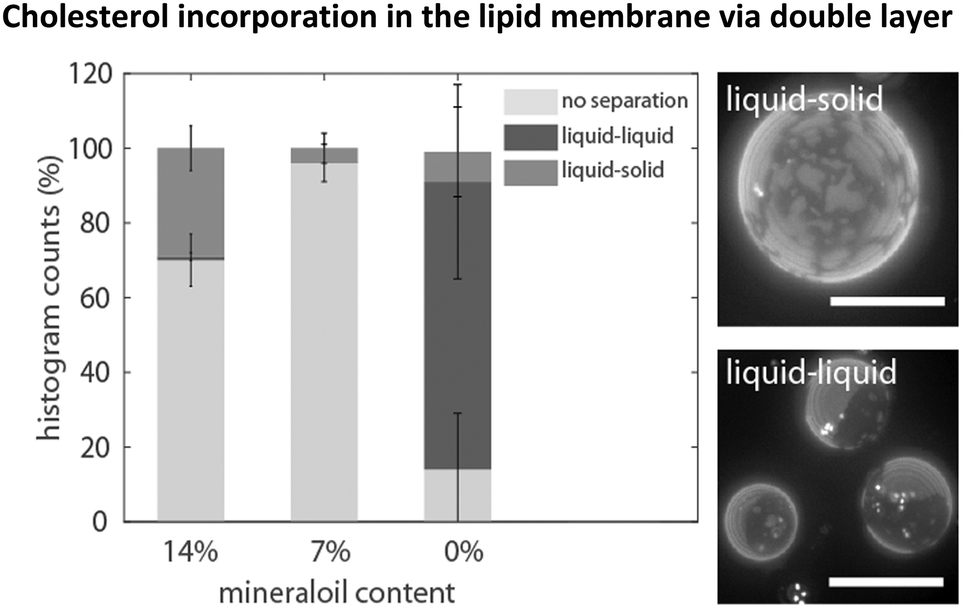 | ||
| Fig. 1 Vesicles were produced from lipid–oil mixtures composed of DOPC/DPPC 1/1 and 40% cholesterol. The emergence of phase separation depended on the presence of mineral oil in the lipid–oil emulsions. On the right side, the different morphologies of phase separation are shown. Vesicles were either not separated, or segregated into a liquid-like and gel-like phase (liquid–solid) or separated into a liquid-ordered and -disordered phase (liquid–liquid). The experiments were performed three times. Scale bars are 20 μm. | ||
Cholesterol incorporation in the lipid membrane via double layer cDICE
As the formation of vesicles with liquid–liquid coexistence was enhanced in the absence of any mineral oil, we adapted the cDICE protocol and inserted an additional oil layer containing the desired amount of cholesterol, phospholipids, 6% decane, 94% silicone oil and no mineral oil (lipid–oil phase 2) into the fabrication chamber covering the last third of the total oil phase (see Fig. 2). The remaining 2/3 of the total lipid–oil layer were composed of 14% mineral oil, 80% silicone oil, 6% decane and the desired amounts of phospholipids (lipid–oil phase 1). Thus, protein droplets pass two layers composed of different lipid–oil mixtures instead of one, thus this modified version of cDICE is called double-layer cDICE (dl-cDICE). At first the droplets pass the cholesterol poor, but mineral oil rich lipid–oil phase 1 and second the cholesterol rich, mineral oil poor lipid–oil phase 2.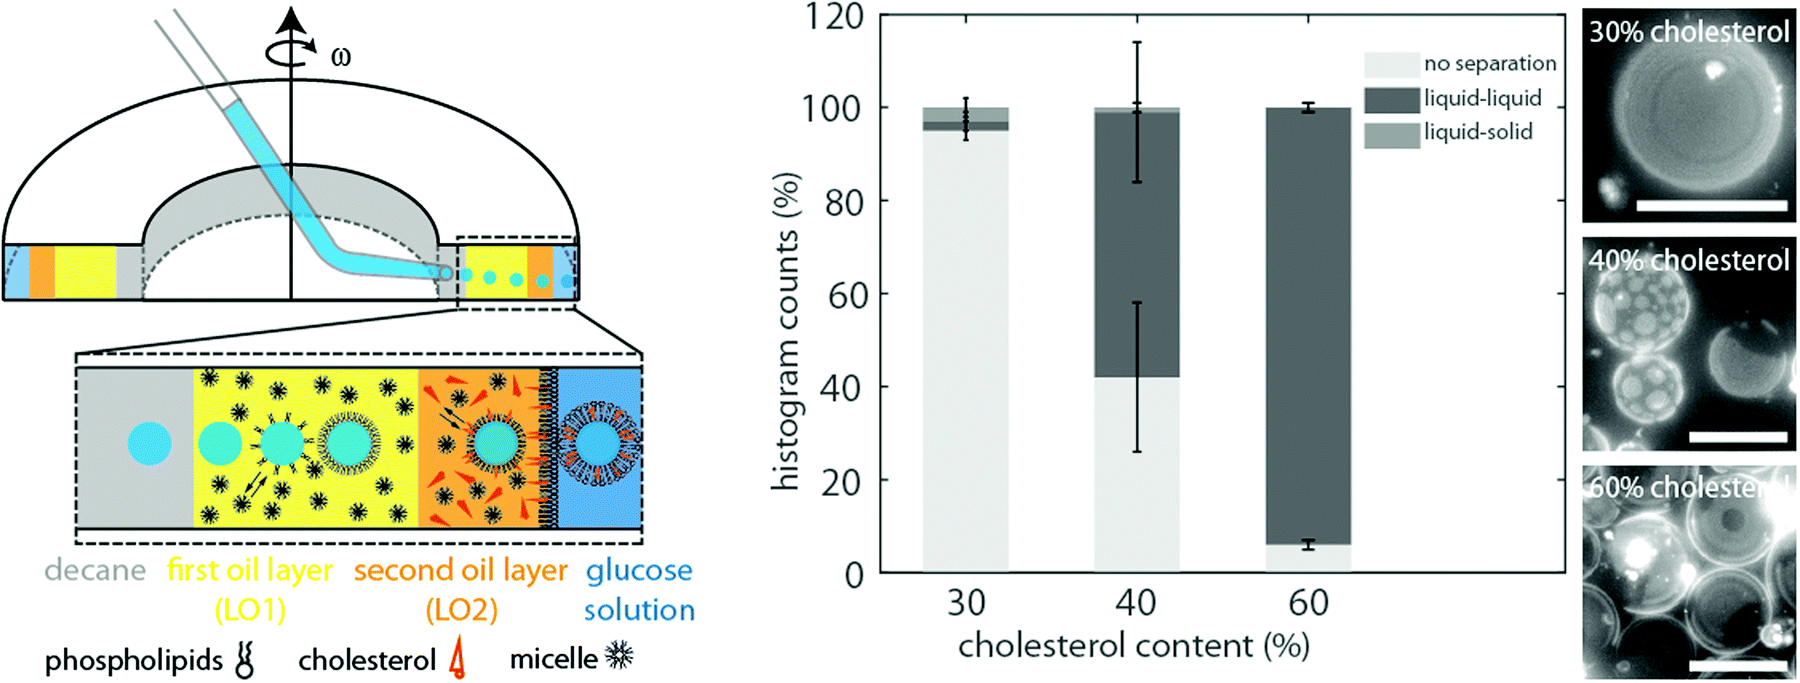 | ||
| Fig. 2 On the left side the formation of phase separated vesicles produced by double-layer cDICE (dl-cDICE) is shown. An additional oil layer that does not contain mineral oil but cholesterol was inserted into the chamber before the glucose solution to increase the incorporation efficiency of cholesterol in the lipid bilayer. To prepare the lipid–oil mixture of the first layer (lipid–oil phase 1) only phospholipids in the desired ratio were dissolved in a mixture of 6% decane, 14% mineral oil and 80% silicone oil. For the second oil layer (lipid–oil phase 2) cholesterol and the phospholipids were dissolved in 6% decane and 94% silicone oil. The histogram on the right side indicates that high amounts of cholesterol are required in the lipid–oil phase 2 to produce vesicles with dl-cDICE that phase separate into a liquid-ordered and -disordered phase (liquid–liquid). The DOPC/DPPC ratio was 1/1 and was kept constant for all shown experiments. The experiments were performed three times. Scale bars are 20 μm. | ||
Different percentages of cholesterol were tested to find the required minimal cholesterol concentration in the lipid–oil phase 2 mixture. This series of experiments was done with a 1/1 DOPC/DPPC lipid mixture. At a cholesterol percentage of 30% no liquid–liquid phase separation was observed for 95% of the vesicles (see Fig. 2). An increase of the cholesterol content to 40% led to liquid–liquid coexistence in more than 55% of the vesicles. In some cases phase separation was induced after light exposure for 30 s up to several minutes. In these cases, shortly after the initiation of phase separation two phases with frayed boundaries were observed. They quickly merged together and formed circular domains (see Fig. S1, ESI†). The photo-toxicity dependence of the phase separation indicates that the vesicles were observed near the miscibility transition. Therefore, a further increase of cholesterol should shift the composite membranes away from the miscibility transition towards the unstable mixing regime. Indeed, when the initial cholesterol concentration was increased to 60%, liquid–liquid coexistence became instantaneously visible in more than 90% of the observed vesicles, when the temperature was below the transition temperature TM (see Fig. 2).
Characterization of phase separation and comparison to electroformation
The amount of the Lo phase (dark) increased as the area covered with the Ld phase (bright) decreased with an increasing concentration of DPPC, which was observed at both initial cholesterol concentrations used here (60% and 80%) (see Fig. 3). Thus, the size of the two liquid phases depended rather on the ratio between the low and high melting temperature lipids (DOPC and DPPC) than on the variations of cholesterol concentration.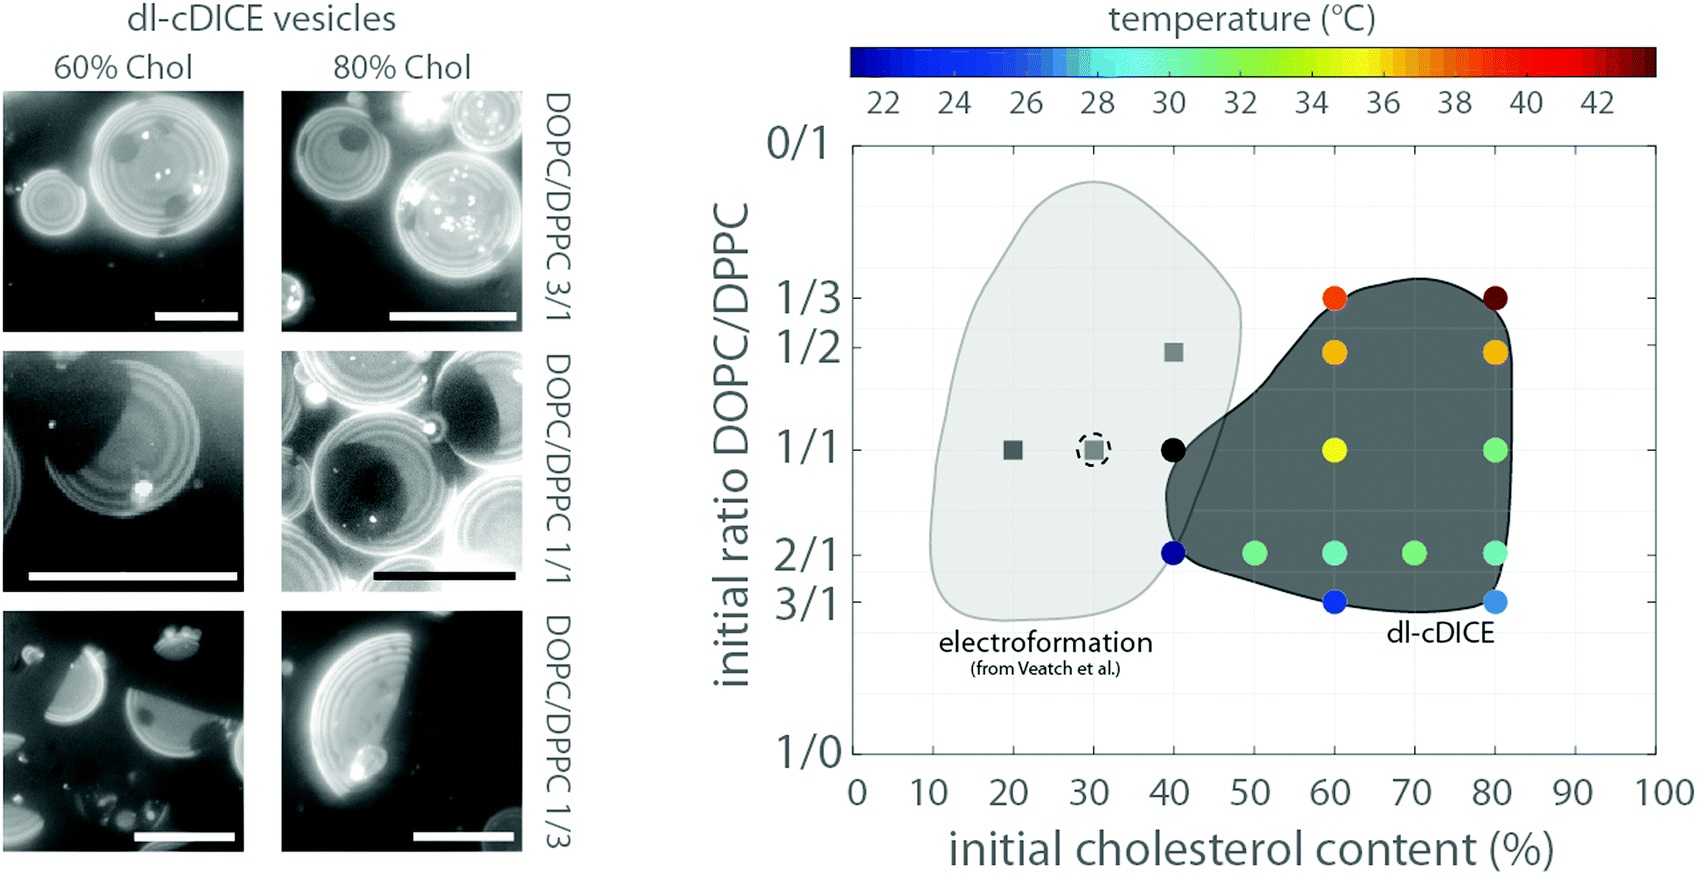 | ||
| Fig. 3 On the left side, exemplary z-projections of the lower hemisphere of GUVs at the indicated initial lipid compositions are shown. On the right side the transition temperatures for different lipid compositions are shown in the diagram (coloured circles). The axis indicates the used initial cholesterol and phospholipid content in the oil phase in dl-cDICE and the lipid chloroform mixture for electroformation. The TMs were measured during the heating cycle. The region, where phase separation occurred, is schematically marked by the dark grey area. The black circle indicates that the transition temperature was not resolvable. The light grey area indicates the lipid compositions of electroformed vesicles, where liquid–liquid phase separation was observable. The data were taken from Veatch et al.9 To ensure the comparability between our data set and that of Veatch et al., we repeated the electroformation experiments for three different compositions (squares). The dashed empty circle indicates a lipid composition of dl-cDICE which did not phase separate, demonstrating that the effective cholesterol content in the vesicle bilayers of such formed vesicles is at least a factor of 2–3 smaller than the initial concentration. All scale bars are 20 μm. | ||
Importantly, at least 40% cholesterol was required in the lipid–oil phase 2 in order to produce vesicles with liquid–liquid phase separation. This is in stark contrast to vesicles formed by electroformation. They already separated into liquid–liquid coexistence at a cholesterol concentration of 10%8 (see Fig. 3). We confirmed this by a series of electroformation experiments, where phase separation occurred between 20% and 40% of cholesterol in the initial lipid mixture (see Fig. 3 and Fig. S2, ESI†). Thus for dl-cDICE only 25% to 35% of the initial cholesterol is effectively incorporated into the vesicle's membrane. Here we continue to only report the initially added amount of cholesterol in the lipid–oil mixtures as the final lipid composition of the vesicles cannot be directly determined.
The phase transition temperature (TM) of vesicles formed by electroformation depended on the lipid composition.8 Indeed, also for the vesicles formed by dl-cDICE the transition temperature TM varied depending on the initial lipid composition in the lipid–oil emulsions (see Fig. 3). It increased with an increase in DPPC content. The transition temperatures increased from 25 °C to nearly 38 °C with increasing DPPC content when the initial cholesterol concentration was 60%#; for an initial amount of 80% cholesterol TM increased from 25 °C to 45 °C with increasing DPPC content. The transition temperatures TM measured during cooling were consistently lower than that determined during the heating cycle (see Fig. 3 and Fig. S3, ESI†), which can be attributed to latent heat contribution of the phase transition.
The observed phase separation was fully reversible. The formation or disappearance of the liquid–liquid coexistence was spontaneous for most vesicles when TM was reached during the heating or cooling process. Full separation was accomplished within 30 s to several minutes. Domain fusion of the different phases could be still observed several minutes later. The fused domains regained immediately a circular shape (see Fig. 4a). Signatures of a spinodal decomposition was also observed but mostly at higher fractions of DPPC and cholesterol. Ribbon like domains appeared suddenly during heating or cooling of the vesicles (see Fig. 4b and Fig. S5, ESI†). The ribbons were dynamic and fused together within minutes. The structure decomposed continuously and became more fragile during heating when TM was approached (see Fig. 4b). Shortly before the full mixing of both phases was accomplished, small liquid-disordered domains of a defined size and a hexagonal shape were homogeneously distributed over the whole surface of the vesicles. Their size decreased constantly until they were completely dissolved and the membrane was no longer phase separated. For some vesicles bulging of the bright liquid-disordered domains was observed (see Fig. 4c). The bulging was only observed for bright domains, which is attributed to the higher partition of fluorescent lipids to the disordered domains and the minimization of the line tension between the two phases.10
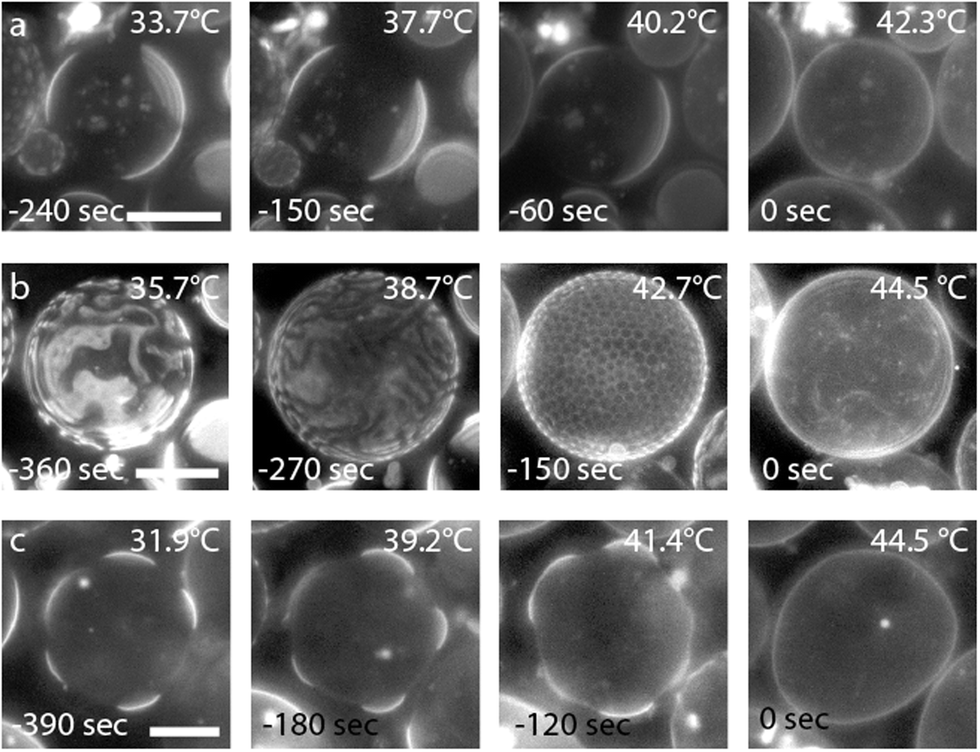 | ||
| Fig. 4 Different mixing pathways are shown for vesicles with a lipid–oil composition of DOPC/DPPC 1/3 and 80% cholesterol. (a) The most common mixing process is shown. Vesicles homogenize above a certain TM. (b) For some vesicles spinodal demixing occurred. (c) In some vesicle membranes bulging could be observed. All scale bars are 20 μm. | ||
Functionalization of liquid-disordered domains by NiNTA-lipids
Lastly, we tested whether one of the lipid phases can be functionalized by incorporating phospholipids with chelate headgroups (NiNTA lipids). To this end 3 μM His-GFP were encapsulated inside the phase separated GUVs. We used a lipid composition of DOPC/DPPC 1/1 and 60% cholesterol. 10% of DOPC was replaced by NiNTA lipids. His-GFP only bound to the bright lipid phases (see Fig. 5), which demonstrated that NiNTA lipids were incorporated into the membrane and segregated into the liquid disordered phase. Thus, a specific functionalization of one lipid phase with proteins was possible with dl-cDICE produced vesicles.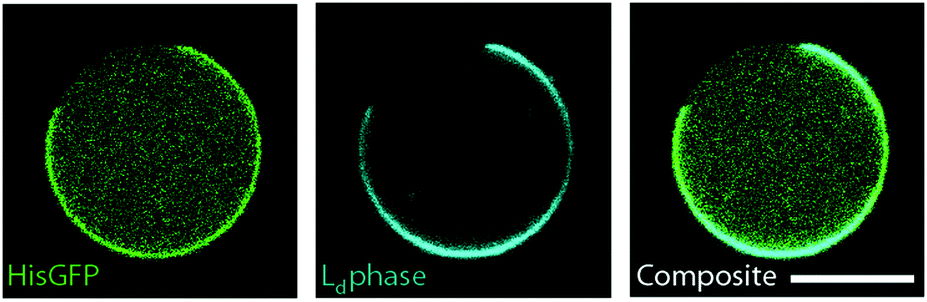 | ||
| Fig. 5 Protein encapsulation and specific binding of His-GFP to NiNTA-lipids inside the vesicles are shown. 3 μM His-GFP were encapsulated in phase separated vesicles to verify the NiNTA-functionalization of the Ld phase. On the left side an inhomogeneous binding of His-GFP (green) to the vesicle's membrane can be observed. In the middle, the membrane channel is shown. The membrane separates into a Lo (black) and a Ld (cyan) phase. The overlay of both channels indicates that His-GFP only binds to the Ld domain. The vesicles were composed of DOPC/DPPC 2/1 and 60% cholesterol. 10% of the DOPC lipids were replaced by NiNTA to enable the binding of His-GFP to the Ld phase. The scale bar is 10 μm. | ||
Discussion and outlook
In summary, we developed a modified protocol of cDICE, which allows production of phase separated vesicles at room temperature. The most critical step was to incorporate cholesterol into the vesicle's membrane. Only in the absence of any mineral oil enough cholesterol partitioned into the vesicle's bilayer and induced the formation of a Lo and a Ld phase. Cholesterol is more hydrophobic in comparison to phospholipids, as it possess only one hydroxyl head group30 and thus has a higher solubility in hydrophobic solvents. As a consequence, cholesterol partitions less likely into the water–oil interface of the passing protein droplets so that no phase separation is observable.25 To overcome this limitation, the oil properties were adapted to promote the absorption of cholesterol onto the water–oil interface between the droplet and the lipid–oil emulsion. To this end, the lipids were dissolved in a mixture composed of decane and silicone oil only. Silicone oil has a higher dielectric constant (∼2.7)31 than mineral oil (∼2.1–2.4)32 and due to this the permittivity of the oil mixture is increased and consequently the solubility of hydrophobic molecules, such as cholesterol, reduced.However, to ensure an efficient protein encapsulation, mineral oil is still required during the first step of lipid–oil emulsion formation.22,23 Thus, at first a cholesterol-free lipid–oil layer containing 14% mineral oil was passed by the protein containing water droplets to ensure fast lipid adsorption at the water–oil interface. This ensures that proteins do not adsorb at the water–oil interface and remain intact during monolayer formation. Next the centrifugal forces transport the droplets onto the mineral oil free layer where cholesterol is incorporated into the lipid bilayer. It was not possible to unambiguously distinguish whether cholesterol is incorporated already during the passage time within the lipid–oil phase or whether cholesterol was adsorbed at the water–oil interface between the lipid–oil phase and the aqueous solution to be incorporated during the zipping process of the second lipid monolayers.
The morphology and dynamic behaviour of phase separation of cDICE produced vesicles were comparable to those of phase separated vesicles produced either from biological membranes or by electroswelling.8,10,29,33 For both production methods phase separation was either driven by spontaneous or continuous (spinodal) nucleation and membrane bulging was observed for the Ld phase.
The incorporation efficiency of cholesterol into GUVs is roughly estimated to be about 25–30% for dl-cDICE compared to electroswelling where 100% of the initial cholesterol is incorporated.8 This incorporation range is consistent with a reported cholesterol incorporation efficiency of 28–50% for an emulsion phase transfer technique.26 As the solubility of lipids and cholesterol is decreased in silicone oil the approach presented here needs a much lower initial lipid concentration than in the mineral oil based emulsion phase transfer approach working best at concentrations of about 2 mg ml−1 (∼3 mM).8
His-GFP binding to the phase separated membrane confirmed that functional proteins can be encapsulated into phase separated GUVs that specifically bind to one of the lipid phases. The sorting of NiNTA lipids into the Ld phase is consistent with data obtained from electroformed vesicles.13
To conclude we found a robust method to incorporate cholesterol into GUVs produced by dl-cDICE to form phase separated vesicles at room temperature. This allows encapsulation of protein solutions to enable a completely new set of experiments to study the interdependence of protein-membrane dynamics.
Conflicts of interest
There are no conflicts to declare.Acknowledgements
Research was supported by the Deutsche Forschungsgemeinschaft via the SFB863 B1 and the Nanosystems Initiative Munich.Notes and references
- D. A. Brown and E. London, Annu. Rev. Cell Dev. Biol., 1998, 14, 111–136 CrossRef CAS PubMed.
- D. A. Brown and E. London, J. Membr. Biol., 1998, 164, 103–114 CrossRef CAS PubMed.
- G. van Meer, D. R. Voelker and G. W. Feigenson, Nat. Rev. Mol. Cell Biol., 2008, 9, 112–124 CrossRef CAS PubMed.
- A. S. Shaw, Nat. Immunol., 2006, 7, 1139–1142 CrossRef CAS PubMed.
- E. London, Biochim. Biophys. Acta, 2005, 1746, 203–220 CrossRef CAS PubMed.
- D. Marsh, Biochim. Biophys. Acta, 2009, 1788, 2114–2123 CrossRef CAS PubMed.
- J. R. Silvius, Biochim. Biophys. Acta, Biomembr., 2003, 1610, 174–183 CrossRef CAS.
- S. L. Veatch and S. L. Keller, Biophys. J., 2003, 85, 3074–3083 CrossRef CAS PubMed.
- S. L. Veatch and S. L. Keller, Phys. Rev. Lett., 2005, 94, 148101 CrossRef PubMed.
- T. Baumgart, S. T. Hess and W. W. Webb, Nature, 2003, 425, 821–824 CrossRef CAS PubMed.
- A. Honigmann, et al. , eLife, 2014, 3, e01671 CrossRef PubMed.
- M. D. Vahey and D. A. Fletcher, Curr. Opin. Cell Biol., 2014, 26, 60–68 CrossRef CAS PubMed.
- A. P. Liu and D. A. Fletcher, Biophys. J., 2006, 91, 4064–4070 CrossRef CAS PubMed.
- D. V. Köster, et al. , Proc. Natl. Acad. Sci. U. S. A., 2016, 113, E1645–E1654 CrossRef PubMed.
- S. K. Vogel, F. Greiss, A. Khmelinskaia and P. Schwille, eLife, 2017, 6, e00116 CrossRef PubMed.
- E. Abu Shah and K. Keren, eLife, 2014, 3, e01433 CrossRef PubMed.
- M. Abkarian, E. Loiseau and G. Massiera, Soft Matter, 2011, 7, 4610 RSC.
- L.-L. Pontani, et al. , Biophys. J., 2009, 96, 192–198 CrossRef CAS PubMed.
- S. Pautot, B. J. Frisken and D. A. Weitz, Langmuir, 2003, 19, 2870–2879 CrossRef CAS.
- L. R. Arriaga, et al. , Small, 2014, 10, 950–956 CrossRef CAS PubMed.
- F. C. Keber, et al. , Science, 2014, 345, 1135–1139 CrossRef CAS PubMed.
- E. Loiseau, et al. , Sci. Adv., 2016, 2, e1500465 CrossRef PubMed.
- K. Dürre, et al. , Nat. Commun., 2018, 9, 454 CrossRef PubMed.
- T. Litschel, B. Ramm, R. Maas, M. Heymann and P. Schwille, Angew. Chem., Int. Ed., 2018, 57, 16286–16290 CrossRef CAS PubMed.
- M. C. Blosser, B. G. Horst and S. L. Keller, Soft Matter, 2016, 12, 7364–7371 RSC.
- K. Karamdad, et al. , Chem. Sci., 2018, 9, 4851–4858 RSC.
- A. S. Klymchenko and R. Kreder, Chem. Biol., 2014, 21, 97–113 CrossRef CAS PubMed.
- S. L. Veatch and S. L. Keller, Phys. Rev. Lett., 2002, 89, 268101 CrossRef PubMed.
- L. A. Bagatolli and E. Gratton, Biophys. J., 2000, 79, 434–447 CrossRef CAS PubMed.
- B. Alberts, Molecular biology of the cell, Garland Science, New York, NY, 6th edn, 2015 Search PubMed.
- R. Hakim, R. Olivier and H. St-Onge, IEEE Trans. Electr. Insul., 1977, EI-12, 360–370 CAS.
- Y. Zhou, M. Hao, G. Chen, G. Wilson and P. Jarman, J. Appl. Phys., 2014, 115, 124105 CrossRef.
- T. Baumgart, et al. , Proc. Natl. Acad. Sci. U. S. A., 2007, 104, 3165–3170 CrossRef CAS PubMed.
Footnote |
| † Electronic supplementary information (ESI) available. See DOI: 10.1039/c8sm02491j |
| This journal is © The Royal Society of Chemistry 2019 |