
 Open Access Article
 This Open Access Article is licensed under a
 Creative Commons Attribution 3.0 Unported Licence
Measuring the impact of channel length on liquid flow through an ideal Plateau border and node system†
Christopher
Clarke
 *,
Aris
Lazidis
,
Fotis
Spyropoulos
and
Ian T.
Norton
*,
Aris
Lazidis
,
Fotis
Spyropoulos
and
Ian T.
Norton
Department of Chemical Engineering, University of Birmingham, Edgbaston, Birmingham, B15 2TT, UK. E-mail: crc633@bham.ac.uk
First published on 28th January 2019
Abstract
The phenomenon of foam drainage is a complex multi-scale process that unites molecular level interactions with bulk foam characteristics. Foam drainage is primarily governed by the flow of liquid in the channels and junctions that form between bubbles, which are known as Plateau borders (PBs) and nodes respectively. Existing theoretical work predicts the surface rheology of the PB and node air–liquid interface to influence liquid flow rates; however, direct experimental observations of this phenomenon remain scarce. This study recognises the clear need for a reproducible, accurate and standardised approach to directly studying liquid flow at the scale of a theoretically ‘ideal’ PB–node architecture. Measurements of PB geometric profiles and their apparent surface shear viscosities, μs, were made for an aqueous solution of Sodium Dodecyl Sulphate (SDS) at varying PB lengths, l1, and liquid flow rates in the range 10 μl min−1 ≤ Q ≤ 200 μl min−1. Geometric profiles displayed previously unobserved transitions between PB relaxation and expansion towards the node, with expansion dominating under conditions approaching conventional foam drainage. Average values of μs in the PB relaxation regions showed virtually inviscid behaviour, with magnitudes of 10−8 g s−1 < μs < 10−4 g s−1 for l1 in the range 27.5 mm ≳ l1 ≳ 8.0 mm. Decreasing magnitudes of μs and degrees of shear thinning were observed with increasing l1. This was attributed to a compressibility of the interface that was limited by an SDS concentration dependence on l1. Numerical evaluation predicted the appearance of Marangoni forces that scaled strongly with liquid shear rates, and could therefore have been responsible for the apparent shear thinning behaviour.
1. Introduction
1.1 Background
In general terms, a foam can be described as a large number of gas bubbles that are closely packed together.3 Owing to the competing action of capillary and gravitational forces, the liquid fraction gradually decreases over time as liquid travels through the network of channels between bubbles and back into the bulk solution beneath. This phenomenon of drainage is a complex physicochemical process that ultimately leads to the collapse of the foams due to eventual film rupture and subsequent bubble coalescence.33,42The complexity of foam systems have necessitated a bottom-up approach from those attempting to model macroscopic drainage. By simplifying the extensive liquid network into its component channels, known as Plateau borders (PBs), and junctions or ‘Nodes’, the microscale building-blocks of the foam system can be better characterised and subsequently reassembled. A large body of theoretical work exists to describe PB flow;20,24,28 however, corresponding experimental verification is limited due to the difficulties in observing and measuring such PB–node architectures.
Perhaps the most detailed direct observation of liquid flow through an individual PB within a bulk foam comes from Koehler, et al.,21 who used confocal microscopy to measure flow profiles in individual channels and a node. Since then, a greater focus has been given to forced drainage experiments through isolated PB systems where experimental and formulation parameters are easier to control and define.9,14,29–31
Much of the current theoretical work on isolated PB systems concerns the measurement and characterisation of interfacial properties, whose molecular origins have significant macroscopic effects on liquid flow and thus foam drainage.1,36 Numerous experimental techniques are available to quantify the surface rheology of aqueous solutions,11,13,35,46 however none of these account for the complex geometries and stresses of a PB–node system.16,34,38 Development of such in-situ techniques is therefore paramount for both the verification and improvement of current microscale drainage theory.7,22,23,29,43
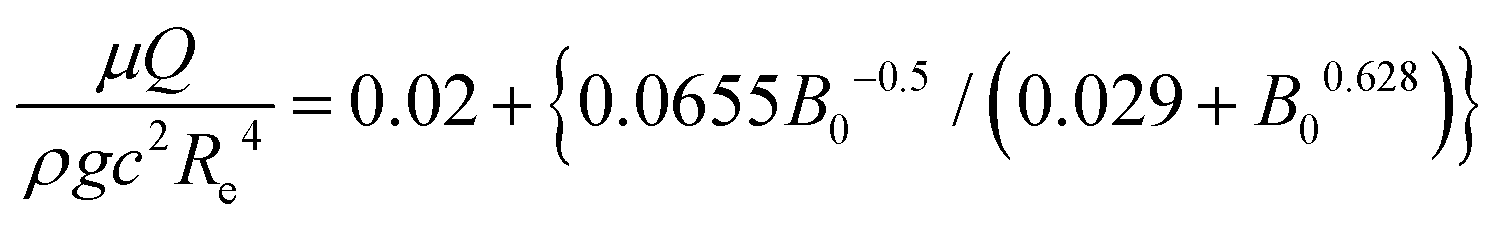
The surface parameter that has seen the most in situ experimental investigation in foam systems to date is an apparent surface shear viscosity, μs, that ultimately relates the shear force per unit length of interface to an applied shear rate, ![[small gamma, Greek, dot above]](https://www.rsc.org/images/entities/i_char_e0a2.gif) s.44 While the true surface shear viscosity is a material function of the surfactant solution, separation of this value from dilational viscous effects and Marangoni stresses has been shown to be highly troublesome even for analysis of simple planar interfaces. The combination of these effects into an apparent surface viscosity is however, sufficient for analysing the combined effects of the interface on liquid flow tangential to the PB vertical axis. Other publications have featured this parameter in its dimensionless form, the Boussinesq Number, B0, which is scaled by the bulk liquid viscosity, μ, and the PB's radius of curvature, R, according to eqn (1):
s.44 While the true surface shear viscosity is a material function of the surfactant solution, separation of this value from dilational viscous effects and Marangoni stresses has been shown to be highly troublesome even for analysis of simple planar interfaces. The combination of these effects into an apparent surface viscosity is however, sufficient for analysing the combined effects of the interface on liquid flow tangential to the PB vertical axis. Other publications have featured this parameter in its dimensionless form, the Boussinesq Number, B0, which is scaled by the bulk liquid viscosity, μ, and the PB's radius of curvature, R, according to eqn (1):
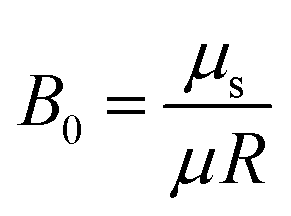 | (1) |
PB systems with a low μs impart minimal shear on liquid flow, producing a more uniform flow profile resembling ‘plug flow’. A high μs would produce profiles closer to that of the Poiseuille flow observed in rigid pipes.37 The contrast between low and high μs is thought to be responsible for the two macroscopic regimes of node-dominated and channel-dominated drainage respectively, which describe whether the bulk of flow dissipation is thought to occur at the nodes or within the PBs themselves.29,36
The ‘Plateau Border Apparatus’ of Pitois, et al.29 (Fig. 1A) has provided a wealth of information on this topic, with identification of ‘mobile’ and ‘rigid’ interfacial behaviour depending on the choice of surfactant. By measuring pressure variations within the PB, the authors were subsequently able to determine the apparent PB surface viscosities and resultant hydrodynamic resistances that inform models describing macroscopic foam permeability.28,30 However, despite average values of these resistances being in agreement with theory, the observed variation with liquid flow rate differed significantly.2,25,28,30
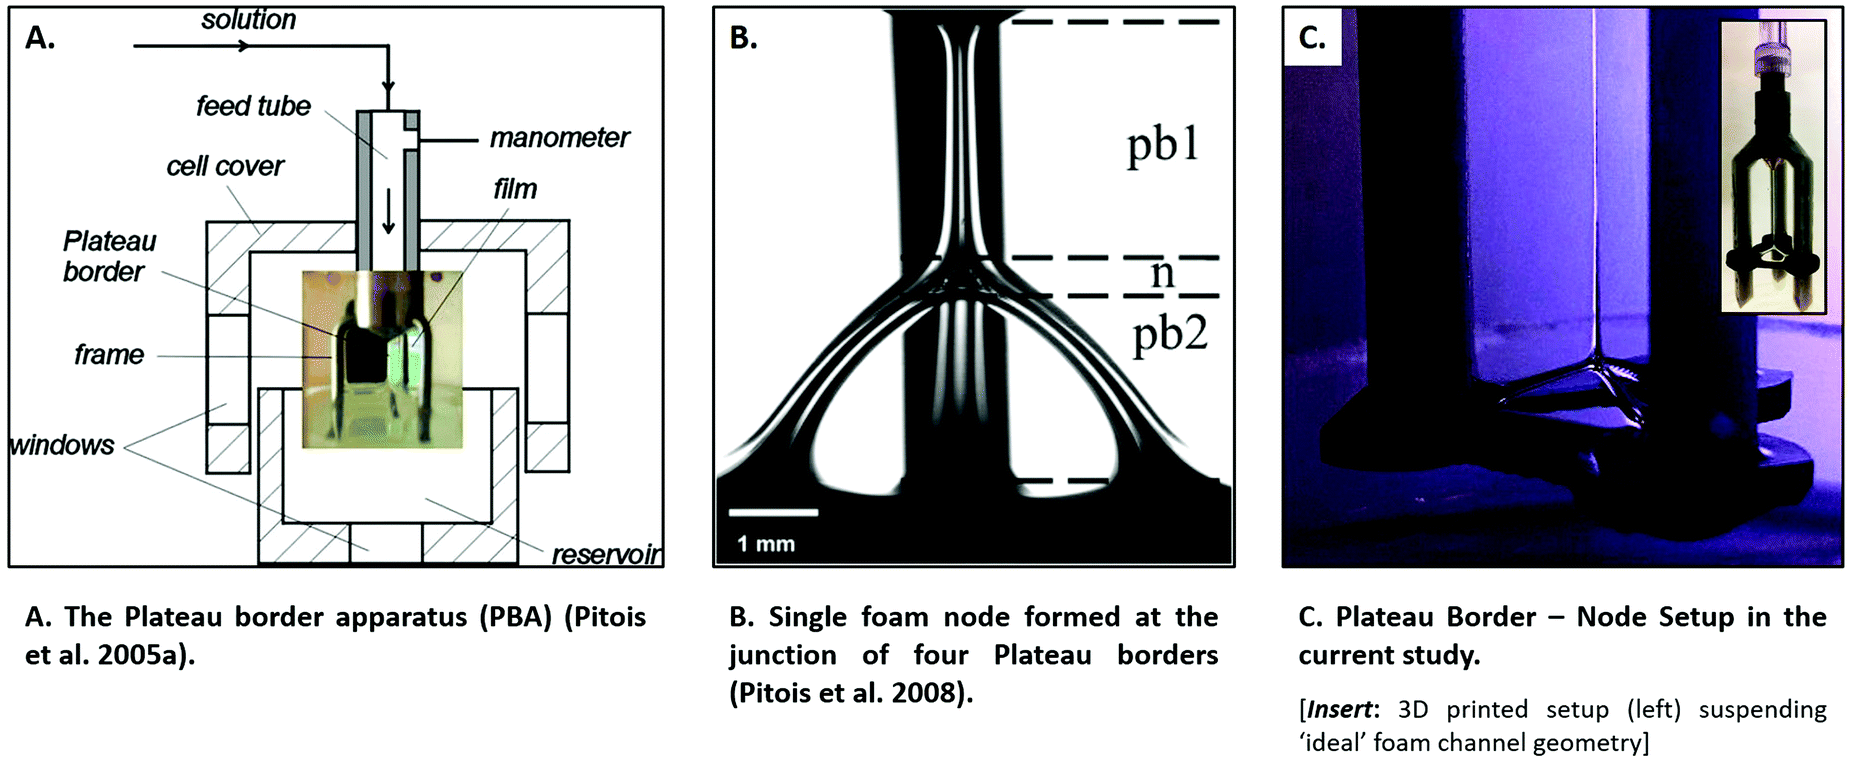 | ||
| Fig. 1 Comparison of experimental setups from (A) the Plateau border apparatus of Pitois, et al.,23,24 (B) the node adapted Plateau Border Apparatus of Pitois, et al.,31 to (C) the current PB–node setup. | ||
Despite its successes, there are still shortfalls of the Plateau Border Apparatus that need to be addressed. Firstly, for channels laden with high mobility surfactants, the node is known to dominate flow dissipation, and therefore must be included in investigations. Pitois, et al.31 made one such study in which the Plateau Border Apparatus was adapted to include a bubble at the base of the PB (Fig. 1B); however, the limited amount of data published was insufficient to account for large discrepancies in the current theory predicting hydrodynamic resistance of the node.4,19,27,37 In addition, the adaptation of the setup meant that the apparent surface viscosity needed to calculate hydrodynamic resistance was taken from measurements of the original PB-only system. This neglected both the potential impact of PB length variation and of variations in PB surface rheology that may have been introduced by the very presence of a node. These factors cannot be assumed and must therefore be experimentally verified.
Further challenges of such a system include the complex process of pressure measurement, where the significant timescales to achieve equilibrium29 and induced pressure fluctuations often compromise PB and node stability. Overall, this can make the measurement procedure extremely labour intensive and therefore severely limit the amount of data that can be collected.
In order to begin to address the challenges above, we propose the development of a purpose-built experimental setup to measure the apparent surface viscosity of ‘ideal’ PB–node systems for a wide range of flow rates and PB lengths. This reproducible and accurate technique will add to the limited body of experimental data that exists to describe such systems, while helping to standardise the approach to studying them. Overall, it is hoped that this will improve the comparability of findings between both previous and future studies, thus enabling further progress to be made in understanding these systems.
1.2 Theory
The bulk of existing theory relating PB surface viscosity to PB geometry, pertains to idealised ‘infinite’ PBs. Owing to the complexity of PB geometries, these simplified systems help to identify cross-sectional areas, S, such as that shown in Fig. 2, where S is a simple function of film thickness, w, and PB Radius, R, described by eqn (2):20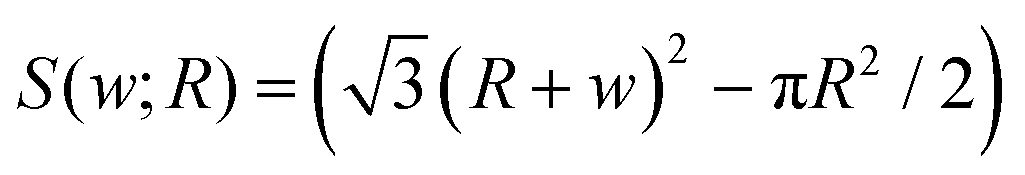 | (2) |
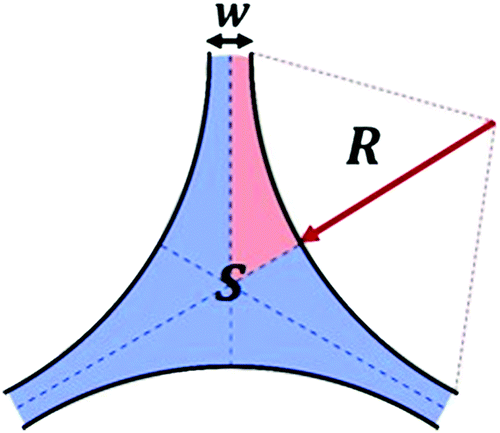 | ||
| Fig. 2 Cross-section of an infinite PB with film width, w, radius of curvature, R, and cross-sectional area, S. Dashed lines indicate PB symmetry lines and the shaded region highlights one of six symmetry units. | ||
A common approximation is applied to cases where films are thin (w ≪ R). In these cases, S can be approximated as a function of R only (eqn (3)) using the geometric factor c ≈ 0.161.20
| S ≈ cR2 | (3) |
Liquid flow through a PB is defined within the regimes of viscous and inertial flow, with viscous flow generally dominating at low flow velocities and high liquid viscosity, and inertial flow becoming more prominent with increasing flow velocity and decreasing liquid viscosity (i.e. higher Reynolds numbers). As the viscous regime is known to dominate for liquid foam systems, this has seen the majority of theoretical and experimental study.3,9,20,36 Therefore, in order to maximise the applicability of the current study, this work will focus only on the viscous component of the liquid flow, ![[scr D, script letter D]](https://www.rsc.org/images/entities/char_e523.gif) .
.
The current benchmark relationship between the viscous flow parameter, , and Boussinesq number, B0, is the numerical solution of Nguyen,28 which describes the data given by solving the Navier–Stokes equation for flow in an ideal ‘infinite’ PB (eqn (4)). This has been shown to agree well with subsequent model extensions and experimental analysis in macroscopic foam systems by Koehler, et al.20,21
| −1 = c[0.02 + {0.0655B0−0.5/(0.209 + B00.628)}] | (4) |
In order to relate eqn (4) to measureable variables, further considerations of PB geometry are required. Elias, et al.9 describe the ideal relaxation profile of a vertical PB with thin films according to:
| R = Re + (R0 − Re)e−z/L | (5) |
according to measurable parameters:9| Re = (μQ/cρg)1/4 | (6) |
 | (7) |
In order to maximise the comparability of the results presented here to existing work, values obtained for B0 are converted into surface shear viscosities, μs, using eqn (1) (with R = Re).
2. Experimental
2.1 The PB–node setup
The current setup formed an ideal PB and node by submerging and withdrawing a closed 3-legged frame geometry into surfactant solution (Fig. 1C). Flow rates, Q, were accurately controlled via a Cole-Parmer Dual Syringe Pump, which could directly inject surfactant solution into the upper PB through brass 3D print nozzles with outlet diameters of 0.4 mm. Larger diameter nozzles were found to cause pinning of the PBs to one side of the nozzle at low flow rates, thereby distorting the ideal profiles.The frame was designed using Tinkercad software (Autodesk inc., USA) and 3D printed using stereolithography on a FormLabs Form® 2 printer, as this approach offered fast and simple production of precision tailored geometries. The distance between the legs and central tripod axis was set at x = 6.40 mm and heights were varied to produce PB lengths of 27.5 mm, 15.0 mm and 8.0 mm with absolute errors of approximately 0.5 mm. These heights were both above and within the ranges used in existing setups.9,29–31 The error in PB length resulted from the uncertainty in the exact end of the PB and beginning of the node.
The frame was mounted and enclosed within an acrylic and glass fronted box to allow imaging, minimise liquid evaporation and to remove air current disturbances. Access from a rear panel allowed investigators to lift and withdraw containers of surfactant solution from the frame. The whole system was then mounted on an optical rail to aid in PB profile imaging.
PB profiles were obtained by illumination from the rear of the setup with a diffuse LED panel light and imaging via CCD camera from the front. A micrometre translation stage with translation in both the Z and Y directions, allowed precision movement of the CCD camera relative to the PB and node (Fig. 3a).
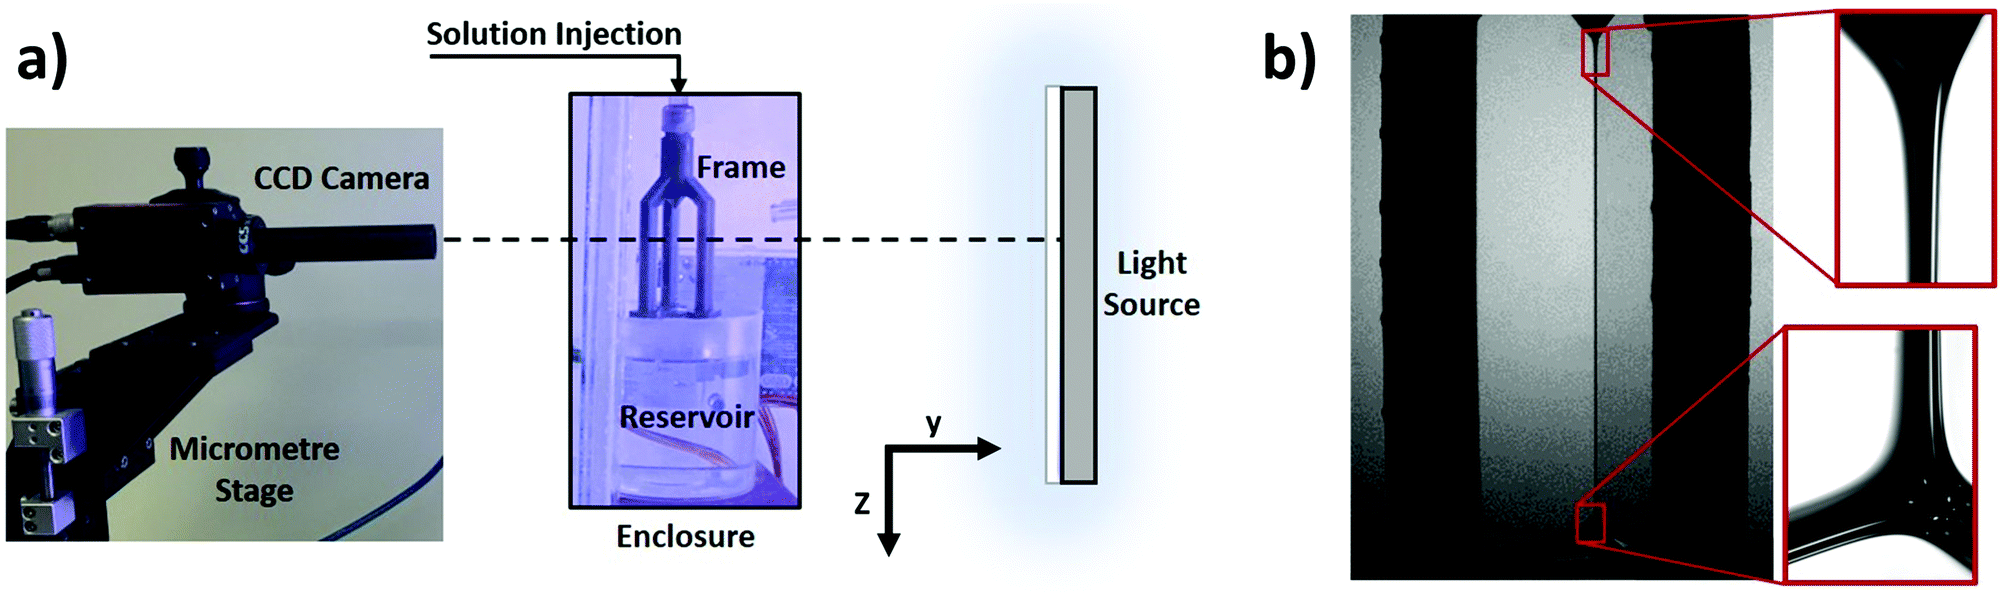 | ||
| Fig. 3 Imaging for analysis of PB–node profiles. (a) Optical setup – a CCD camera images the enclosed frame using a rear diffuse panel light to create shadow profile images. (b) Low and high magnification images of a PB node profile, where highest magnification (red highlighted images) represents 1.5 μm per image pixel. | ||
The resolution of images varied based on the choice of lens. Image resolution was calculated based on calibration images of a syringe needle with measured diameter 1.250 ± 0.001 mm. The maximum resolution of 1.5 μm per image pixel was used for curve fitting. Due to the high magnification at this resolution, it was necessary to combine multiple images along the Z-axis in order to visualise the full length of the PB profile (Fig. 3b). Images were obtained in triplicate at 1000 ± 5 μm increments along the Z-axis, then processed and combined in Matlab (MathWorks, USA).
PB profile widths, d, were measured on a pixel row-by-row basis, using a Canny edge detection algorithm to determine PB boundaries. This method has been shown to be robust in detecting the presence of strong edges, while removing false edges produced by image noise.39 The sensitivity of the edge detection could be varied by adjusting the upper and lower intensity thresholds used by the algorithm to determine edge strength. As such, it was possible to identify only PB profile edges, neglecting any fringe patterns in the adjoining films due to localised thinning.
Profile widths, d, were converted into PB radii, R, using the geometric correction factor9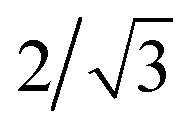 such that:
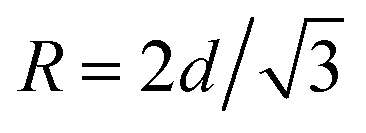 | (8) |
Values for the PB Radii were averaged for each of the 1 mm incremental images along the Z-axis and subsequently combined into a single matrix of Z values and corresponding R values in the range 0 ≤ Z ≤ l1.
As was observed by Elias, et al.,9 around Z = 0 mm the PB exhibited a significant distortion due to its attachment to the liquid injection nozzle. This distortion was thought to mark a transition from a circular PB cross-section to an ideal cross-section (Fig. 2) just below the point of injection. A vertical offset, Zoffset, was therefore defined at the inflexion point of the distortion (Supplementary S1, ESI†), below which the ideal PB cross-section could be assumed and curve fitting undertaken.
The PB equilibrium radius was determined by fitting eqn (5) to values of R and Z using a non-linear least square fit method. Re values were then combined with measurements of μ and ρ to calculate the left hand side of eqn (7). A least squares method was used to solve eqn (7) for B0, with these values subsequently converted to μs using eqn (1) with R = Re.
A solution of 0.50 wt% SDS was selected for analysis owing to its extensive use in previous work and its ability to easily produce stable films. This concentration was approximately double the Critical Micelle Concentration (CMC) of ∼0.235 wt%,6 ensuring that observations would be of a fully populated interface, where little variation in surface tension could be assumed.
SDS solution was loaded into the PB–node setup and PB profiles measured for flow rates in the range 10 μl min−1 ≤ Q ≥ 200 μl min−1, therefore extending beyond the range of conventional foam drainage experiments.29 This was in order to maximise the available data with which to investigate flow dependent trends.
2.2 Preparation of SDS solutions
SDS (>99.9%) from Fisher Scientific (Loughborough, UK) was weighed using a digital balance to an accuracy of three decimal places. Purified water (15.0 MΩ cm) was weighed into borosilicate glass beakers and magnetically stirred at room temperature while SDS was added. Beakers were covered with cling-film to reduce evaporative water loss or contamination. Stirring continued for a minimum of 30 minutes prior to use of the solution. Great care was taken to ensure that glassware and stirring bars were thoroughly cleaned and rinsed with purified water, then air dried prior to use. Nitrile gloves were worn throughout handling to avoid sample contamination.Bulk properties ρ and μ were measured in triplicate using a Krüss Processor® Tensiometer K100 (Krüss GmbH, Germany) with density hook attachment and silicon density standard, and a Malvern Kinexus® Pro rheometer (Malvern Panalytical, UK) with Double-Gap geometry respectively. The averaged results with accompanying measurement errors were then used in the calculation of μs.
3. Results and discussion
3.1 SDS solution properties
Values for specific bulk properties of the 0.50 wt% SDS solution, that are subsequently used for the calculation of μs (according to eqn (1) and (7)), are presented in Table 1.| Concentration [wt%] | Fraction of CMC | Density [mg ml−1] | Viscosity (10−4) [Pa s] |
|---|---|---|---|
| 0.50 | ∼2.13 | 998.7 ± 0.9 | 9.84 ± 0.05 |
3.2 PB relaxation and expansion
Images of PB profiles revealed a previously unreported phenomenon of PB relaxation followed by rapid localised expansion at discrete distances, Zswell, from the liquid injection nozzle at Z = 0 mm (Fig. 4a). Following the initial rapid expansion, a more gradual expansion of the PB followed, transitioning smoothly into the node.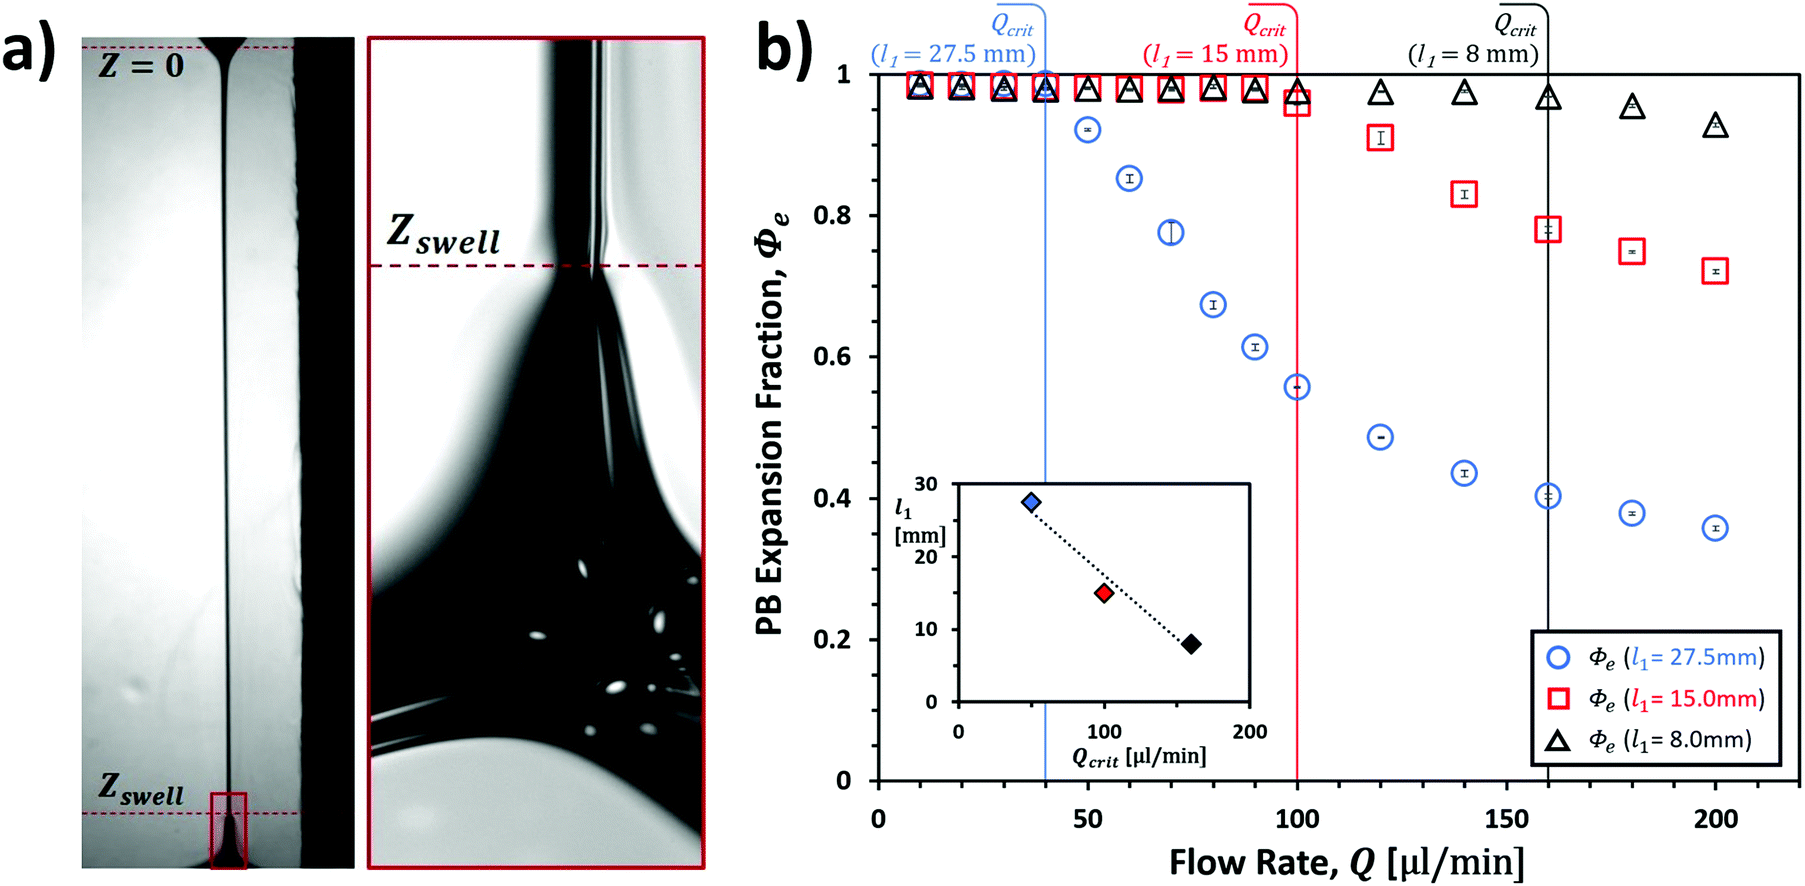 | ||
| Fig. 4 (a) Raw PB–node profile images for low (left) and high (right) magnifications at l1 ≈ 27.5 mm and Q = 200 μl min−1. Zswell indicates the distance of the swell below the injection nozzle. (b) Expansion fraction, Φe, vs. flow rate, Q, for PB lengths 27.5 mm, 15.0 mm and 8.0 mm. Critical flow rates, Qcrit, are seen at 50 μl min−1, 100 μl min−1 and 160 μl min−1 for PB lengths 27.5 mm, 15.0 mm and 8.0 mm respectively, with the relationship between l1 and Qcrit shown inset. Colours correspond to PB lengths as shown. | ||
Measurements of the PB profiles clearly highlighted the Q dependence of Zswell, which determined the extent to which the PB profile was dominated by relaxation or expansion. The Expansion Fraction, Φe, of the total PB length was described by Φe = 1 − Zswell/l1, and can be seen to vary accordingly with Q in Fig. 4b. At lower flow rates, expansion was seen to almost completely dominate the PB profile until a critical flow rate, Qcrit, after which Φe decreased. Qcrit increased with decreasing l1 as shown in the inset of Fig. 4b, resulting in the increasing dominance of expansion for shorter PBs. Values of Qcrit were 50 μl min−1, 100 μl min−1 and 160 μl min−1 for l1 ≈ 27.5 mm, 15.0 mm and 8.0 mm respectively.
These findings are highly significant. As flow rates and PB lengths approached those more typically observed in foam drainage experiments,29 PB relaxation all but disappeared in favour of an expansion limited by the spatial geometry of the adjoining node. This therefore represents an important consideration to be made when choosing suitable theory to describe PB profiles.
The differing nature of all existing experimental work in this area meant that this phenomenon was not observed.18,29–31 Firstly, the few isolated PB and PB–node experiments mainly focused on shorter PB lengths, l1 < 15 mm and the range of Q was smaller, 0 μl min−1 ≤ Q ≤ 100 μl min−1 in the case of Pitois et al. (2005a, 2005b, 2008).29–31 In the only case where PB length was longer (l1 ≈ 40 mm), flow rates were in significantly higher increments of 5 ml min−1 in the range 0 ml min−1 ≤ Q ≤ 40 ml min−1, with considerably poorer image resolution.9 This indicates that previous experiments would either have observed only expansion-dominated PB profiles (e.g. Pitois et al.29–31), or relaxation-dominated PB profiles (e.g. Elias, et al.9), where the swelling region may have been obscured by a combination of distortion at the node or the point of liquid injection and insufficient image resolution. The range of flow rates and PB lengths studied by the current experimental setup therefore make it unique in its ability to observe both expansion and relaxation states simultaneously.
As the current theory does not describe the swelling phenomenon observed here, both this and the PB expansion regions should not be considered in the subsequent analysis of PB profiles. Instead, curve fitting of eqn (5) to experimental data is limited to the relaxation region only (see Supplementary S2, ESI†).
3.3 Length and flow dependence of PB geometry
Due to the fundamental differences noted between the present experimental setup and others, only limited comparisons could be made to existing experimental data. Neither the influence of a node on the upper PB nor the specific impacts of height variations are well documented in the literature; however, the differences in data obtained here serve to highlight the potential significance of these factors.Experimental data were fitted to eqn (5) in order to extract values for the equilibrium radius, Re, which describes the theoretically ideal infinite PB, therefore validating the use of the theory described in Section 1.2. The fit quality was high in all cases, with a minimum r-squared value of 0.87 and the majority over 0.95. The values of Re were converted to equilibrium cross-sectional areas, Se, using eqn (3) with R = Re. These were compared to the minimum cross-sectional areas, Smin, measured by Pitois, et al.29 for a 3 g l−1 SDS solution with l1 < 15 mm (Fig. 5). It is important to note here that values of Smin may not have corresponded to equilibrium cross-sectional areas, which were the basis for the theory used in their subsequent calculations. For PBs of insufficient length, it is likely that values for Smin would have been higher than Se, with a potentially significant impact on the observed flow dependent trends and magnitudes of calculated values.
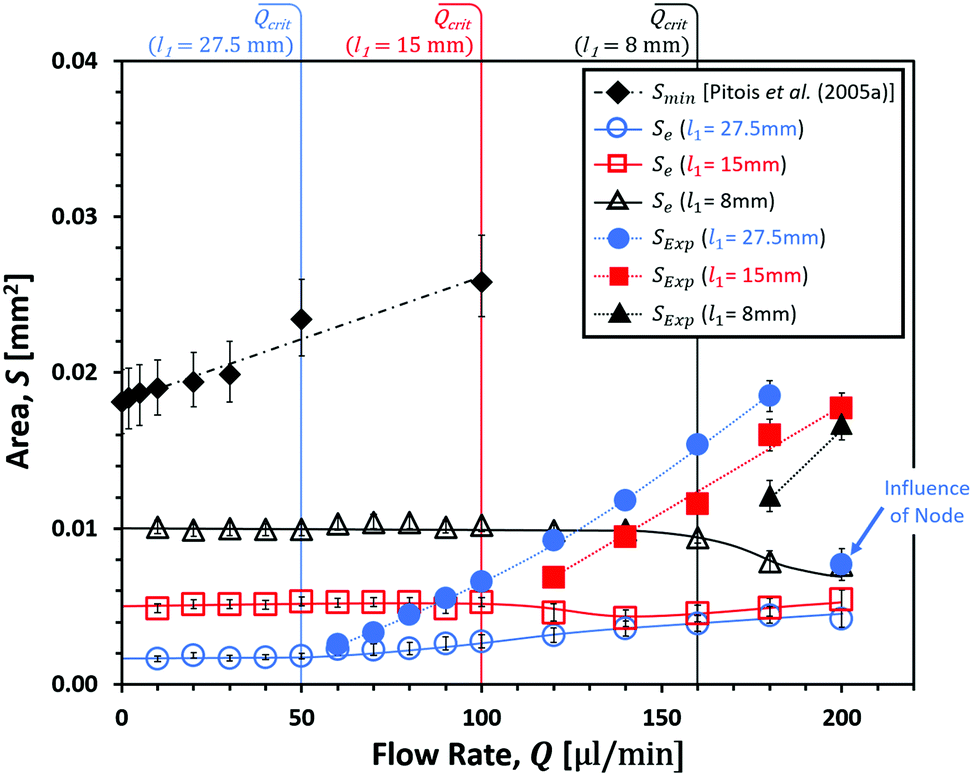 | ||
| Fig. 5 Flow rate, Q, vs. PB cross-sectional area, S. Data presented here is for 0.50 wt% SDS solution with PB lengths l1 ≈ 27.5 mm, l1 ≈ 15.0 mm and l1 ≈ 8.0 mm. Unfilled data-points represent minimum PB relaxation cross-sectional areas, Se, while filled points represent minimum PB expansion cross-sectional areas, SExp, for Q > Qcrit. Data is compared to the minimum PB cross-sectional area, Smin, measured by Pitois, et al.29 for 3 g l−1 SDS solution with l1 < 15 mm. Lines are included to guide the eye. SExp for l1 ≈ 27.5 mm at 200 μl min−1 shows a significant deviation from other data resulting from its close proximity to the node. | ||
As it was predicted above that Pitois, et al.29 may only have observed an expansion-dominated PB, measurements were also made of the minimum cross-sectional area in the PB expansion region, SExp, for Q > Qcrit (Fig. 5). This would serve to highlight any changes in PB geometry that were characteristic of expansion rather than relaxation, where SExp would better represent Pitois’ Smin than Se. The measurement of SExp was taken from the PB profiles at the approximate point where the swelling region had transitioned into a continuous expansion towards the node (see Supplementary S2, ESI†). The difficulty in precisely defining these points is reflected in the error margins.
From Fig. 5 it can be seen that PB length had a significant impact on the magnitude of Se before Qcrit was reached. In this region, Se was invariant to Q and increased in magnitude with decreasing l1. At flow rates above Qcrit, values of Se from the different PB lengths began to converge. This suggested that the impact of PB length on the equilibrium PB cross-section could become insignificant for flow rates at the top end of those measured here and above.
The projected trend of increasing Se with decreasing l1 could have conceivably produced magnitudes of Se comparable to the Smin values reported by Pitois, et al.,29 with a PB length of approximately 4 mm. This would fall within their range of l1 < 15 mm, however it does not account for the positive correlation between Smin and Q. It was only from the values of SExp for Q > Qcrit that a significant increase in area with flow rate was observed. This suggested that the increase in Smin with flow rate observed by Pitois, et al.29 was indeed a characteristic of the PB expansion region, albeit without the delay imposed by Qcrit. It is hypothesised that the PB-only nature of Pitois’ setup may have been responsible for the lack of a Qcrit in their data. By terminating in the bulk liquid instead of the strict geometry of a node, the expansion profile of the PB would have been far less restricted, potentially explaining the immediate increase in Smin from Q = 0 μl min−1.
Based on the observations made here, it seems unlikely that Smin accurately represented an equilibrium PB cross-section in Pitois et al.'s measurements. This would have introduced a degree of error in values subsequently calculated using idealised PB theory, the consequences of which are discussed further in Section 3.4. It is emphasised here that the proposed method for extracting the true values of Se from experimental PB profiles is vital for the accuracy of subsequent calculations using ideal infinite PB theory.
3.4 Length and flow dependence of apparent PB surface viscosity
The flow rate dependence of the apparent surface shear viscosity, μs, was calculated as described in Section 1.2, the results of which can be found in Fig. 6.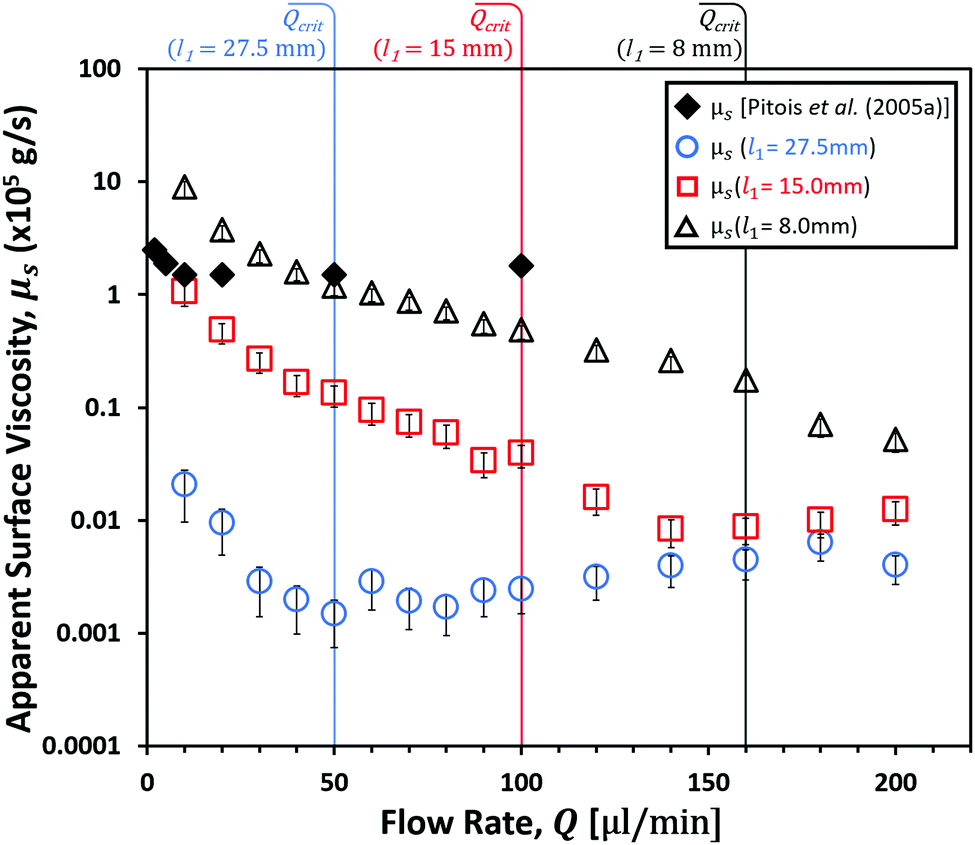 | ||
| Fig. 6 Apparent surface viscosity, μs (×105 g s−1), vs. flow rate, Q, for 0.50 wt% SDS solution with PB lengths l1 ≈ 27.5 mm, l1 ≈ 15.0 mm and l1 ≈ 8.0 mm. Critical flow rates, Qcrit, before PB expansion are indicated for each. Data is compared to that of Pitois et al.29 for 3 g l−1 tetradecyltrimethylammonium bromide (TTAB) solution with l1 < 15 mm, which was said to have exhibited similar results to SDS solutions. | ||
It was seen that that decreasing l1 produced values of μs that approached those of Pitois, et al.29 Their average μs in the range 10 μl min−1 ≤ Q ≤ 100 μl min−1 was 1.57 × 10⁻⁵ g s−1 for l1 < 15 mm, in comparison to a value of 2.16 × 10⁻⁵ g s−1 for l1 ≈ 8.0 mm determined here. It should be stressed that values published by Pitois, et al.29 were for a slightly lower concentration (3 g l−1) of TTAB solution rather than SDS, however the authors reported their SDS data to have been similar. Eqn (6) and (7) highlight the importance of accurate measurements of the equilibrium PB cross-section when using idealised ‘infinite’ PB theory to calculate μs. Here it can be seen that overestimations of Se would have resulted in overestimations of μs. For the case of Smin > Se therefore, as described in Section 3.3, it can be seen how this may have obscured flow dependent behaviour and increased the magnitude of μs measured by Pitois, et al.29
The range of values shown here for μs with varying l1, showed a good agreement with those measured in the high precision setup of Zell, et al.46 who reported μs ≲ 10−5 g s−1 for the true surface shear viscosity, in comparison to values of 10−8 < μs < 10−4 g s−1 for the apparent surface viscosity presented here. Zell's results are argued to be the most accurate measurements of SDS surface shear viscosity to date, where 10−5 g s−1 represented virtually inviscid behaviour at the limit of their technique's sensitivity. The ability of the new technique to extract values as low as 10−8 g s−1 therefore represents a significant step forward in measurement sensitivity. Furthermore, the ability to measure the flow dependent variations in μs at this scale could provide a wealth of information regarding the dynamics of the interface.
In order to interpret the origin of the flow and length dependent trends in μs, it was most useful to consider the shear imparted by the bulk liquid on the interface, which takes into account the variations in the PB cross-sectional area. The average liquid shear rate within the equilibrium PB, s, for a given geometry and flow rate was approximated from eqn (9) (Elias, et al.9), with the results shown in Fig. 7a.
| s ≈ Q/cRe3 | (9) |
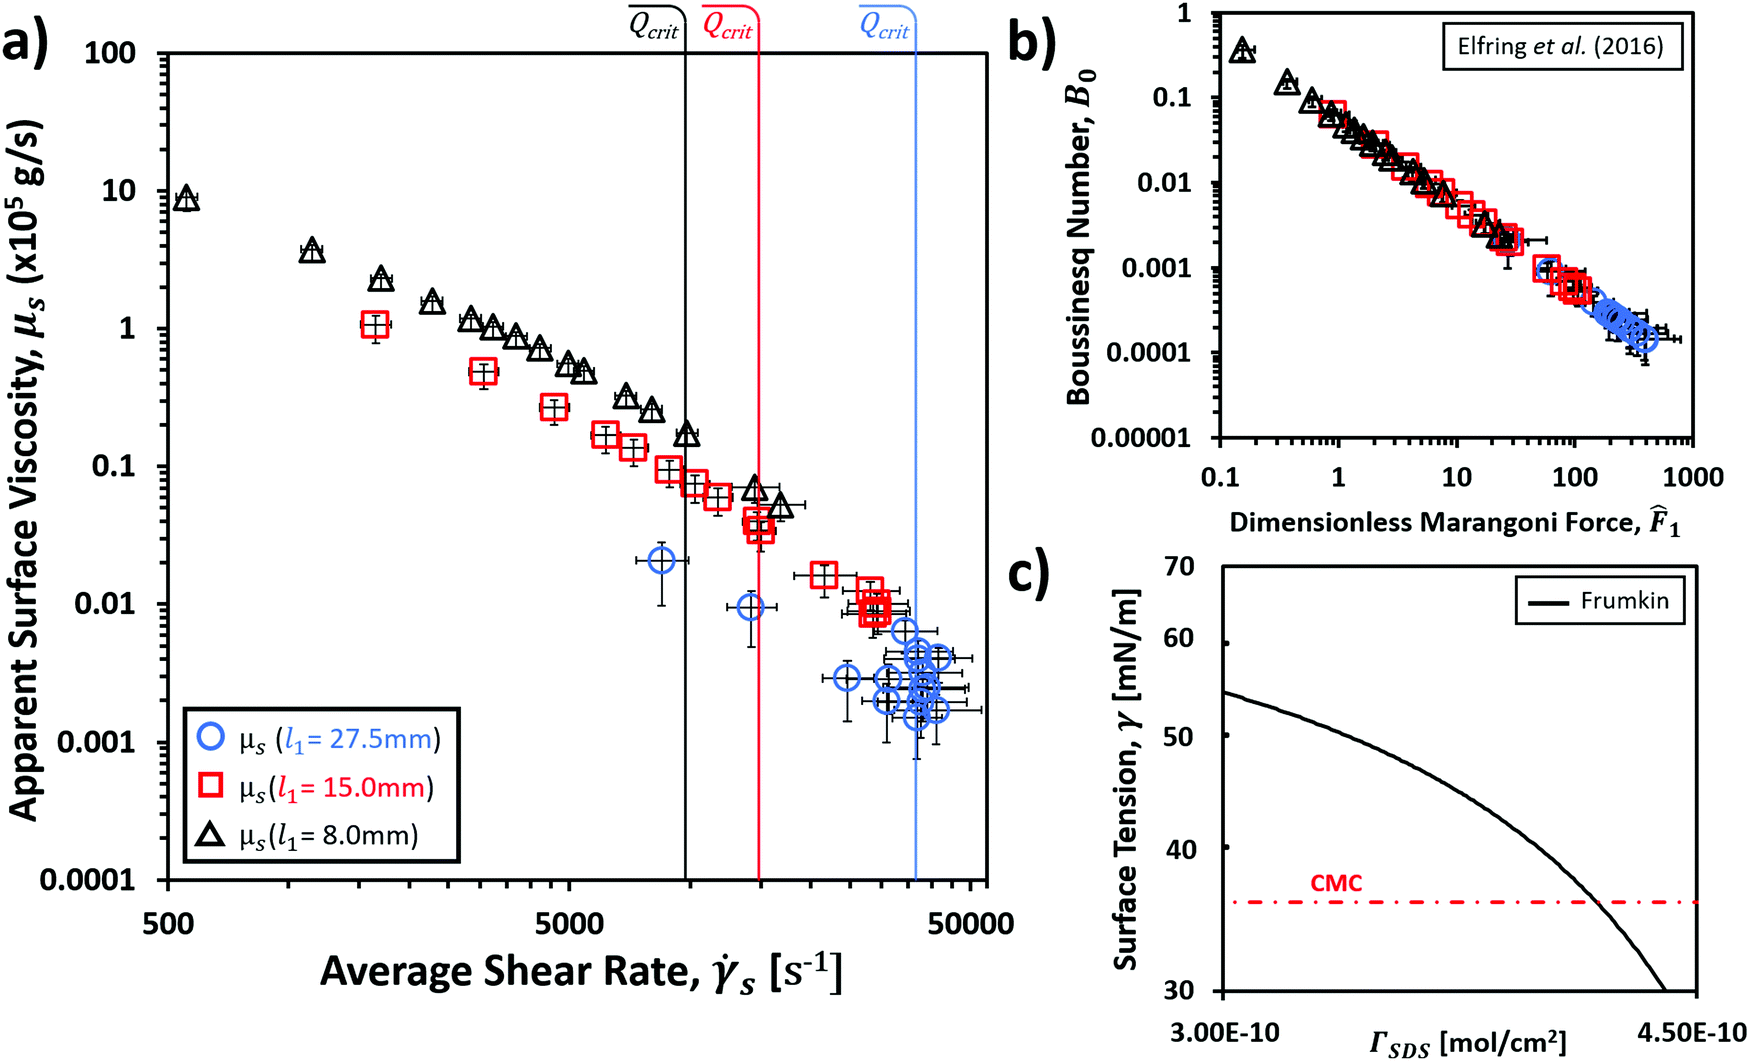 | ||
Fig. 7 (a) Apparent surface viscosity, μs (×105 g s−1), vs. average shear rate, s, for 0.50 wt% SDS solution with PB lengths l1 ≈ 27.5 mm, l1 ≈ 15.0 mm and l1 ≈ 8.0 mm. Critical flow rates, Qcrit, before PB expansion are indicated for each. (b) Calculated dimensionless Marangoni force, ![[F with combining circumflex]](https://www.rsc.org/images/entities/i_char_0046_0302.gif) 1, vs. Boussinesq number, B0, from different l1 PBs for virtually inviscid surface viscosity.8 (c) Frumkin isotherm for SDS at surface concentrations, ΓSDS, approaching the CMC using model parameters of Kinoshita et al.17 1, vs. Boussinesq number, B0, from different l1 PBs for virtually inviscid surface viscosity.8 (c) Frumkin isotherm for SDS at surface concentrations, ΓSDS, approaching the CMC using model parameters of Kinoshita et al.17 | ||
Due to the flow rate independence of Se prior to Qcrit, the resulting shear rates in these regions approximately scaled with Q. Here the apparent surface viscosity increased with decreasing s, initially being well described by power laws, but beginning to deviate towards finite values of μs for the lower values of s.
For flow rates larger than Qcrit a distinctive change in the behaviour of μs with s was observed, reflecting the transition to a Q dependent Se (Fig. 7a). From this point, the data for all PB lengths began to converge abruptly, following what appeared to be a single trend of decreasing μs with s. While additional PB length data is required to confirm this, it would imply that this flow region marked a response of the PB interface that was similar for all PB lengths. Indeed, the appearance of maximum shear rates for l1 ≈ 27.5 mm and l1 ≈ 15.0 mm, where μs appeared to increase, implied a resistance of the interface to further apparent shear thinning. These maximum shear rates also corresponded to the beginning of expansions of the PB cross-sections (see Fig. 5) implying a causal link between interfacial resistance and expansion.
The apparent shear thinning of the PB interfaces could have resulted from two primary effects: the compression of the interface, and/or the non-trivial combination of surface dilational viscosity and Marangoni forces with the surface shear viscosity,8,15 both of which are influenced by rates of adsorption/desorption. A full numerical analysis of these effects represents a complex task that is beyond the scope of this study; however, initial comparisons to theory and experimental observations by other authors were able to provide a physical basis for the observed trends.
In a recent study by Elfring et al.8 it was shown that very low surface viscosity interfaces, such as those described here, are expected to experience increasing Marangoni forces, 1, upon applied forces to the interface according to:
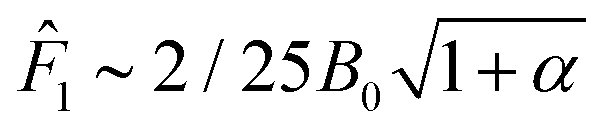 | (10) |
1 → constant, as B0 → 0. The results of eqn (10) when applied to the values of B0 obtained here are shown in Fig. 7b, where the scaling of 1 with B0 exhibited a very similar trend to that between μs and s. This showed that the contribution of Marangoni forces to the apparent surface viscosity would have been expected to scale with increasing shear rates (see Supplementary S3, ESI†) and could therefore have been responsible for the apparent shear thinning behaviour. Furthermore, the apparent tendency of μs towards a constant value with decreasing s noted previously, reflected the behaviour that would be expected from Fig. 7b were it not for the limitations of eqn (10) discussed above.
The theory of Elfring et al.8 relies upon a limited degree of compressibility of the interface in order to form the concentration gradients necessary to produce Marangoni forces. The increase in surfactant concentration, Γ, at the interface results in a decrease in the surface tension that is well described by theory and experiment alike.10,12,17,26,40,45Fig. 7c shows the theoretical relationship using the Frumkin isotherm adsorption model with model parameters for pure SDS solution as described by Kinoshita et al.17 At the CMC, the formation of micelles in the bulk liquid and the subsequent reduction in the energy barrier limiting surfactant desorption tends to reduce further compression of the interface.5 This would imply that around this point, any differences in the interfacial structures caused by PB length dependence should have become less pronounced. The convergence of the μs data in Fig. 7a at flow rates above Qcrit could therefore represent the tendency towards a common limit of interfacial compressibility for the different PB lengths.
Based on the analysis so far, a logical prediction for the strong PB length dependence of μs observed below Qcrit was that it was likely to have been the result of differences in bulk and/or surface concentrations of SDS. Such differences would have affected the rates of adsorption/desorption of SDS as well as the compressibility of the interface at given liquid shear rates. Indeed, the effect of varying bulk concentrations on the compressibility of SDS interfaces has been directly observed in experimental work by Vogel.41 In order to obtain an approximation of how SDS concentrations may have varied for different PB lengths, the average moles of surfactant contained in the liquid volume of each full-length PB profile was compared to the average PB interfacial area over the same length. This was done using eqn (11), producing a value for the maximum average available moles of SDS to populate an average unit area of interface, Γmax. Here the initial bulk concentration of SDS, Cwt%, was 0.5 for all solutions, and the molar mass of SDS was32M = 288.38 g mol−1. It is important to note that interfacial area and volume calculations were based on ideal PB cross-sections with negligible film thickness.9
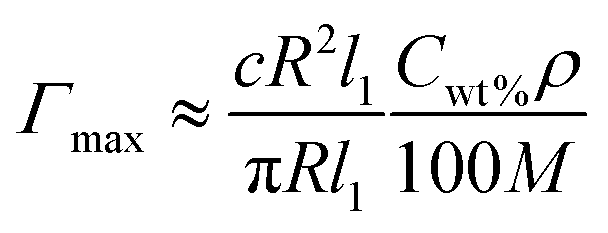 | (11) |
The results of eqn (11) are plotted in Fig. 8, and show a marked difference between values of Γmax for the different PB lengths. This difference was approximately independent of the liquid shear rates, giving average values of 3.56 mol cm−2, 2.90 mol cm−2 and 2.37 mol cm−2, for l1 ≈ 8.0 mm, 15.0 mm and 27.5 mm respectively.
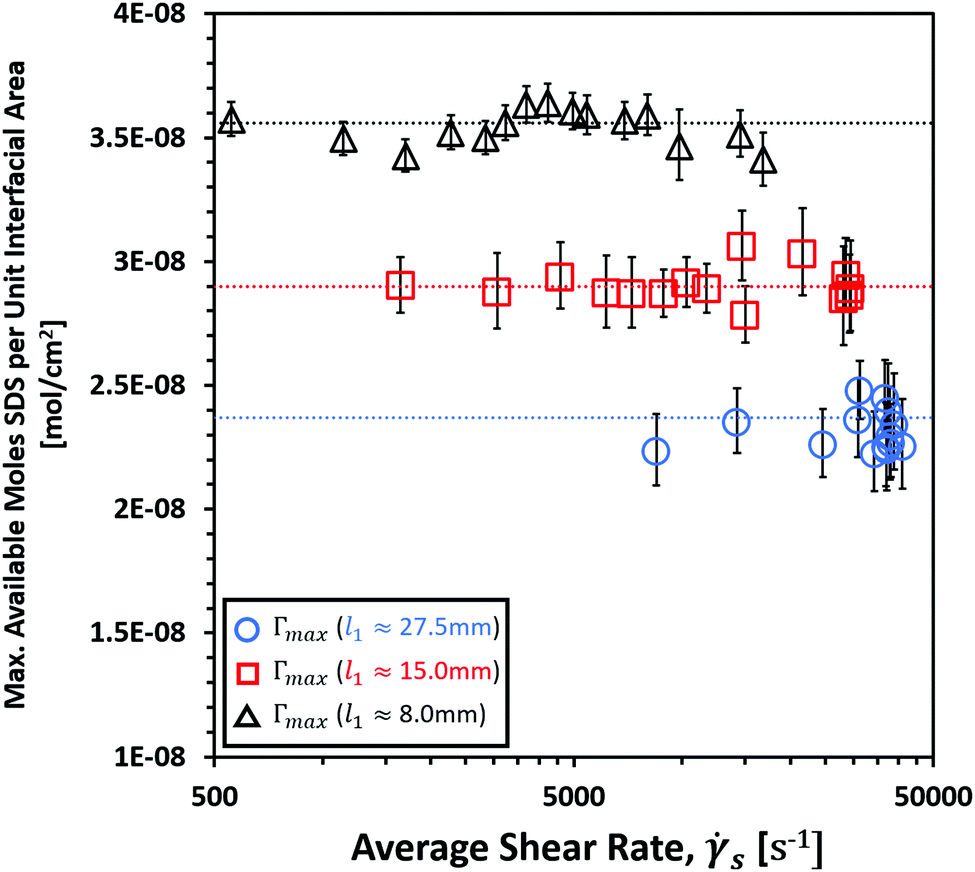 | ||
| Fig. 8 Average maximum available moles of SDS per unit interfacial area, Γmax, vs. average shear rate, s, for 0.50 wt% SDS solution with PB lengths l1 ≈ 27.5 mm, l1 ≈ 15.0 mm and l1 ≈ 8.0 mm. Dotted lines indicate average values of Γmax for corresponding coloured data points. | ||
The results of Fig. 8 clearly show that an average variation in either the bulk or surface concentration of SDS must have occurred as a result of varying PB length. The reduction in concentration with increasing l1 fits well with the observed trends in μs and the equilibrium cross sectional area. A lower initial surfactant population at the interface would have reduced the interfacial area due to the increase in the surface free energy, therefore increasing the liquid shear rates at given liquid flow rates according to eqn (9). Furthermore, one would expect a reduced μs for a lower surfactant population at the interface, due to the increased freedom of individual surfactant molecules. During compression experiments of SDS interfaces, Vogel41 observed that the reduction in bulk concentration of SDS solutions resulted in a reduction in the compressibility of the interface. This would have served to reduce the variation in μs at lower SDS concentrations, in agreement with the results shown here.
4. Conclusions
In this study, we have proposed a novel technique for studying liquid flow through an isolated Plateau border of foam terminating in a geometrically ‘ideal’ node. The high resolution of the imaging achieved, combined with the flexibility of the setup to vary both liquid flow rate and the length of the PB, have proven capable of exploring a broad range of experimental conditions not seen in previous work.An unexpected outcome of this study was the appearance of a clear distortion in the PB profiles that marked a sudden transition from the anticipated PB relaxation to a gradual PB expansion that transitioned smoothly into the node. These ‘swelling regions’ were found to be both PB length dependent and flow rate dependent after a critical flow rate, Qcrit. After Qcrit, swelling regions propagated discrete distances, Zswell, along the PB, thus determining whether the PB profiles were dominated by relaxation or expansion. While previous work was found to have observed profiles dominated by either expansion or relaxation, this marks the first instance where this dominance could be precisely controlled. As conditions approached those of conventional foam drainage (i.e. PB lengths less than 10 mm and flow rates less than 100 μl min−1), PB profiles were increasingly dominated by expansion into the node. The variable of PB length is therefore deemed an important consideration when selecting relevant theory to describe the evolution of PB profiles. We propose a further study of this region, wherein theory describing both PB relaxation and PB expansion is applied to the profiles studied here. A successful theoretical description of both regions should be able to describe the geometric evolution of their profiles, while predicting the appearance of the swelling regions at varying PB lengths and liquid flow rates.
Due to the nature of the theory presented here, further analysis of PB profiles was restricted to the relaxation regions.
Theory describing ideal PB relaxation agreed well with measured PB profiles, producing equilibrium cross-sectional areas, Se, that could then be accurately interpreted using idealised ‘infinite’ PB theory. The values of Se obtained here were shown to be consistently lower than the minimum cross-sectional areas for similar systems in previous studies,29,30 suggesting that direct measurement of minimum PB cross-sectional areas provides a poor indication of the equilibrium PB geometry. In turn, it was shown that inaccurate measurements of the equilibrium PB geometry would have resulted in artificially high measurements of the surface shear viscosity when applying idealised PB theory. It is also thought that the PB-only nature of previous setups may have influenced measurements, requiring a more direct investigation of the limits imposed on the PB by the node geometry.
The magnitudes of the apparent surface shear viscosity, μs, and its dimensionless equivalent, the apparent Boussinesq number, B0, agreed well with values from the most precise existing measurements of true surface shear viscosities of SDS interfaces in the literature,46 exceeding the measurement sensitivity by approximately three orders of magnitude. Values of μs were in the range 10−8 g s−1 < μs < 10−4 g s−1 corresponding to PB lengths within the range 27.5 mm ≳ l1 ≳ 8.0 mm respectively, while corresponding values of B0 were in the range 10−4 < B0 < 10−3.
The high sensitivity of the measurements here were able to detect a PB length dependence and flow rate dependence of μs has not been measured in previous studies. While a full numerical analysis of these effects was beyond the scope of the present study, a partial numerical and qualitative analysis is provided that indicates likely causes for the observed dependencies.
The apparent shear thinning behaviour of the PB interface is likely to have been the effect of a limited compressibility of SDS around the CMC, resulting in the significant increase in the contribution of Marangoni forces predicted numerically8 for virtually inviscid interfaces such as those described here. Marangoni forces were predicted to have increased with the liquid shear rate that was driving the compression of the interface.
PB length dependence of μs has been attributed to differences in the bulk and interfacial concentrations of SDS that occurred at the different PB lengths. The average available moles of SDS in the bulk liquid per unit area of interface for the different PB lengths was measured to have decreased with increasing l1. This decrease was roughly independent of liquid shear rate, scaling with factors of 1.00, 0.82 and 0.67 for l1 = 8.0 mm, 15.0 mm and 27.5 mm respectively. The variations in the bulk and surface concentrations of SDS are hypothesised to have resulted in changes to the compressibility of the PB interface, as observed in previous SDS compression experiments.41 These observations indicated a lesser degree of interfacial compressibility for lower surfactant concentrations, which at the same time would be expected to lower initial values of μs, as was seen from the length dependence of μs here. The convergence of the length dependent μs data with increasing shear rates above Qcrit, suggested a limit in the compressibility of the interfaces, wherein a common interfacial structure was approached for all PB lengths.
The complex interactions of the forces and geometries described here represent a significant challenge for the application of a full numerical analysis. Indeed, further work is still required in order to untangle these effects at the level of simple planar interfaces.8 In order to better understand the contributions of the factors discussed, we therefore propose further studies of soluble surfactant systems with known variations in chemical and physical characteristics. Variations in bulk concentrations and viscosities, for example, would be expected to elicit changes in the measured μs that could then be used to better understand the effects proposed above.
Overall, this study has shown that the present technique represents a potential milestone in measurement sensitivity for the interfacial responses of soluble surfactants to applied shear. Furthermore, it directly relates these values to flows through ideal foam channels, a key aspect of macroscopic foam drainage models where the significance of μs is often contested for soluble surfactants.46 It is hoped that the further exploration of soluble surfactants in this manner will yield insights into the dynamic nature of these foam interfaces, ultimately improving the current understanding of these complex systems.
Conflicts of interest
There are no conflicts to declare.Acknowledgements
This work was supported by the EPSRC Centre for Innovative Manufacturing in Food.Notes and references
- M. A. Bos and T. van Vliet, Adv. Colloid Interface Sci., 2001, 91, 437–471 CrossRef CAS PubMed.
- A. Anazadehsayed, N. Rezaee and J. Naser, J. Colloid Interface Sci., 2017, 504, 485–491 CrossRef CAS PubMed.
- I. Cantat; S. Cohen-Addad; F. Elias; F. Graner; R. Höhler; O. Pitois; F. Rouyer; A. Saint-Jalmes and S. Cox, Foams: Structure and Dynamics, Oxford University Press, New York, 2013 Search PubMed.
- V. Carrier, S. Destouesse and A. Colin, Phys. Rev. E: Stat., Nonlinear, Soft Matter Phys., 2002, 65, 061404 CrossRef CAS PubMed.
- A. Casandra, M.-C. Chung, B. A. Noskov and S.-Y. Lin, Colloids Surf., A, 2017, 518, 241–248 CrossRef CAS.
- A. Cifuentes, J. L. Bernal and J. C. Diez-Masa, Anal. Chem., 1997, 69, 4271–4274 CrossRef CAS.
- A. Cohen, N. Fraysse and C. Raufaste, Phys. Rev. E: Stat., Nonlinear, Soft Matter Phys., 2015, 91, 053008 CrossRef PubMed.
- G. J. Elfring, L. G. Leal and T. M. Squires, J. Fluid Mech., 2016, 792, 712–739 CrossRef CAS.
- F. Elias, E. Janiaud, J.-C. Bacri and B. Andreotti, Phys. Fluids, 2014, 26, 037101 CrossRef.
- V. B. Fainerman and R. Miller, Langmuir, 1996, 12, 6011–6014 CrossRef CAS.
- G. G. Fuller and J. Vermant, Annu. Rev. Chem. Biomol. Eng., 2012, 3, 519–543 CrossRef CAS PubMed.
- J.-C. Gimel and W. Brown, A Light Scattering Investigation of the Sodium Dodecyl Sulfate-Lysozyme System, 1996, vol. 104, pp. 8112–8117 Search PubMed.
- F. C. Goodrich, L. H. Allen and A. Poskanzer, J. Colloid Interface Sci., 1975, 52, 201–212 CrossRef.
- M. In Het Panhuis, S. Hutzler, D. Weaire and R. Phelan, Philos. Mag. B, 1998, 78, 1–12 CrossRef CAS.
- S. A. K. Jeelani and S. Hartland, J. Colloid Interface Sci., 1994, 164, 296–308 CrossRef CAS.
- S. I. Karakashev and E. D. Manev, Adv. Colloid Interface Sci., 2015, 222, 398–412 CrossRef CAS PubMed.
- K. Kinoshita, E. Parra and D. Needham, J. Colloid Interface Sci., 2017, 504, 765–779 CrossRef CAS PubMed.
- K. Koczó and G. Rácz, Colloids Surf., 1987, 22, 95–96 CrossRef.
- S. A. Koehler, S. Hilgenfeldt and H. A. Stone, Langmuir, 2000, 16, 6327–6341 CrossRef CAS.
- S. A. Koehler, S. Hilgenfeldt and H. A. Stone, J. Colloid Interface Sci., 2004a, 276, 420–438 Search PubMed.
- S. A. Koehler, S. Hilgenfeldt, E. R. Weeks and H. A. Stone, J. Colloid Interface Sci., 2004b, 276, 439–449 Search PubMed.
- M. Kostoglou, E. Georgiou and T. D. Karapantsios, Colloids Surf., A, 2011, 382, 64–73 CrossRef CAS.
- A. Lazidis; L. Parizotto; F. Spyropoulos and I. Norton, Microstructural Design of Aerated Food Systems by Soft-Solid Materials, 2017, vol. 73, pp. 110–119 Search PubMed.
- R. A. Leonard and R. Lemlich, AIChE J., 1965, 11, 18–25 CrossRef CAS.
- R. A. Leonard and R. Lemlich, AIChE J., 1965, 11, 25–29 CrossRef.
- F. M. Menger and S. A. A. Rizvi, Langmuir, 2011, 27, 13975–13977 CrossRef CAS PubMed.
- S. J. Neethling, H. T. Lee and J. J. Cilliers, J. Phys.: Condens. Matter, 2002, 14, 331 CrossRef CAS.
- A. V. Nguyen, J. Colloid Interface Sci., 2002, 249, 194–199 CrossRef CAS PubMed.
- O. Pitois, C. Fritz and M. Vignes-Adler, J. Colloid Interface Sci., 2005a, 282, 458–465 Search PubMed.
- O. Pitois, C. Fritz and M. Vignes-Adler, Colloids Surf., A, 2005b, 261, 109–114 Search PubMed.
- O. Pitois, N. Louvet, E. Lorenceau and F. Rouyer, J. Colloid Interface Sci., 2008, 322, 675–677 CrossRef CAS PubMed.
- PubChem, https://pubchem.ncbi.nlm.nih.gov/compound/3423265, accessed 20 Dec, 2018.
- R. J. Pugh, Bubble and Foam Chemistry, Cambridge University Press, Cambridge, United Kingdom, 2016 Search PubMed.
- F. Rouyer, E. Lorenceau and O. Pitois, Colloids Surf., A, 2008, 324, 234–236 CrossRef CAS.
- M. Sacchetti; H. Yu and G. Zografi, A Canal Surface Viscometer for the in-Plane Steady Shear Viscosity of Monolayers at the Air/Water Interface, 1993, vol. 64, pp. 1941–1946 Search PubMed.
- A. Saint-Jalmes, Soft Matter, 2006, 2, 836–849 RSC.
- A. Saint-Jalmes, Y. Zhang and D. Langevin, Eur. Phys. J. E: Soft Matter Biol. Phys., 2004, 15, 53–60 CrossRef CAS PubMed.
- B. Scheid, J. Delacotte, B. Dollet, E. Rio, F. Restagno, E. A. v. Nierop, I. Cantat, D. Langevin and H. A. Stone, EPL, 2010, 90, 24002 CrossRef.
- M. Sharifi; M. Fathy and M. T. Mahmoudi, A Classified and Comparative Study of Edge Detection Algorithms, Proceedings. International Conference on Information Technology: Coding and Computing, 8–10 April 2002, 2002, pp. 117–120.
- H. Vatanparast, F. Shahabi, A. Bahramian, A. Javadi and R. Miller, Sci. Rep., 2018, 8, 7251 CrossRef PubMed.
- T. J. Vogel, Dynamic Behavior of Self-Assembled Langmuir Films Composed of Soluble Surfactants and Insoluble Amphiphiles, The Ohio State University, 2011 Search PubMed.
- J. Wang, A. V. Nguyen and S. Farrokhpay, Adv. Colloid Interface Sci., 2016, 228, 55–70 CrossRef CAS PubMed.
- Y. Wang, J. Ge, G. Zhang, P. Jiang, K. Song and W. Zhang, Tenside, Surfactants, Deterg., 2017, 54, 327–333 CrossRef CAS.
- D. Weaire and S. Hutzler, The Physics of Foams, Oxford University Press, New York, 1999 Search PubMed.
- P. Yazhgur, Flows in Foams: The Role of Particles, Interfaces and Slowing Down in Microgravity, Université Paris-Saclay, 2015 Search PubMed.
- Z. A. Zell, A. Nowbahar, V. Mansard, L. G. Leal, S. S. Deshmukh, J. M. Mecca, C. J. Tucker and T. M. Squires, Proc. Natl. Acad. Sci. U. S. A., 2014, 111, 3677–3682 CrossRef CAS PubMed.
Footnote |
| † Electronic supplementary information (ESI) available. See DOI: 10.1039/c8sm02265h |
| This journal is © The Royal Society of Chemistry 2019 |