
 Open Access Article
 This Open Access Article is licensed under a
 Creative Commons Attribution 3.0 Unported Licence
Anomalous transport of magnetic colloids in a liquid crystal–magnetic colloid mixture
Gaurav P.
Shrivastav
 * and
Sabine H. L.
Klapp
*
* and
Sabine H. L.
Klapp
*
Institut für Theoretische Physik, Technische Universität Berlin, Hardenberg Str. 36, 10623 Berlin, Germany. E-mail: shrivastav@tu-berlin.de; klapp@physik.tu-berlin.de
First published on 3rd January 2019
Abstract
We report an extensive molecular dynamics study on the translational dynamics of a hybrid system composed of dipolar soft spheres (DSS), representing ferromagnetic particles, suspended in a liquid crystal (LC) matrix. We observe that the LC matrix strongly modifies the dynamics of the DSS. In the isotropic regime, the DSS show a crossover from subdiffusive to normal diffusive behavior at long times, with an increase of the subdiffusive regime as the dipolar coupling strength is increased. In the nematic regime, the LC matrix, due to the collective reorientation of LC particles, imposes a cylindrical confinement on the DSS chains. This leads to a diffusive dynamics of DSS along the nematic director and a subdiffusive dynamics (with an exponent of ∼0.5) in the perpendicular direction. The confinement provided by the LC matrix is also reflected by the oscillatory behavior of the components of the velocity autocorrelation function of the DSS in the nematic phase.
1 Introduction
Inclusions of nano-to-micro sized particles inside a liquid crystal (LC) matrix have offered a new paradigm for hybrid material design and applications of LCs beyond display materials.1–3 This is one of the most propitious advances in materials science as the self-organizing tendency of LCs provides numerous possibilities of synthesizing fascinating bulk structured materials.4 In this context, suspensions of magnetic particles inside a LC matrix have attracted particular attention in the past few decades. These systems, first introduced theoretically in a celebrated work by Brochard and de Gennes,5 show a rich variety of self-assembled structures and have a wide range of biomedical and technical applications.6–8 The first experimental realization of such suspensions was achieved by doping magnetic particles in a thermotropic LC host.9 A further early experimental study was performed by Lébert and Martinet who doped lyotropic LCs with a water-based ferrofluid and observed that the magnetic field required to align LCs is reduced by a factor of thousand.10Moreover, these materials provide striking magneto-optical properties due to the combination of the anisotropic optical properties of LCs and the large magnetic susceptibility of the magnetic particles. Many experiments have investigated the effects of an external magnetic field on the host LC matrix.11–20 In particular, in a recent combined experimental and numerical study, it has been shown that the presence of magnetic particles, combined with an external magnetic field, can induce a nematic phase in an isotropic LC phase.21
From a theoretical point of view, a standard model for spherical ferromagnetic particles is the so-called dipolar soft spheres (DSS), that is, spheres interacting via a steep isotropic repulsion and anisotropic forces stemming from embedded point dipoles. The equilibrium structure of DSS in a LC matrix composed of Gay–Berne ellipsoids is well studied theoretically22–24 and via computer simulations for different sizes of the two species.25–27 In particular, Monte Carlo (MC) simulations reveal that in the absence of an external magnetic field the DSS form chains along the director of the nematic LC matrix. Furthermore, as the diameter of DSS is increased, the uniaxial spontaneous ordering changes to a biaxial lamellar phase.26
In order to control and improve the flow properties of such hybrid systems,28 it is important to develop a better understanding of the equilibrium dynamics of different species, in particular, the translational mobility. In recent molecular dynamics (MD) simulations,27 it has been observed that the DSS show normal diffusion if their sizes are much smaller than the suspending LC fluid. Nonetheless, the dynamics may become more complex when the two components have comparable sizes. In fact, the smaller size of the DSS leads to stark differences in the equilibrium self-assembly and also in the translational dynamics of the DSS.27 The equilibrium self-assembly of a mixture with much smaller DSS particles is characterized by a significant fraction of rings of DSS appearing together with the chains. Here, we consider a situation where the size of the DSS is comparable to the width of the LCs. Then, the available free volume around the DSS is smaller and, therefore, the ring formation is less feasible.
Our main focus is on the dynamics of the DSS, and we note that, in the absence of a LC matrix, dilute dipolar fluids display a subdiffusive behavior at intermediate times due to the formation of chains with head-to-tail ordering of the dipole moments.29 This subdiffusive regime increases as the strength of dipolar coupling is increased. Also, at a dipolar coupling strength at which dipolar particles start to form chains, the translational diffusion coefficient shows a sudden decrease.30 Thus, the chain-forming tendency of dipolar particles plays an important role in their dynamics. We would therefore expect that the situation gets even more complex in a hybrid system of DSS in a LC host. Here, the LC matrix provides a dense anisotropic environment which, as we will show, renders the dynamics of magnetic particles anomalous. This finding is indeed consistent with the behavior of a wide range of complex systems where a dense environment or a complex geometry leads to a subdiffusive motion of particles.31–34
In this work, we present a MD simulation study on the translational dynamics of a mixture of LC and DSS, where the sizes of both the species are comparable. We observe that the dynamics of DSS is indeed highly influenced by the LC matrix. At low densities at which the LC matrix is in an isotropic phase, the mean square displacement (MSD) of DSS shows a subdiffusive regime at intermediate times. The length of the subdiffusive regime grows as the strength of dipolar coupling is increased. Eventually it spans the entire simulation time window at high values of the dipolar coupling. The effect of the LC matrix on the dynamics of the DSS is particularly visible at high densities, where the LC matrix undergoes an I–N transition and enforces, in turn, an aligned state of the DSS.26 The DSS then show diffusive behavior parallel to the nematic director but remain subdiffusive in the perpendicular direction.
The rest of the paper is organized as follows. In Section 2 we give the details of the model and simulation method. We present our results in Section 3. The equilibrium phase diagram of the mixture is discussed in Section 3.1. Using MSD (Section 3.2) and velocity autocorrelation functions (VACF) (Section 3.3), we demonstrate that the DSS show anomalous translational diffusion at low temperatures while the LC matrix shows a normal diffusive behavior at all densities and temperatures. Finally, in Section 4, we conclude the paper with a summary.
2 Simulation details
We consider a binary mixture of LC and DSS with a composition ratio of 80![[thin space (1/6-em)]](https://www.rsc.org/images/entities/char_2009.gif) :20 and perform MD simulations in the NVT ensemble using the LAMMPS package.35,36 The LCs are modeled by ellipsoids which are characterized via a (diagonal) shape matrix S = diag(σa,σb,σc) and a (diagonal) energy matrix E = diag(εa,εb,εc), where σa,b,c are the lengths and εa,b,c are the relative well depths of interaction along the three semiaxes of an ellipsoid. We note that the model investigated here slightly differs from that considered in Peroukidis et al.27 as the mixing parameters are different.
:20 and perform MD simulations in the NVT ensemble using the LAMMPS package.35,36 The LCs are modeled by ellipsoids which are characterized via a (diagonal) shape matrix S = diag(σa,σb,σc) and a (diagonal) energy matrix E = diag(εa,εb,εc), where σa,b,c are the lengths and εa,b,c are the relative well depths of interaction along the three semiaxes of an ellipsoid. We note that the model investigated here slightly differs from that considered in Peroukidis et al.27 as the mixing parameters are different.
The LCs interact via a generalized Gay–Berne (GB) potential which is defined as36–38 (following the notations of Brown et al.36)
U(Ai,Aj,rij) = Ur(Ai,Aj,rij)ηij(Ai,Aj)χij(Ai,Aj,![[r with combining circumflex]](https://www.rsc.org/images/entities/b_i_char_0072_0302.gif) ij). ij). | (1) |
ij is the unit vector along rij.
The function Ur(Ai,Aj,rij), which controls the distance dependence of the GB potential, is defined as
 | (2) |
 is the distance of the closest approach between particles i, j with Gij = ATiSi2Ai + ATiSj2Aj. The second and third terms in eqn (1) are given by
 | (3) |
| χij(Ai,Aj,ij) = [2TijBij−1(Ai,Aj)ij]μ′. | (4) |
We consider uniaxial LCs with an aspect ratio of 3, i.e., σea = σeb = σ0 and σec = 3σ0. The relative energy well depth for side-to-side interaction is εea = εeb = ε0 and for end-to-end interaction is εec = 0.2ε0. For ellipsoids, these values of the energy parameters yield the energy of the side-to-side configuration five times stronger than that of the end-to-end configuration. The cut-off radius is set to rGBc = 4.0σ0 and the empirical parameters of GB potential are set to μ′ = 1.0, ν = 2.0 and γ = 1.0. The parameter μ′ is the same as μ used for GB in Brown et al.36 Here, we have changed the notation, as in our case, μ is reserved for the dipole moment of the DSS.
The interaction among the LC and DSS is also modeled by a GB potential with shape and energy parameters for DSS taken as σsa = σbs = σcs = σ0 and εsa = εbs = εcs = ε0. The cutoff radius is taken the same as rGBc.
The DSS interact via a combination of a soft sphere potential and dipolar interactions.39,40 The full potential for two DSS particles i and j with dipole moments μi and μj is defined as40
 | (5) |
 | (6) |
| USS(rij) = 4ε0(σ0/rij)12. | (7) |
The parameters that characterize the structure and phase behavior of the mixture are the reduced temperature T* = kBT/ε0, the reduced number density ρ* = Nσ03/V (where N and V are the total number of particles and the total volume respectively), and the reduced dipole moment μ* = μ2/ε0σ3. Newton's equations of motion for force and torque are integrated in the NVT ensemble using the velocity Verlet algorithm. A reduced MD time step  is chosen and simulations are performed at fixed μ* = 3.0, various ρ* and T*. The value of T* ranges from 2.0 to 0.6, i.e., the range of dipolar coupling parameter λ = μ2/kBTσ03 is 4.5 to 15.0. We have set μ* = 3.0, therefore, a change in T* is equivalent to a change in λ. We will use λ for DSS and the corresponding T* for LCs while discussing our results.
Our simulated system consists of 3200 LC (Ne) and 800 DSS particles (Ns). We start with a mixture equilibrated at low density and high temperature and then quench it to desired T*. Subsequently, we slowly compress the mixture keeping T* constant by applying the Langevin thermostat.43 At each compression step, the mixture is equilibrated for 4 × 10⁶ time steps. For MSD calculations at different ρ*, we performed additional production runs in the NVT ensemble for 107 time steps after equilibration. We took 100 time origins for averaging.
The self-diffusion constant D is obtained from the long-time behavior of MSD. For VACF calculations, short production runs up to 25000 time steps are performed using temperature rescaling at a frequency of 1000 time steps. It should be noted that performing long production runs in the NVE ensemble is quite difficult for the mixture. Also, the Langevin thermostat affects the equilibrium fluctuations by applying random forces on the particles. Therefore, we use temperature rescaling during the VACF production runs in order to maintain the temperature. The timescale for temperature rescaling is chosen such that the VACF decays almost to zero in that time.
3 Results
In this section we first present our numerical results for the equilibrium phase diagram of the LC–DSS mixture at the selected dipole moment μ* = 3.0. Second, we discuss the translational dynamics of the two components. In particular, we investigate the respective MSDs and normalized VACF.3.1 Equilibrium phase diagram
First, we identify the I–N transition by calculating the nematic order parameter S for the LC–DSS mixture. This order parameter is defined as the largest eigenvalue of the ordering tensor Q. The components of the Q-tensor are given by . Here, α, β = x,y,z and ûi is, for LC, the orientation vector and for DSS, the unit dipole vector
 ![[small mu, Greek, circumflex]](https://www.rsc.org/images/entities/b_i_char_e0b3.gif) i. The nematic order parameters Se and Ss for individual components, LC and DSS, are calculated separately using the respective Q tensor. The eigenvectors corresponding to Se and Ss define the directors
i. The nematic order parameters Se and Ss for individual components, LC and DSS, are calculated separately using the respective Q tensor. The eigenvectors corresponding to Se and Ss define the directors ![[n with combining circumflex]](https://www.rsc.org/images/entities/b_i_char_006e_0302.gif) e and s for LC and DSS respectively.
e and s for LC and DSS respectively.
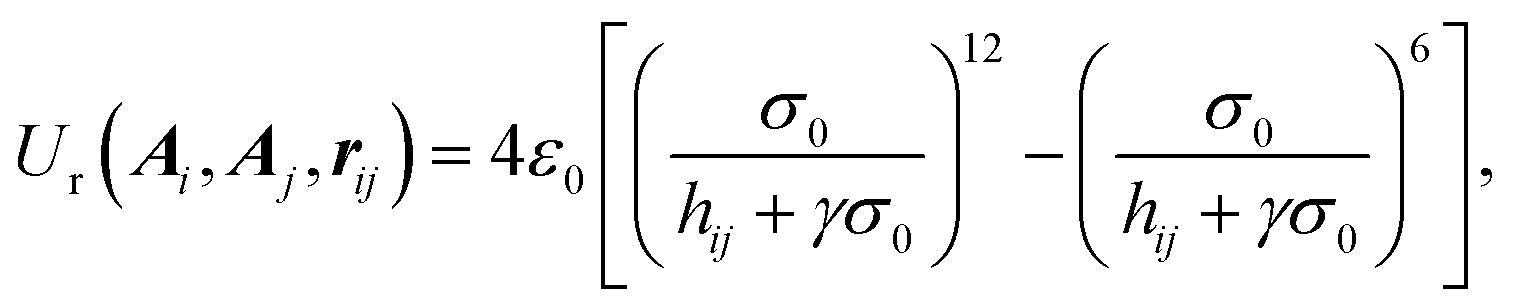
In Fig. 1, we plot Se for the LC matrix (shown by the color axis) as a function of ρ* and T*. At low ρ* and high T*, the LC matrix remains in an isotropic phase while it undergoes an I–N transition at high ρ* and low T* values. The DSS chains follow the LC matrix and undergo an I–N transition at the same values of ρ* and T* (not shown here but visible in the snapshots in Fig. 2). The dashed lines in the plot represent the contours of different Se values. We consider the line corresponding to Se = 0.4 as an approximate I–N transition line obtained via MD simulations. We note here that, although the I–N phase transition is well understood for pure LCs and also for mixtures of LCs and DSS, it is difficult to obtain the precise location of the transition line via MD simulations. This is due to the possible inadequacy of the MD simulations to access the available phase space. One should, indeed, use sophisticated multicanonical Monte Carlo schemes such as histogram reweighting and successive umbrella sampling in order to sample the phase space uniformly.
 | ||
| Fig. 1 The ρ*–T* phase diagram of the LC matrix. The color axis shows the nematic order parameter Se, and dashed lines mark the contours of different Se values. The dashed line corresponding to Se = 0.4 is considered as the I–N phase transition line obtained via MD simulations. Red squares represent state points (0.36, 1.4) and (0.36, 0.8) in the isotropic and nematic phases, respectively. Snapshots corresponding to these two state points are shown in Fig. 2. | ||
 | ||
| Fig. 2 Snapshots of the LC–DSS mixture at the state points marked by the red squares in Fig. 1. (a) Snapshot of the LC–DSS mixture at ρ* = 0.36 and T* = 1.4, (b) snapshot of the LC–DSS mixture at ρ* = 0.36 and T* = 0.8. (c) and (d) The DSS chains in the absence of the LC matrix for the state points considered in (a) and (b), respectively. All the snapshots are prepared using software OVITO.44 | ||
For the illustration of the actual structure, the snapshots of the mixture corresponding to two state points (marked in red squares) are plotted in Fig. 2. At ρ* = 0.36 and T* = 1.4, the mixture is in an isotropic phase. As shown in Fig. 2(a), the LCs and the DSS chains (shown in Fig. 2(c)) are randomly oriented. Furthermore, Fig. 2(b) and (d) show that at ρ* = 0.36 and T* = 0.8, the LC matrix and DSS chains are both in a nematic phase. Also, the two nematic directors e and s are aligned almost parallel to each other which is consistent with the previous MC simulations.25,26
3.2 Mean-square displacements
We, next, analyze the translational dynamics of the two components of the mixture using MSD which is defined as | (8) |
| ϕ(t) = d{ln(〈Δr2(t)〉)}/d{ln(t)}. | (9) |
 | (10) |
In the nematic phase, the displacements of particles are resolved in the components parallel, Δr||, and perpendicular, Δr⊥, to the LC/DSS nematic director e,s at t0 and the corresponding MSDs (〈Δr||2〉 and 〈Δr⊥2〉) are calculated.45,46 For LCs we can extract diffusion coefficients using the Stokes–Einstein relation, which in three dimensions reads  . The diffusion constants in the directions parallel and perpendicular to the nematic director are defined as
 | (11) |
 | ||
| Fig. 3 MSD of DSS in the isotropic regime for ρ* = 0.3 at λ = 4.5, 6.43, 11.25, and 15.0. At low λ, the MSD has a slope of 1.0 at large t (shown by a black dashed line). At large λ, subdiffusive behavior is observed with an exponent of 0.6. The inset shows the instantaneous slope ϕ of MSDs, which saturates to 1.0 for low λ while to 0.6 for large λ at long times. | ||
In order to understand the longtime behavior of the MSD of the DSS at different ρ* and λ, we have obtained a state diagram of α as a function of ρ* and λ, see Fig. 4. Here, the color axis represents α and a black solid line shows the I–N transition, which appears at high ρ* and λ. For λ < 7.0, α remains close to 1.0 for all considered ρ*, reflecting normal diffusive behavior of MSDs. As λ is increased, the longtime behavior becomes subdiffusive at high densities and for λ > 11.0, the dynamics of DSS appears to be subdiffusive even at lower densities.
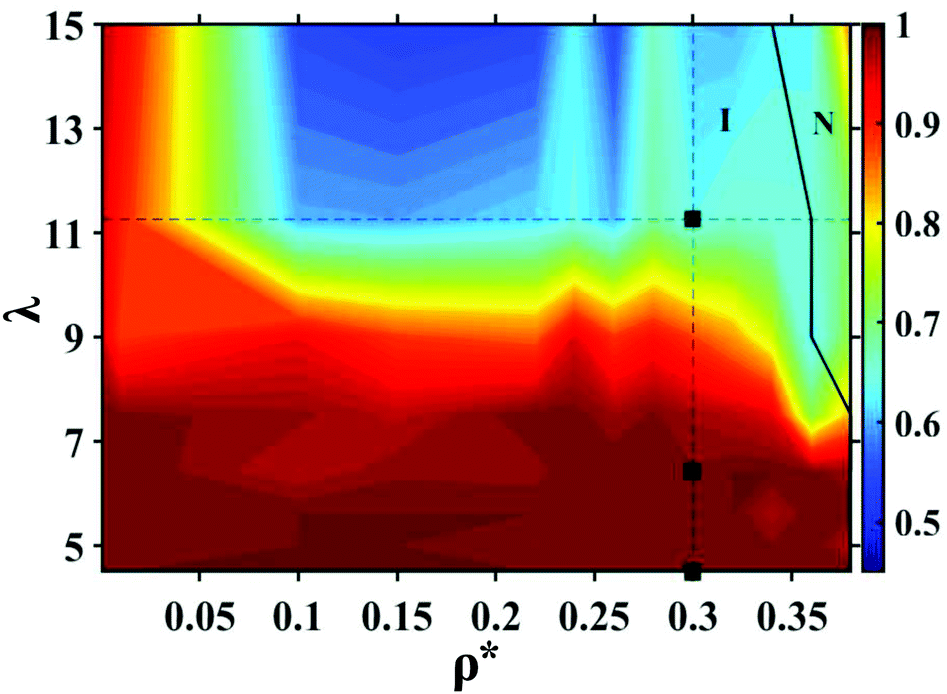 | ||
| Fig. 4 Contour map showing α (see eqn (10)), extracted from the long-time MSD of DSS, as a function of λ (corresponding T* can be obtained using T* = 9.0/λ) and ρ*. One observes a subdiffusive regime at large λ in the isotropic phase. The black solid line represents the I–N transition. The vertical and horizontal dashed lines correspond to fixed ρ* (= 0.3) and fixed λ (= 11.25), respectively. The green squares, marked on the ρ = 0.3 (vertical) line, show three state points λ = 4.5, 6.43 and λ = 11.25 at ρ* = 0.3. | ||
For a better understanding of the crossover of the longtime behavior of MSDs, we explore α along the two black dashed lines shown in Fig. 4. The vertical dashed line represents fixed ρ* (= 0.3) and different λ, while the horizontal dashed line corresponds to fixed λ (= 11.25) and different ρ*s.
The variation of α as a function of λ at a fixed ρ* = 0.3 (along the vertical dashed line in Fig. 4) is shown in Fig. 5(a). Clearly, α shows a crossover from 1.0 to 0.6 as λ is increased. A similar crossover (Fig. 5(b)) is observed when ρ* is varied at fixed λ = 11.25. However, Fig. 4 suggests that λ has to be large (>7.0) in order to see a crossover as a function of ρ*.
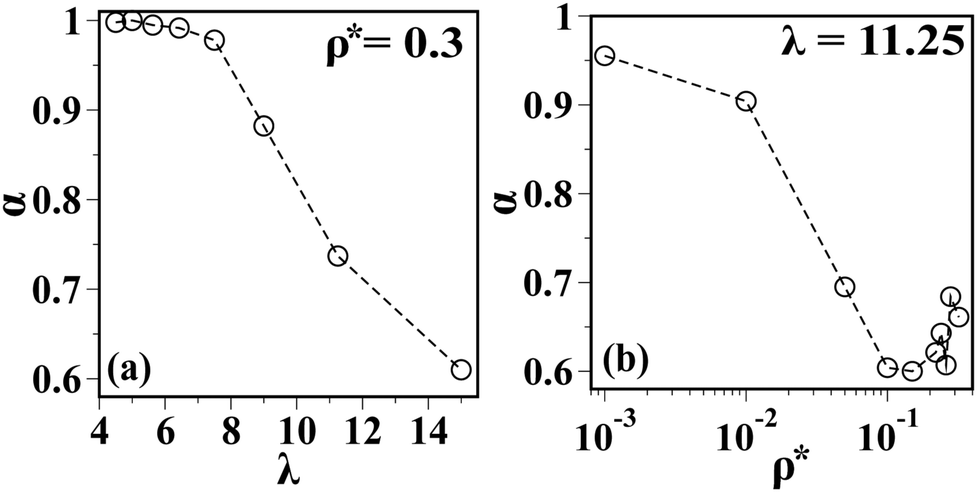 | ||
| Fig. 5 Longtime slopes, α, of MSDs of DSS, (a) data for ρ* = 0.3 as a function of λ and (b) data for λ = 11.25 as a function of ρ*. | ||
In the case of pure DSS, at ρ* = 0.05 and λ = 7.0 and in the absence of an external magnetic field, a sublinear regime in the MSDs is observed at intermediate times which later turns into a diffusive behavior.29 Also, for pure DSS, the self-diffusion constant decreases as λ is increased. A sudden drop in the diffusion constant at a critical λ is observed which is due to the chain formation of DSS.30 In both of these studies29,30 on the pure dipolar fluids, the range of λ is limited to 1–7.0 where the longtime behavior is always diffusive. For the present LC–DSS mixture in the isotropic phase, we observe a monotonic decrease of the self-diffusion constant D* of the DSS as functions of both λ and ρ*, provided that the longtime behavior of the MSD of the DSS is diffusive. This is illustrated in Fig. 6(a) and (b) respectively.
 | ||
| Fig. 6 Self-diffusion constants, D*, of the DSS, (a) data for ρ* = 0.3 as a function of λ and (b) data for λ = 6.43 as a function of ρ*. | ||
We also note that for pure dipolar soft core dumbbells,47 one observes a crossover from longtime diffusive to subdiffusive dynamics at very high dipolar couplings which can be attributed to the network formation. In the present case (the LC–DSS mixture), the subdiffusion at large λ can also be attributed to the chain forming tendency of DSS. As shown in Fig. 7(a), at low λ (i.e. at high T*), the DSS chains are very small. As λ is increased (Fig. 7(b) and (c)) the size of the DSS chains increases due to the strong coupling among the DSS. For a long isotropically distributed DSS chain, its collective motion in a dense environment (provided by the LC matrix) is difficult and, consequently, the DSS show an anomalous transport.
 | ||
| Fig. 7 (a). Snapshots showing DSS chains in the absence of the LC matrix at (a) λ = 4.5, (b) λ = 6.43, (c) and λ = 11.25 for ρ* = 0.3 (see the green square points marked in the Fig. 4). At these values of λ and ρ*, the mixture always remains in the isotropic phase, however, the length of the DSS chains increases as λ is increased. | ||
In the nematic phase, we fix λ = 11.25 (i.e. T* = 0.8) and investigate the MSD for different ρ* in the direction parallel and perpendicular to s. The reason behind such a choice of λ is that at this value, the DSS remain subdiffusive during the entire simulation time window and we expect the nematic ordering in the LC matrix to alter the DSS dynamics parallel to s. Fig. 8(a) shows 〈Δr||2〉 of DSS, which has initial subdiffusive increase (reminiscent of the isotropic phase) which crosses over to a normal diffusive behavior at long times for all considered densities. The 〈Δr⊥2〉 for DSS, plotted in Fig. 8(b), remains subdiffusive even at long times. The exponent of subdiffusion is ∼0.5 which is slower than the observed exponent in the isotropic regime for the total MSD at the same ρ* and λ. The inset in Fig. 8(b) shows the trapping of DSS chains in the transient cylindrical cavities formed by the LC matrix in the nematic phase. This leads to the slowing down of the translational dynamics of the DSS in the direction perpendicular to the nematic director.
 | ||
| Fig. 8 (a). The component of the MSD of the DSS parallel to s at ρ* = 0.36, 0.37, 0.38 and λ = 11.25. The black dashed lines show a slope of 1.0. (b) The component of MSD perpendicular to s for DSS at the same values of ρ* and λ as in (a). The inset shows a top view of the snapshot for ρ* = 0.37 and λ = 11.25. The MSD shows a subdiffusive behavior with an exponent of 0.5. | ||
A possible mathematical model explaining the subdiffusion of the DSS in the isotropic phase of the LC–DSS mixture would be fractional Brownian motion.32,33 However, the situation becomes complex in the nematic phase where an anisotropic environment provided by the LC matrix imposes a normal diffusion at long times in the direction parallel to the nematic director, while in the perpendicular direction the DSS become even slower. Taken together, for the present LC–DSS mixture, a suitable mathematical model is still lacking.
 | ||
| Fig. 9 (a) The MSD of the LC matrix in the isotropic phase. (a) The MSD of the LC matrix at fixed ρ* = 0.3 (along the vertical black dashed line in Fig. 4) for T* = 2.0, 1.4, 1.0, 0.8, and 0.6. The black dashed line shows a slope of 1.0. (b) The MSD of the LC matrix at a fixed T* = 0.8 (along the horizontal black dashed line in Fig. 4) and ρ* = 0.1, 0.22 and 0.32. The inset in both the figures shows the variation of self-diffusion constant as a function of 1/T* and ρ* respectively. | ||
For the nematic phase, the 〈Δr‖2〉 of the LC matrix is plotted in Fig. 10(a). One observes a normal diffusion at long times for all ρ* in the nematic regime. The inset in Fig. 10(a) shows the self-diffusion constants D|| of the LC matrix parallel to e, which are extracted from the long time behavior of the 〈Δr||2〉. We find that D|| shows a non-monotonic behavior with increasing ρ*, consistent with earlier studies of pure LCs.46,48 Initially, at the onset of the I–N transition, LCs tend to align parallel to each other as this is the entropically favored state.45,46 This results in the enhanced diffusion of the LCs parallel to the nematic director. However, at high densities (higher than the coexistence density) when the nematic phase is established, the diffusion of LCs slows down due to an increase of collisions with other LCs.
 | ||
| Fig. 10 The MSD of the LC matrix in the nematic phase. (a) The component of MSD parallel to e for ρ* = 0.36, 0.37 and 0.38 at T* = 0.8. (b) The component of MSD perpendicular to e for the same ρ* and T* as in (a). The longtime behavior of MSDs in all the three cases is diffusive as shown by the black dashed line with a slope of 1.0. The insets in (a) and (b) show the variation of D||* and D⊥* with ρ*. | ||
Fig. 10(b) shows the 〈Δr⊥2〉 for the LC matrix. The long time behavior of 〈Δr⊥2〉 is also normal diffusive. The D⊥*, extracted from 〈Δr⊥2〉, plotted in the inset of Fig. 10(b), decreases monotonically with increasing ρ* which is consistent with the earlier observations.46,48
3.3 Velocity autocorrelation functions
To explore the local environment of particles, we study the normalized VACF which is defined as Cv(t) = 〈v(t0)·v(t + t0)〉/〈v(t0)·v(t0)〉.43 The VACF resolved in the direction parallel and perpendicular tos, Cv‖,⊥(t), is defined similar to Cv(t), where only the respective components of the velocity are considered.
The results for the VACF for the DSS in the isotropic regime are plotted in Fig. 11(a) for λ = 4.5, 6.43 and 11.25 at ρ* = 0.3 (along the vertical dashed line in Fig. 4). At low λ, the VACF decay smoothly without any oscillations. This indicates that the particles move essentially as unbounded objects, that is, chains are not yet formed. As λ is increased oscillations in the VACF are observed at short time scales which we attribute to chain formation. The oscillatory behavior at short times appears due to the rattling of DSS particles in the chain and indicates its “caging” due to strong dipolar coupling.
 | ||
| Fig. 11 The VACF of the DSS in the isotropic phase (a) for λ = 4.5, 6.43, and 11.25 at a fixed ρ* = 0.3 (along the vertical black dashed line in Fig. 4) and (b) for ρ* = 0.25, 0.28, 0.3, and 0.32 at λ = 11.25 (along the horizontal black dashed line in Fig. 4). (c) The VACF for DSS in the nematic regime at ρ* = 0.38 and λ = 11.25. The red dashed and green dot–dashed lines represent the functions Cv‖(t) and Cv⊥(t). The inset shows a top view of the snapshot for ρ* = 0.37 and λ = 11.25. | ||
In the case of pure dipolar fluids in the isotropic phase at comparable λ,49 such an oscillatory behavior is not observed (cf. the red curve in Fig. 11(a)). Also, for pure dipolar dumbbells, the oscillatory behavior in VACF is observed only at a very large λ where dipolar particles form a percolating network.47 In our case, we observe the oscillatory behavior at λ ∼ 6.43 where a percolating network is not yet expected (see, e.g., Fig. 7(b), where long but not system spanning chains are visible at λ = 6.43). We understand the difference between the present mixed system and the pure system as follows: for pure dipolar fluids at λ = 6.66 in the isotropic phase,49 the dipolar chains are randomly distributed and their collective motion is not hindered. Therefore, an oscillatory behavior does not occur in the VACF of the DSS. In the present system, the DSS chains experience a dense environment provided by the LC matrix, which is reflected in the form of oscillations in the VACF of the DSS.
It should also be noted that in Fig. 11(a) at small λ, where DSS chains are much shorter (e.g., Fig. 7(a)), no negative lobe is present in the VACF, which suggests that the short DSS chains or single DSS particles do not feel the dense environment. As the size of the chain grows upon an increase of λ (for a fixed ρ*), the role of the LC matrix becomes more evident in modifying the dynamics. Fig. 11(b) shows the VACF of DSS at a fixed T* = 0.8 and various ρ* (along the horizontal black dashed line in Fig. 4). Here, the oscillatory behavior can be seen at all considered ρ*.
In the nematic phase, Cv‖(t) for the DSS chains, plotted in Fig. 11(c) (shown by a red dashed line) decays faster than Cv⊥(t) (represented by a green dot–dashed line). The oscillations after the smooth initial decay are present in both the components. This is contrary to earlier observations for pure DSS where oscillations in Cv⊥ are not found.49 The oscillations in the parallel component arise due to the strong dipolar interactions which force the particles to remain in the chain. In the present case, the oscillations in the perpendicular component are the result of the confinement of the DSS chains in a narrow cylindrical channel formed by the LC matrix as shown in the inset of Fig. 11(c). Such an oscillatory behavior is peculiar to the dipolar fluids confined in a narrow space.50
We now turn to the VACF for the LC matrix. The results for the isotropic phase along the two dashed lines shown in Fig. 4 are plotted in Fig. 12. Similar to the earlier observations, Fig. 12(a) shows that the VACF do not show any negative lobe for the whole range of T* considered in the isotropic phase at ρ*= 0.3 (along the vertical black dashed line in Fig. 4). At lower T*, a plateau appears which later converts into a minimum and a maximum.46 A similar behavior is observed (Fig. 12(b)) at fixed T* = 0.8 and various ρ* (along the horizontal black dashed line in Fig. 4).
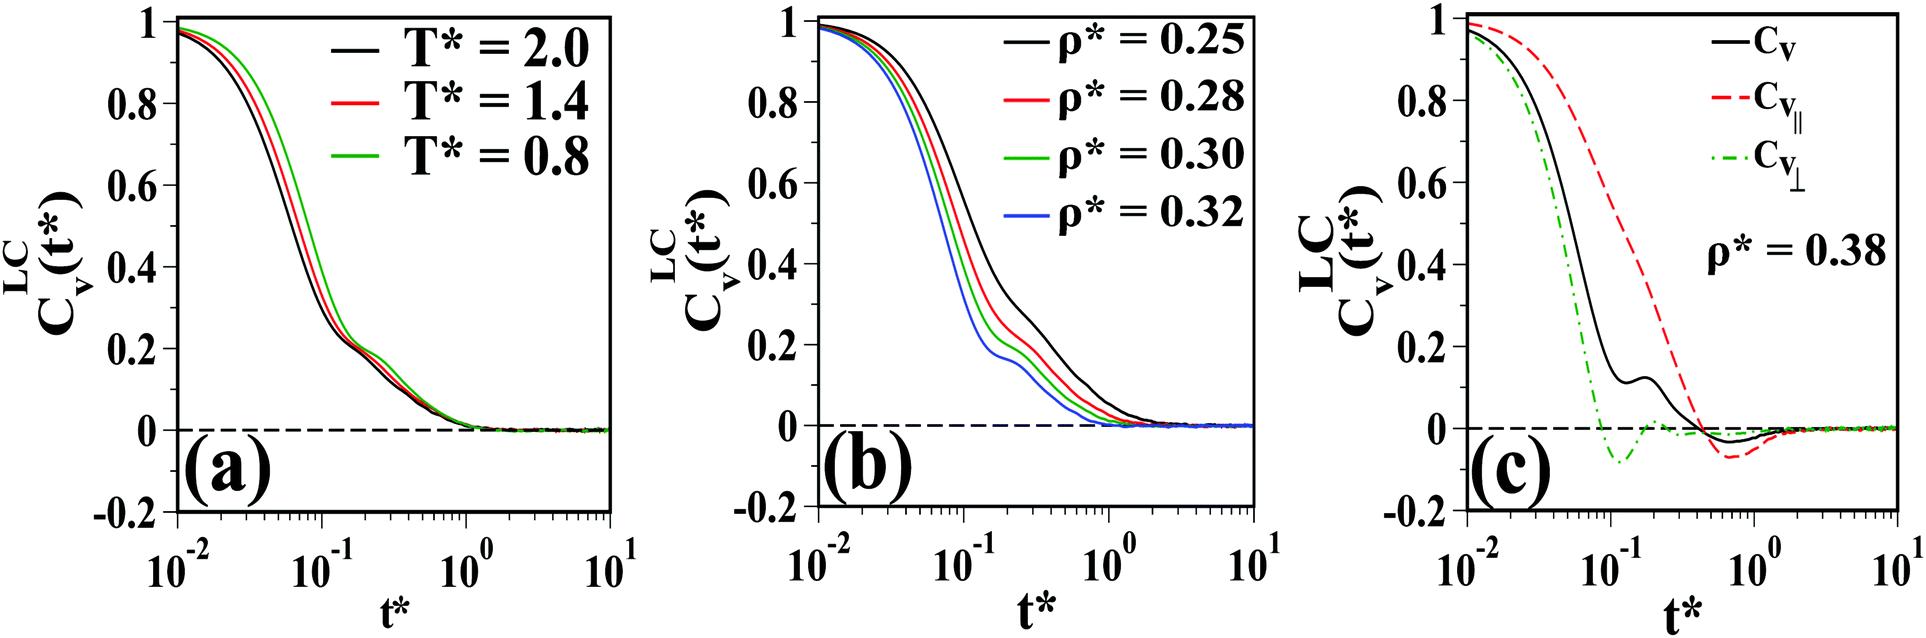 | ||
| Fig. 12 The VACF of the LC matrix in the isotropic phase (a) for T* = 2.0, 1.4, and 0.8 at fixed ρ* = 0.3 (along the vertical black dashed line in Fig. 4) and (b) for ρ* = 0.25, 0.28, 0.3, and 0.32 at T* = 0.8 (along the horizontal black dashed line in Fig. 4). (c) The VACF for LC in the nematic regime at the ρ* = 0.38 and T* = 0.8. The red dashed and green dot–dashed lines represent Cv‖(t) and Cv⊥(t). The inset shows Cv‖(t) for ρ* = 0.34, 0.35, 0.36, and 0.38. | ||
Finally, the VACF of the LCs in the nematic regime for ρ* = 0.38 and T* = 0.8 is plotted in Fig. 12(c). The “shoulder” (the minimum and the subsequent maximum), which was observed at higher isotropic densities (cf.Fig. 12(b)), becomes more pronounced in the nematic regime. Furthermore, the decay of Cv‖(t) is slower than that of Cv⊥(t) consistent with the larger value of D||*. We observe a small negative region in Cv‖(t) which is an indicator of the high density of the mixture. As discussed in earlier studies,46 the oscillatory behavior in Cv⊥(t) (shown by a green dot–dashed line in Fig. 12(c)) is due to the periodic rebounds of the LC particles in the direction perpendicular to e.
 | (12) |
 | (13) |
 | (14) |
 | (15) |
In Fig. 13, we plot D(τ) as a function of τ calculated from the VACF of the DSS for λ = 4.5, 6.43 and 11.25 at ρ* = 0.3 (the green filled squares marked on the vertical dashed line in Fig. 4). Clearly, for λ = 4.5 and 6.43, D(τ) saturates to D which is calculated from the longtime behavior of the corresponding MSD of the DSS (values of D are shown by dashed black lines in Fig. 13). Furthermore, for λ = 11.25, D(τ) shows a power-law decay with an exponent of −0.35, which is consistent with the exponent of subdiffusion obtained from the corresponding longtime behavior of the MSD of the DSS. Thus, our numerical results confirm the relation between the VACF and the MSD in the longtime limit. The slight discrepancy in the saturated value of D(τ) for λ = 6.43 and the sudden drop in D(τ) for λ = 11.25 at long times may be due to the lack of statistical averaging.
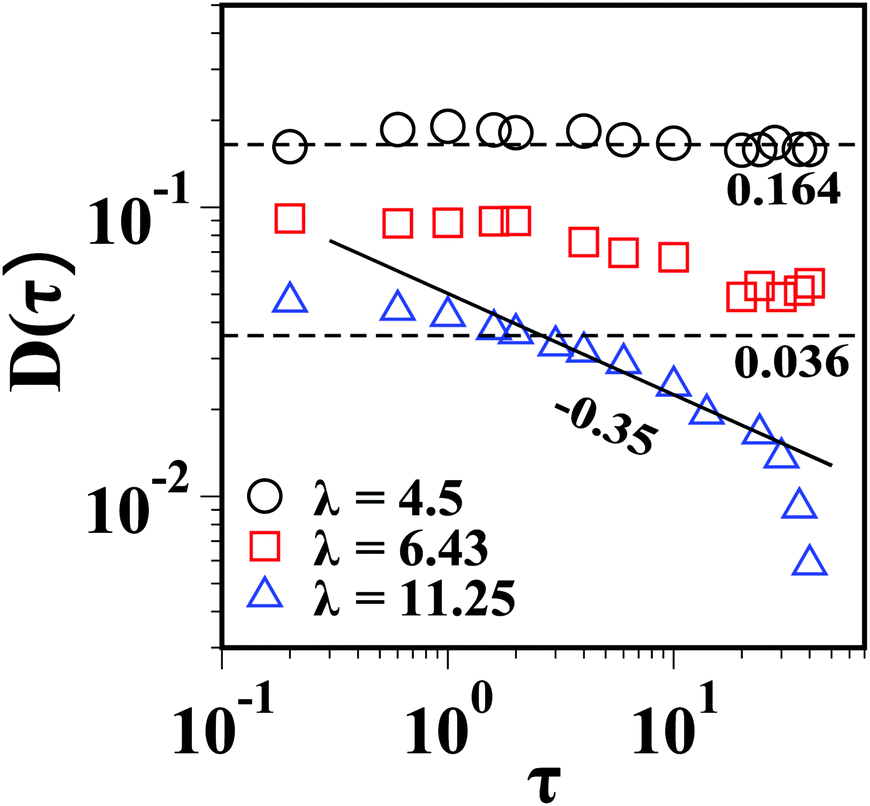 | ||
| Fig. 13 Variation of the time dependent diffusion coefficient D(τ) calculated from the VACF of the DSS as a function of time interval τ for λ = 4.5, 6.43 and 11.25 at ρ* = 0.3. The black dashed lines show the value of D obtained from the MSD of the DSS for λ = 4.5 and 6.43. The solid black line represents a slope of −0.35. | ||
4 Summary and outlook
To summarize, we have presented a detailed MD simulation study on the translational dynamics in a LC–DSS mixture, in which both the species have comparable sizes. Our main finding is that in such a mixture, the DSS show a crossover from normal to anomalous translational dynamics in the isotropoic regime as λ is increased. At small λ the DSS chain lengths are shorter and, therefore, they can easily diffuse inside the LC matrix. However, as λ is increased, the lengths of the DSS chains increase and eventually their translational dynamics become subdiffusive. In this sense, the orientationally disordered LC matrix provides a complex environment which strongly influences the diffusion of host particles.In the nematic regime, the LC particles, due to their cooperative movement and reorientation in the direction parallel to e, form a cylindrical channel and force the DSS chains to align along the channel. As a consequence, the DSS diffuse normally parallel to e while remain subdiffusive in the perpendicular direction. The anisotropic translational dynamics of DSS in narrow slit pores is well studied, and enhanced diffusion of DSS parallel to the channel has been observed.50 The DSS chains in the present case show similar behavior.
The strong confinement imposed by the LC matrix is also reflected in the VACF of the DSS, which show an oscillatory behavior not only in the isotropic regime but also in the nematic regime. The VACF of the LC matrix show a minimum and maximum at short times in the isotropic regime. In the nematic regime, only the perpendicular component of the VACF of the LC matrix shows an oscillatory behavior while the parallel component decays smoothly at high nematic densities.
In this work, we have demonstrated that the LC matrix strongly modifies the translational dynamics of the DSS whereas the LC dynamics remains essentially unaffected. A further study of the rotational dynamics of such mixtures is necessary in order to develop a better understanding of the intrinsic timescles. Also, it will be interesting to explore the effect of an external magnetic field on the dynamics of different components of the mixture, as it has been experimentally shown that a weak magnetic field affects the ordering in these systems.21
We believe that the present study will be very helpful in understanding the rheology of ferronematics as the interplay of intrinsic and shear induced timescales gives rise to intriguing behavior in these complex fluids. Work in these directions is underway.
Conflicts of interest
The authors have no conflict of interest.Acknowledgements
We gratefully acknowledge funding support from the Deutsche Forschungsgemainschaft (DFG) via the priority program SPP 1681. GPS would like to thank Jürgen Horbach, Nima H. Siboni and Sascha Gerloff for fruitful discussions.Notes and references
- Liquid Crystals with Nano and Microparticles, ed. J. P. F. Lagerwall and G. Scalia, World Scientific, 2016, vol. 1 and 2 Search PubMed.
- J. P. F. Lagerwall and G. Scalia, Curr. Appl. Phys., 2012, 12, 1387 CrossRef.
- H. K. Bisoyi and S. Kumar, Chem. Soc. Rev., 2011, 40, 306 RSC.
- C. Blanc, D. Coursault and E. Lacaze, Liq. Cryst. Rev., 2013, 1, 83 CrossRef CAS.
- P. de Gennes and F. Brochard, J. Phys., 1970, 31, 691 CrossRef.
- C. P. Lapointe, T. G. Mason and I. I. Smalyukh, Science, 2009, 326, 1083 CrossRef CAS PubMed.
- C. Scherer and A. M. F. Neto, Braz. J. Phys., 2015, 35, 718 CrossRef.
- Q. Liu, P. J. Ackerman, T. C. Lubensky and I. I. Smalyukh, Proc. Natl. Acad. Sci. U. S. A., 2016, 113, 10479 CrossRef CAS PubMed.
- J. Rault, P. E. Cladis and J. P. Burger, Phys. Lett. A, 1970, 32, 199 CrossRef CAS.
- L. Liebert and A. Martinet, J. Phys., Lett., 1979, 40, L-363 CrossRef.
- A. M. F. Neto and M. M. F. Saba, Phys. Rev. A: At., Mol., Opt. Phys., 1986, 34, 3483 CrossRef.
- S.-H. Chen and N. M. Amer, Phys. Rev. Lett., 1983, 51, 2298 CrossRef CAS.
- P. Kopčanský, N. Tomašovičová, M. Koneracká, V. Závišová, M. Timko, A. Džarová, A. Šprincová, N. Éber, K. Fodor-Csorba, T. Tóth-Katona, A. Vajda and J. Jadzyn, Phys. Rev. E: Stat., Nonlinear, Soft Matter Phys., 2008, 78, 011702 CrossRef PubMed.
- V. Berejnov, J.-C. Bacri, V. Cabuil, R. Perzynski and Y. Raikher, Europhys. Lett., 1998, 41, 507 CrossRef CAS.
- N. Podoliak, O. Buchnev, O. Buluy, G. D’Alessandro, M. Kaczmarek, Y. Reznikov and T. Sluckin, Soft Matter, 2011, 7, 4742 RSC.
- O. Buluy, S. Nepijko, V. Reshetnyak, E. Ouskova, V. Zadorozhnii, A. Leonhardt, M. Ritschel, G. Schönhense and Y. Reznikov, Soft Matter, 2011, 7, 644 RSC.
- S. Kredentser, O. Buluy, P. Davidson, I. Dozov, S. Malynych, V. Reshetnyak, K. Slyusarenko and Y. Reznikov, Soft Matter, 2013, 9, 5061 RSC.
- A. Mertelj, D. Lisjak, M. Drofenik and M. Čopič, Nature, 2013, 504, 237 CrossRef CAS PubMed.
- F. Arantes and S. Odenbach, J. Magn. Magn. Mater., 2015, 390, 91 CrossRef CAS.
- S. H. Navarro, P. Tierno, J. I. Mullol and F. Sagués, Soft Matter, 2011, 7, 5109 RSC.
- K. May, A. Eremin, R. Stannarius, S. D. Peroukidis, S. H. L. Klapp and S. Klein, Langmuir, 2016, 32, 5085 CrossRef CAS PubMed.
- S. I. Burylov and Y. L. Raikher, Mol. Cryst. Liq. Cryst., 1995, 258, 123 CrossRef CAS.
- A. B. Ryskin, H. Pleiner and H.-W. Müller, Eur. Phys. J. E: Soft Matter Biol. Phys., 2003, 11, 389 CrossRef CAS PubMed.
- E. Jarkova, H. Pleiner, H.-W. Müller and H. R. Brand, J. Chem. Phys., 2003, 118, 2422 CrossRef CAS.
- S. D. Peroukidis, K. Lichtner and S. H. L. Klapp, Soft Matter, 2015, 11, 5999 RSC.
- S. D. Peroukidis and S. H. L. Klapp, Phys. Rev. E: Stat., Nonlinear, Soft Matter Phys., 2015, 92, 010501(R) CrossRef PubMed.
- S. D. Peroukidis and S. H. L. Klapp, Soft Matter, 2016, 12, 6841 RSC.
- S. Odenbach, Magnetoviscous Effects in Ferrofluids, Springer, Berlin, Heidelberg, 2003 Search PubMed.
- J. Jordanovic, J. Sebastian and S. H. L. Klapp, Phys. Rev. Lett., 2011, 106, 038301 CrossRef PubMed.
- A. Shreekumari and P. Ilg, Phys. Rev. E: Stat., Nonlinear, Soft Matter Phys., 2013, 88, 042315 CrossRef PubMed.
- F. Höfling and T. Franosch, Rep. Prog. Phys., 2013, 76, 046602 CrossRef PubMed.
- E. Barkai, Y. Garini and R. Metzler, Phys. Today, 2012, 65, 29 CrossRef CAS.
- Y. Meroz and I. M. Sokolov, Phys. Rep., 2015, 573, 1 CrossRef.
- J. Horbach, S. K. Schnyder and N. H. Siboni, Eur. Phys. J.: Spec. Top., 2017, 226, 3113 Search PubMed.
- S. Plimpton, J. Comput. Phys., 1995, 117, 1 CrossRef CAS.
- W. M. Brown, M. K. Petersen, S. J. Plimpton and G. S. Grest, J. Chem. Phys., 2009, 130, 044901 CrossRef PubMed.
- R. Berardi, A. Costantini, L. Muccioli, S. Orlandi and C. Zannoni, J. Chem. Phys., 2007, 126, 044905 CrossRef PubMed.
- R. Everaers and M. R. Ejtehadi, Phys. Rev. E: Stat., Nonlinear, Soft Matter Phys., 2003, 67, 041710 CrossRef CAS PubMed.
- D. Wei and G. N. Patey, Phys. Rev. Lett., 1992, 68, 2043 CrossRef CAS PubMed.
- J. A. Morenao-Razo, E. DÍaz-Herrera and S. H. L. Klapp, Mol. Phys., 2006, 104, 2841 CrossRef.
- M. Schoen and S. H. L. Klapp, Reviews of Computational Chemistry, John Wiley and Sons, New York, 2007, vol. 24 Search PubMed.
- Z. Wang, C. Holm and H. W. Müller, Phys. Rev. E: Stat., Nonlinear, Soft Matter Phys., 2002, 66, 021405 CrossRef PubMed.
- M. Allen and D. Tildesley, Computer Simulation of Liquids, Oxford University Press, Oxford, UK, 2006 Search PubMed.
- A. Stukowski, Modell. Simul. Mater. Sci. Eng., 2010, 18, 015012 CrossRef.
- H. Löwen, Phys. Rev. E: Stat. Phys., Plasmas, Fluids, Relat. Interdiscip. Top., 1999, 59, 1989 CrossRef.
- E. de Miguel, L. F. Rull and K. E. Gubbins, Phys. Rev. A: At., Mol., Opt. Phys., 1992, 45, 3813 CrossRef CAS.
- R. Blaak, M. A. Miller and J. P. Hansen, Europhys. Lett., 2007, 78, 26002 CrossRef.
- M. P. Allen, Phys. Rev. Lett., 1990, 65, 2881 CrossRef PubMed.
- D. Wei and G. N. Patey, Phys. Rev. E: Stat. Phys., Plasmas, Fluids, Relat. Interdiscip. Top., 1993, 47, 2954 CrossRef.
- V. A. Froltsov and S. H. L. Klapp, J. Chem. Phys., 2006, 126, 114703 CrossRef PubMed.
- D. Frenkel and B. Smit, Understanding Molecular Simulation, Academic Press, 2nd edn, 2001 Search PubMed.
| This journal is © The Royal Society of Chemistry 2019 |