
 Open Access Article
 This Open Access Article is licensed under a
 Creative Commons Attribution 3.0 Unported Licence
3D printing with 2D colloids: designing rheology protocols to predict ‘printability’ of soft-materials
Andrew
Corker
ab,
Henry C.-H.
Ng
 b,
Robert J.
Poole
b and
Esther
García-Tuñón
*ab
b,
Robert J.
Poole
b and
Esther
García-Tuñón
*ab
aMaterials Innovation Factory, University of Liverpool, UK. E-mail: Esther.GTunon@liverpool.ac.uk
bDepartment of Mechanical, Materials and Aerospace Engineering, School of Engineering, University of Liverpool, UK
First published on 22nd January 2019
Abstract
Additive manufacturing (AM) techniques and so-called 2D materials have undergone an explosive growth in the past decade. The former opens multiple possibilities in the manufacturing of multifunctional complex structures, and the latter on a wide range of applications from energy to water purification. Extrusion-based 3D printing, also known as Direct Ink Writing (DIW), robocasting, and often simply 3D printing, provides a unique approach to introduce advanced and high-added-value materials with limited availability into lab-scale manufacturing. On the other hand, 2D colloids of graphene oxide (GO) exhibit a fascinating rheology and can aid the processing of different materials to develop ‘printable’ formulations. This work provides an in-depth rheological study of GO suspensions with a wide range of behaviours from Newtonian-like to viscoelastic ‘printable’ soft solids. The combination of extensional and shear rheology reveals the network formation process as GO concentration increases from <0.1 vol% to 3 vol%. Our results also demonstrate that the quantification of ‘printability’ can be based on three rheology parameters: the stiffness of the network via the storage modulus (G′), the solid-to-liquid transition or flow stress (σf), and the flow transition index, which relates the flow and yield stresses (FTI = σf/σy).
 Andrew Corker | Andrew Corker is currently a PhD candidate in the School of Engineering and Materials Innovation Factory at the University of Liverpool. He received his Master's Degree in Mechanical Engineering from the same institution. His research interests focus on the rheology of complex fluids, the study of 2D colloids and their role in extrusion-based 3D printing techniques. |
 Henry Ng | Henry Ng is currently a postdoctoral research associate in School of Engineering at the University of Liverpool. He received his PhD in Mechanical Engineering from the University of Melbourne after obtaining a Bachelor degree in Mechanical Engineering from the same institution. His research interests focus on experimental fluid mechanics and includes the study of wall bounded turbulent flows using advanced diagnostic techniques, gas turbine aerodynamics and the rheology of complex fluids. |
 Robert J. Poole | Rob Poole is currently the Head of Department of Mechanical, Materials and Aerospace Engineering within the School of Engineering at The University of Liverpool. He has a PhD in Mechanical Engineering from the same Institution and an undergraduate degree in Mechanical Engineering from Loughborough University. He currently holds an EPSRC fellowship (Complex Fluids & Rheology) and his research interests are primarily centred around the flow of complex fluids including both experimental and numerical approaches. |
 Esther García-Tuñón | Esther García-Tuñón completed her degree in Chemical Engineering and a PhD in Materials Science from the University of Santiago de Compostela, Galicia (Spain). She moved to the UK to join the Centre for Advanced Structural Ceramics (CASC) at Imperial College London with a Barrie de la Maza fellowship, in October 2011. After six years as a postdoctoral researcher at Imperial, Esther joined the University of Liverpool in 2017 as a Lecturer in Materials Science and Engineering affiliated to the Materials Innovation Factory (MIF) and the School of Engineering. Esther also loves practising and teaching yoga. She is an upside-down ‘addict’ and likes working sitting on the floor in her office. Her research interests include colloidal processing, complex fluids and rheology. |
Introduction
Designing formulations with controlled rheology is key in most processing approaches, and fundamental in extrusion-based 3D printing. Robocasting, also known as Direct Ink Writing (DIW),1–3 is a versatile additive manufacturing (AM) technique that involves the continuous extrusion of colloidal4–6 or gel1,3,7 formulations through a fine nozzle to create 3D objects. Complex structures are designed via Computer Aided Design (CAD) and transferred to the software that controls the robot. The formulations are then deposited through the nozzle layer by layer until the desired shape is built. Extrusion-based 3D printing is an extremely versatile technique that enables the introduction of new functional,4,8–11 advanced and 2D materials5,7,9,12–14 with high added value and limited availability into a bespoke manufacturing technique to create on demand structures and devices.8–11,15 It enables intricate parts for very specific applications to be created when a low number of parts are required, which would not be viable or affordable to make by other means. Many efforts are being made in formulation design5,9,12–14,16 while the applications of this technique, for example in 3D printed batteries15,17 and supercapacitors,10,16 composites12,17–19 and hierarchical structures,10,12 and bio(3D)printing12,18–20 to name a few are steadily expanding. For many, the rapid growth promises a future where the ‘imagination is the limit’ but to actually get there, many challenges must be addressed from a multidisciplinary perspective. Gaps in the fundamental understanding that underpins this technique must be filled in order to expand its use in manufacturing.The definition of printability in extrusion-based printing is somewhat vague, and means different things to researchers working towards different applications. For example, the requirements for DIW of glass and bio-printing are different to the needs in complex structures with high level of detail. In 3D-bioprinting inks must have relatively low yield stresses and storage moduli (G′) in order to keep the cells alive;12,14 this is also the case for glass formulations, where the stiffness of the inks is key for the successful post-processing stages, in order to avoid opacity and cracking.14,20 On the other hand, many other applications in complex hierarchical structures require ‘stiff’ pastes that enable high printing resolutions to be achieved. Despite the differences between these applications, it is generally recognised that printable formulations must be a shear thinning, yield-stress soft material exhibiting solid-like behaviour. The storage modulus (G′) values must be high to retain the shape, to support its own weight and the layers on top and to span across supports. The ‘yield’ stress must also be high enough to retain printing resolution as the filament is deposited, but within certain limits to facilitate an easy flow initiation during the printing process. However, quantification of these general criteria is so far unclear, partly due to the diversity of the rheological methodologies used in the field and a lack of common protocols, and partly due to the wide range of ‘soft-materials’ with complex viscoelastic fingerprints currently used. The rheological parameters are paste specific, i.e. they depend on the intrinsic properties of the materials in the formulation, density, specific surface, etc. and the formulation approach, as a consequence colloidal systems, gels and liquid crystals of 2D materials will respond differently during the printing process. A wide range of colloidal and hydrogel-based formulations can be easily found in the literature, some of them pH or temperature sensitive, solvent and water based. We have developed formulations based on 2D colloids of graphene oxide (GO) in the absence of additives.1,4,14 In between macro-molecular assemblies, colloids, gels and liquid crystals, GO suspensions in water are a unique class of soft materials with a fascinating rheological behaviour that does not completely fit in any of the aforementioned classes. Similarly to colloidal systems when concentration increases GO flakes form elastic networks that can be 3D printed and also aid the printing of powders with different chemistries, sizes and shapes.14 Unlike particle systems, which often follow the Krieger–Dougherty model (i.e. exponential increase with volume fraction),1,4,21 the elasticity of GO networks rapidly increases with concentration following a power law behaviour. According to data compiled from the literature this is common to a variety of GO flakes with different functional groups and lateral dimensions.14,22
Here we provide an in-depth rheology study combining oscillatory, shear and extensional tests that will contribute to the establishment of protocols to define and predict ‘printability’. The work focuses on GO 2D colloids and provides new insights on their behaviour (including a better understanding of network formation, structure breakdown and recovery) that are relevant to many other materials in the ‘flatland’, for example ‘2D polymers’23 and other layered materials24,25 and crucial to understand their potential role in wet processing and manufacturing. Varying the flake concentration leads to a wide range of behaviours from Newtonian-like to highly elastic, providing a library of formulations with different printing behaviours. The different rheological tests performed on the GO suspensions provide a comprehensive approach to identify the key rheological parameters involved in the printing process and how they relate to each other. Monitoring structure evolution during the transition from LAOS to SAOS (‘recovery’ tests) enables the quantification of the aggregation kinetics and shows how it scales with the stiffness of the network.
Experimental
GO synthesis
GO was produced by graphite exfoliation using the modified Hummers method inside a jacketed reactor.7,8 24 g of graphite were chemically exfoliated using strong oxidising agents, which produced around 3 L of graphene oxide slurry at approximately 0.4 vol% once washed (this being the “stock” slurry). The procedure was as follows; 24 g of high quality graphite flakes were first placed into the reactor. 5300 g of sulphuric acid (H2SO4) (97 wt%) followed by 544 g of phosphoric acid were fed into the reactor with a peristaltic pump. 144 g of KMnO4 was slowly added, while the temperature was maintained at 50 °C for 18 hours. The temperature was then lowered to 20 °C before adding 1600 g of water and 120 g of H2O2 (30 wt%). Once cooled down, the reactor contents were drained into 6 plastic bottles for centrifugation to complete the exfoliation of GO flakes. The 1st centrifugation cycle was set at 9000 rpm for 1 h. Followed by additional centrifugation cycles until the supernatant was clear; it was then drained and replaced with approximately 2 L of distilled water. Afterwards, the washing process was repeated 14 times at 5 h centrifugation cycles, when the pH of supernatants was ∼5, and most of the remaining acids in solution were washed.Suspension preparation and characterisation
GO stock solution (0.4 vol%) was diluted to prepare the formulations with low GO concentration. GO freeze-dried powders were redispersed in the GO suspensions to increase the GO vol% content accordingly. The powders were added in very small amounts with short mixing cycles in between to facilitate homogenization. GO concentrations ranged from 0.05 to 3 vol%. The upper limit was chosen based on different criteria: (i) preparing GO pastes of higher concentration is possible but time and material consuming as this requires to re-disperse large amounts of freeze-dried powders into water; (ii) the 3 vol% GO sample became too stiff for the rheological tests here proposed; (iii) the 3 vol% GO adequately provided the desired printing behaviour and it did show a different trend (see results for flow stress, FTI and G′) to other samples within the ‘printable’ region; and in addition, (iv) increasing the concentration beyond printing requirements may have a negative impact on the performance of printed structures due to the increase of density and the re-stacking of 2D layers. The pH of GO stock slurry, suspensions and formulations was monitored using a S210 (with InLab® Expert Pro-ISM) pH-meter. GO Lateral flake size was measured from images taken with an optical microscope (Olympus BX-53) using the software ImageJ.Raman spectroscopy was performed on the GO stock solution using a Renishaw inVia confocal Raman Microscope equipped with a 532 nm laser (power 100%, with an 50× objective, and exposure time of 10 s). The surface tension of GO suspensions with different concentrations was measured using the pendant drop method in a Kruss Drop Shape Analyzer DSA100. The relationship between surface tension and gravity determines the shape of the pendant drop. The surface tension is calculated from the shape (using the Kruss software) of a drop of sample suspended in air from a needle (of 2 mm diameter for the 0.1 and 0.2 vol% GO and of 0.5 mm diameter for 0.3 vol% and above). This technique fails when the materials exhibit a yield stress.
Extensional rheology
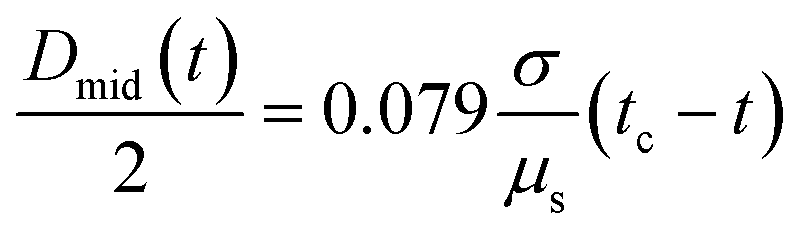
Capillary breakup extensional rheology (CaBER) measurements were carried out using a Haake CaBER-1 extensional rheometer which consists of two parallel circular end plates of diameter Dp = 4 mm set to an initial gap of L0 = 2 mm. The initial gap is manually set with a micrometer (Holex T0503-100A 0–25 mm, Resolution 2 μm). The time evolution of the fluid filament diameter was captured using a high-speed camera. Filaments were backlit using a ThorLabs OSL2 FiberIlluminator and viewed through a 6× microscope objective connected to an IDT XS5-M-4 high-speed camera (Integrated Design Tools, Inc. USA, 1280 × 1024) via an extension tube, which yielded a maximum spatial resolution of 1.97 μm per pixel. Images were acquired at a maximum of 6040 frames per second (fps), which could be achieved by reducing the region of interest (ROI) to 1280 × 176 pixels. This limited the field-of-view (FOV) to 2.52 × 0.35 mm (height-by-width) at maximum magnification. Images of the filament evolution and breakup were processed in MATLAB® using bespoke routines written in-house. The images are first binarised to maximize the contrast at the interface between the liquid filament and surrounding air. The liquid/air interface is traced with the “Canny” edge detection routine in-built in MATLAB®.21,26 Here we use the “Slow Retraction Methodology” (SRM) protocol introduced by Campo-Deaño and Clasen to probe the extensional viscosity of elastic fluids with ultra-short relaxation times.7,14,22 SRM is a modified operational protocol where instead of applying a step strain to the sample, the liquid bridge is brought close its stability limit before the end plates are driven apart at a very low velocity (0.2 mm s−1) to initiate the filament breakup process. Each CaBER measurement was performed using a fresh sample (i.e. CaBER is cleaned and new sample is loaded each time). All experiments were conducted at room temperature (∼20 °C) without solvent trap and the total time for each measurement was less than 30 seconds (from sample loading to ultimate breakup) so solvent evaporation can be considered negligible. In this work, we adopt the SRM because at these very low GO concentrations, inertia dominates and the filament would break before cessation of motion of the top plate using the standard CaBER protocol (step-strain), thus making measurements impossible. As the extrusion process contains some extensional flow, these CaBER tests provide additional rheological insight beyond simple shear.Rotational rheology
Oscillatory and shear tests were carried out in a TA Ares G2 at 20 °C using a stainless steel serrated 40 mm parallel plate geometry with solvent trap and 1 mm gap. Highly concentrated GO suspensions (3 vol%) were measured with a 25 mm Polyphenylene sulphide (PPS) parallel plate due to its highly elastic response. Shear tests were performed using shear-rate controlled flow ramps (300 s, 50 points) from 0.01 s−1 to 200 s−1 (which was estimated to be above the maximum shear rate that would be imparted on an ink during printing). Structure evolution tests consisted of 5 oscillatory steps performed sequentially. Steps 1, 3 and 5 are simple time sweeps in SAOS at fixed frequency (0.5 Hz) and strain (0.5%). Step 1 determines the initial structure and stability over time of the sample. Step 2 determines how the structure responds to frequency changes, with a frequency sweep from 0.5–50 Hz (and fixed strain of 0.5%). Step 3 monitors the recovery after step 2. Step 4 determines how the structure responds with changes in strain from short (SAOS) to large amplitude (LAOS) with an amplitude sweep from 0.1% to 50% strain at fixed low frequency (0.5 Hz). The viscoelastic properties (G′ and G′′ (loss modulus)) were monitored as a function of time to quantify how the structure of each sample changes over the 5 different stages. Step 5 enables quantifying the recovery of the initial structure and identifying permanent deformation.Additional amplitude sweeps (strain between 0.01% and 150% at 0.5 Hz) were carried out to determine the linear viscoelastic region (LVR) and quantify the inner structure and break down process. The yield stress, σy, and yield strain, γy, values are determined at the limit of the LVR; @rest G′ values were determined as the average within the LVR; and the strain and stress at the flow point, σf and γf respectively, were determined at the crossover point (G′ = G′′). We define the flow transition index, FTI = σf/σy as a dimensionless parameter to characterise the breaking behaviour of the inner structure, which illustrates the brittle behaviour of the soft material as FTI approaches to 1.26,27 Recovery tests consisted of two stages to monitor the transition from LAOS (Large Amplitude, time sweep at 150% strain held for 200 s) to SAOS (Small Amplitude, time sweep at 0.5% strain held for times between 200 s and 60 min) at fixed frequency of 0.5 Hz. This test aims to quantify the recovery behaviour of the formulation upon deposition during the printing process.
Results and discussion
GO characterisation
GO stock solution with a pH of 2.2 has a concentration of 0.4 vol% (calculated by freeze drying 5 different aliquots of slurry). Elemental chemical analysis on GO freeze-dried powders (Thermo Scientific Flash 2000 configured for %CHNS) determines that the batch in this work contains an average of 37.6 wt% C, 2.2 wt% H and 0 wt% N. The remaining oxygen content is estimated to be 60.2 wt% giving a GO C/O content of 0.66, which is a higher oxidation degree than previous batches.7,14,27 The lateral flake size measured from microscopy varies from ∼11 to ∼230 μm with a mean size of ∼64 μm. The Raman analysis on a drop of GO stock slurry confirms the expected vibrational modes for GO (Fig. 1).27–29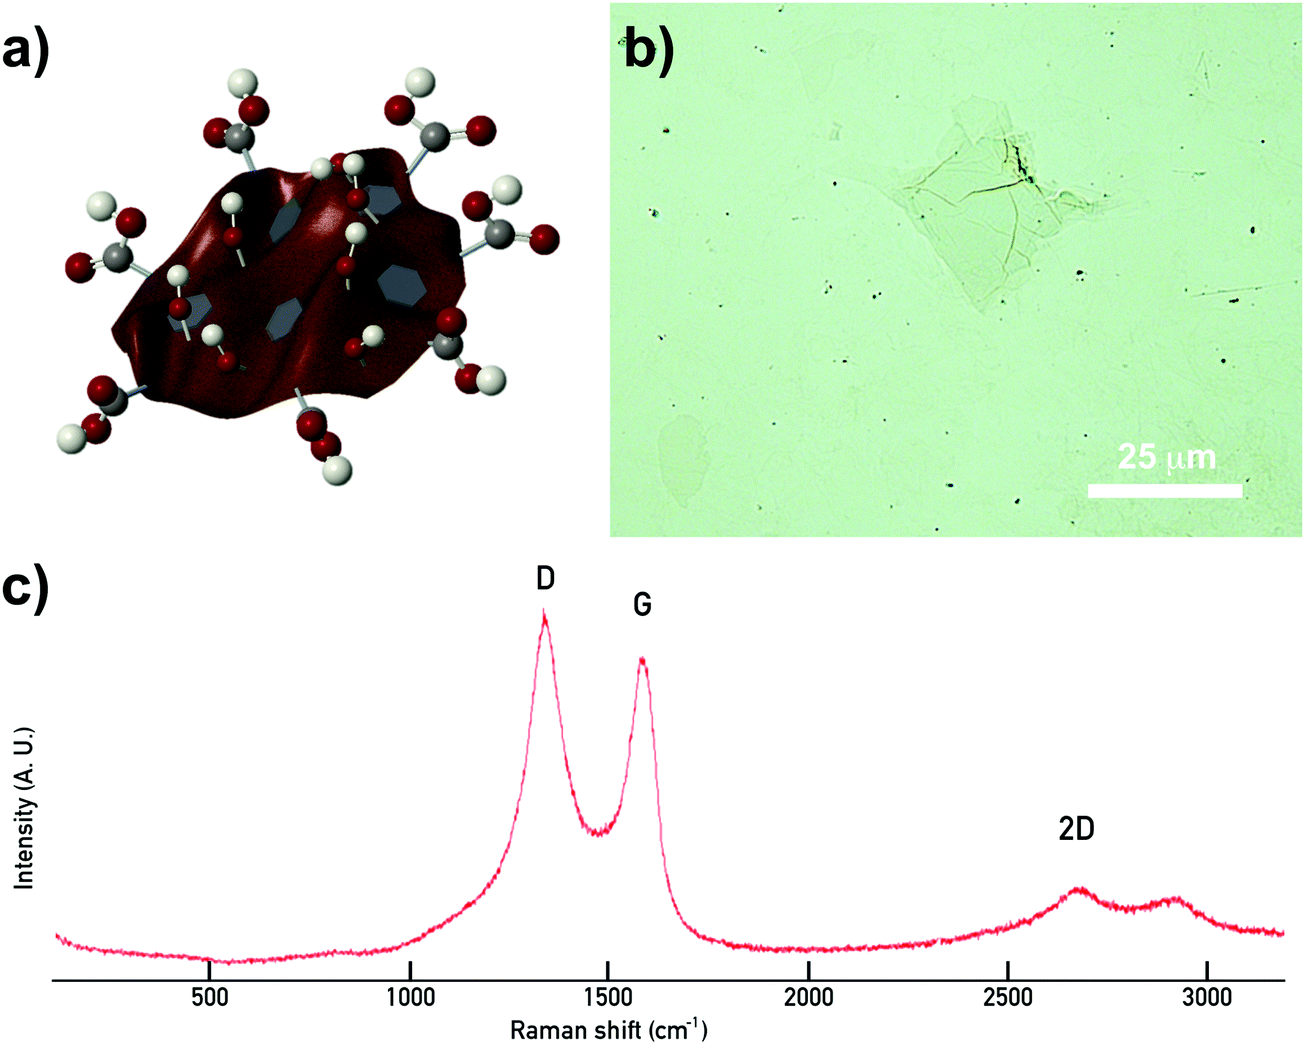 | ||
| Fig. 1 Schematic representation of a GO flake and characterisation results. (a) Scheme illustrating the 2D and amphiphilic nature of GO due to the configuration of different functional groups on the basal plane (carboxylic acids –COOH, hydroxyls –OH, epoxy rings –O–, and un-oxidised islands) and edges (–COOH & –OH) on GO flakes. (b) Image of a GO flake taken with an optical microscope; (c) Raman spectrum showing the characteristic vibrational peaks for GO (D, G and 2D).27,29 | ||
Surface tension
Pendant-drop measurements on droplets of GO suspensions prove its amphiphilic nature, which is pH and particle size dependent.14,28–30 A GO colloid is a 2D flake-like particle of carbon atoms in a honeycomb structure with different functional groups in its basal plane and edges. Carboxyl (–COOH) and hydroxyl (–OH) groups decorate both, basal plane and edges, epoxy rings (–O–) connect some of the carbon atoms in the honeycomb, while some regions in the basal plane remain unoxidized;14,29,31 thus leading to a balance between hydrophobic and hydrophilic regions. The amphiphile character will vary with particle size as well as batch-to-batch synthesis (due to differences with starting materials and exfoliation conditions that may lead to different oxidation degrees). The combination of a 2D structure with this special chemistry gives GO colloids characteristics of particles and macromolecules, a new class of soft materials.14,28,30 GO colloids can bend, twist and arrange in networks through different inter particle interactions which results in the formation of liquid crystals with fascinating rheology.14,31,32 At concentrations of 0.1 vol%, the pendant drop test indicates that small additions of GO start to reduce the surface energy at the air/water interface. SFT values drop from 72 mN m−1 (water) to 68 ± 1 mN m−1, due to the diffusion of the GO particles to the interface.28,33 At 0.2 vol% the SFT is reduced to 56 ± 2 mN m−1, and then considerably decreases as GO concentration increases to 0.3 vol% and 0.4 vol% (Fig. 2), with SFT values of 29 ± 2 mN m−1 and 26 ± 2 mN m−1 respectively. However further increasing the GO concentration results in considerably changes to the rheological response and surface tension. The droplet shape changes to a swollen filament with non-spherical shapes due to arising yield stress behaviour (Fig. 2e). As concentration increases the GO flakes form networks where behaviour shifts from liquid to solid-like, making it not feasible to determine the surface tension using this technique. This transition from Newtonian liquid to a viscoelastic liquid and then to a viscoelastic solid is also apparent from a rheology perspective in the following sections.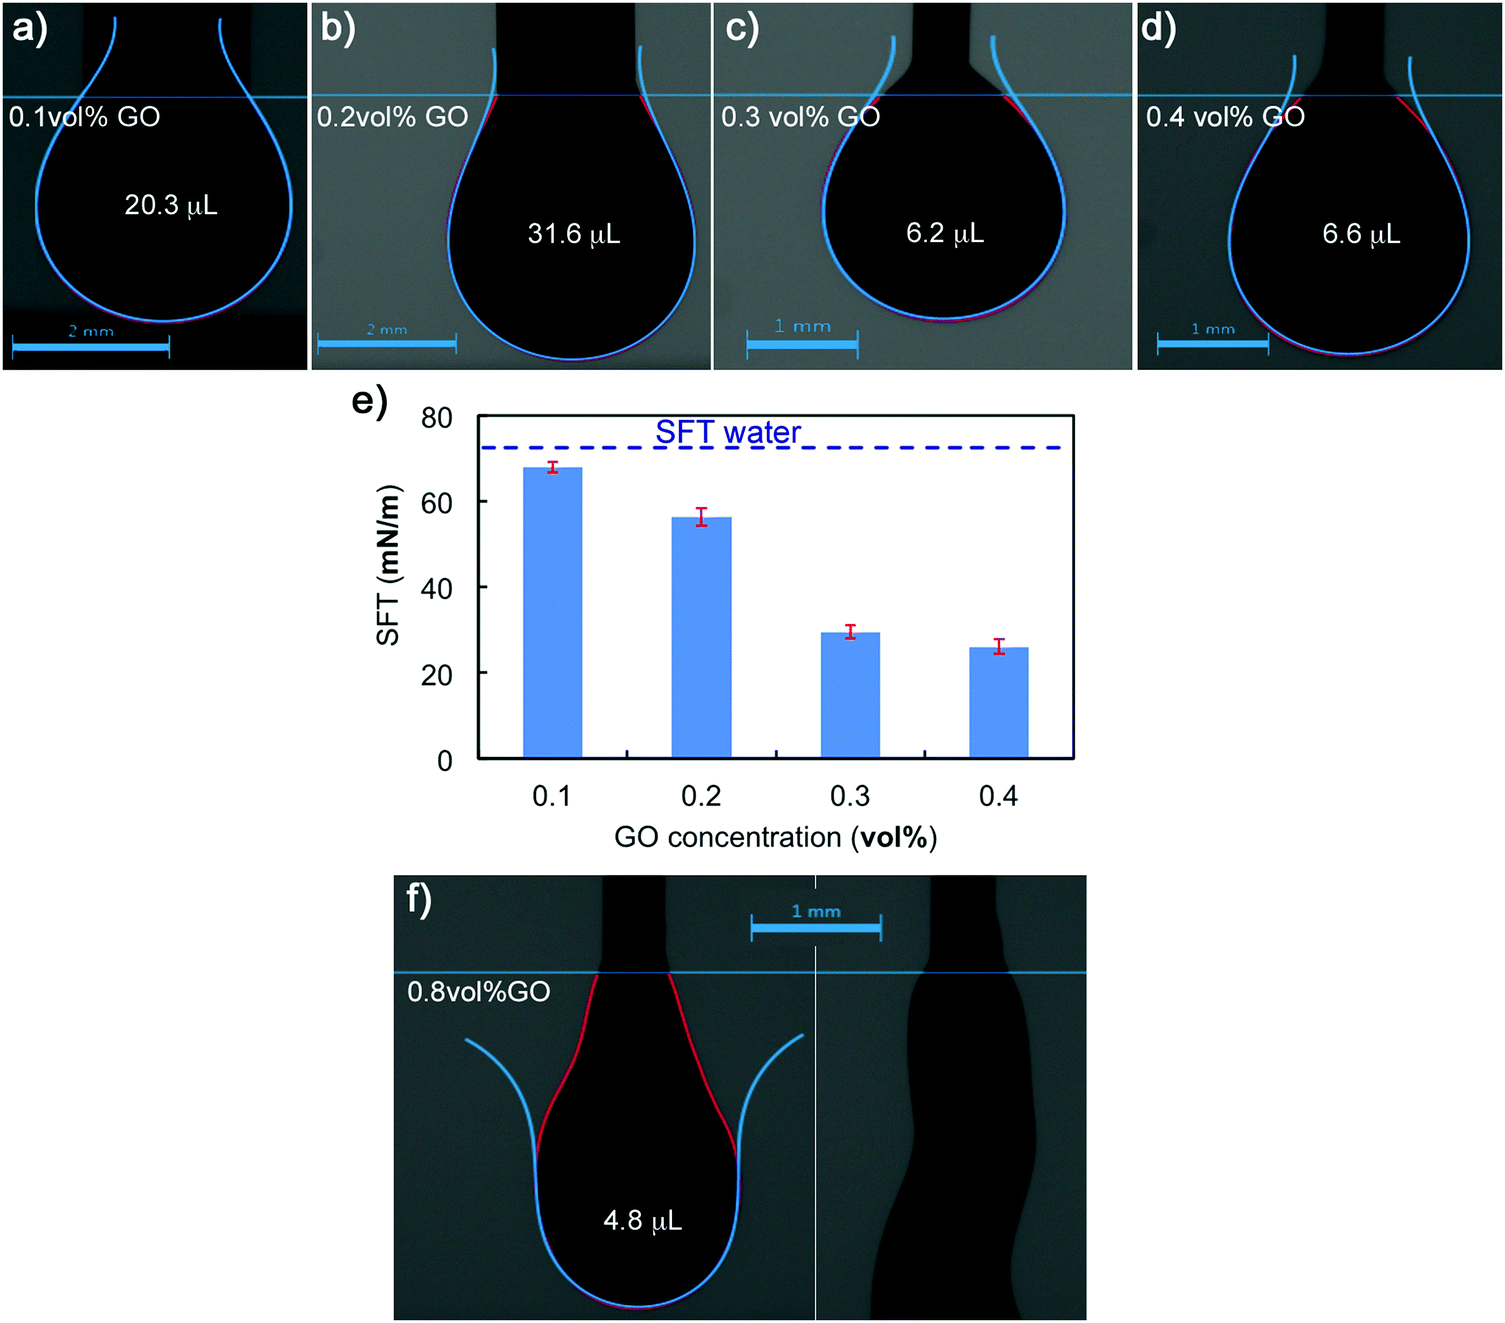 | ||
| Fig. 2 Surface tension (SFT) evolution for GO suspensions with increasing concentrations from 0.1 to 0.8 vol% using the pendant drop method. Images of the droplets measured for different concentrations (a, b, c, d and f). Evolution of the SFT values as concentration increases (e). The 0.1 vol% GO suspension exhibits an SFT value slightly below that of water (72 mN m−1 at 20 °C). SFT values rapidly drop as the GO content increases (e). The increase of a viscoelastic response and gravitational effects impose a limit to carry out the pendant drop test at concentrations above 0.4 vol% when the suspensions start to behave as a soft solid. The bottom image of a 0.8 vol% suspension shows the droplet deformation due to gravity. | ||
Extensional rheology
The standard CaBER analysis assumes a one-dimensional force balance at the location of minimum filament diameter and neglects the effects of gravity and inertia. But the use of this standard technique limits the minimum shear viscosity of fluids that can be tested to approximately ηs = 70 mPa s.32,34 As the viscosities of the GO suspensions at high shear rates are low at the concentrations tested in CaBER (0.05–0.3 vol%), the effect of inertia during the application of the step-strain could not be ignored. In addition GO suspensions with concentrations below 0.2 vol% would not form a stable liquid bridge when using the standard technique and do break during the stretching process. In order to minimize the effect of inertia on these low viscosity fluids we follow the SRM (described in Experimental).The time evolution of liquid bridges formed from GO suspensions with concentrations from 0.05 vol% to 0.30 vol% (Fig. 3) shows a transition from Newtonian-like (0.05 vol%) to shear thinning behaviour (0.2 and 0.3 vol%). At 0.05 vol% the filament becomes an approximately uniaxial straight-walled column immediately prior to breakup (Fig. 3). When effects of gravity and inertia can be ignored, the diameter of a Newtonian fluid undergoing capillary thinning evolves according to the similarity solution of Papageorgiou [eqn (1)];33 where Dmid is the filament diameter at mid-height, σ the surface tension and tc the filament breakup time.
 | (1) |
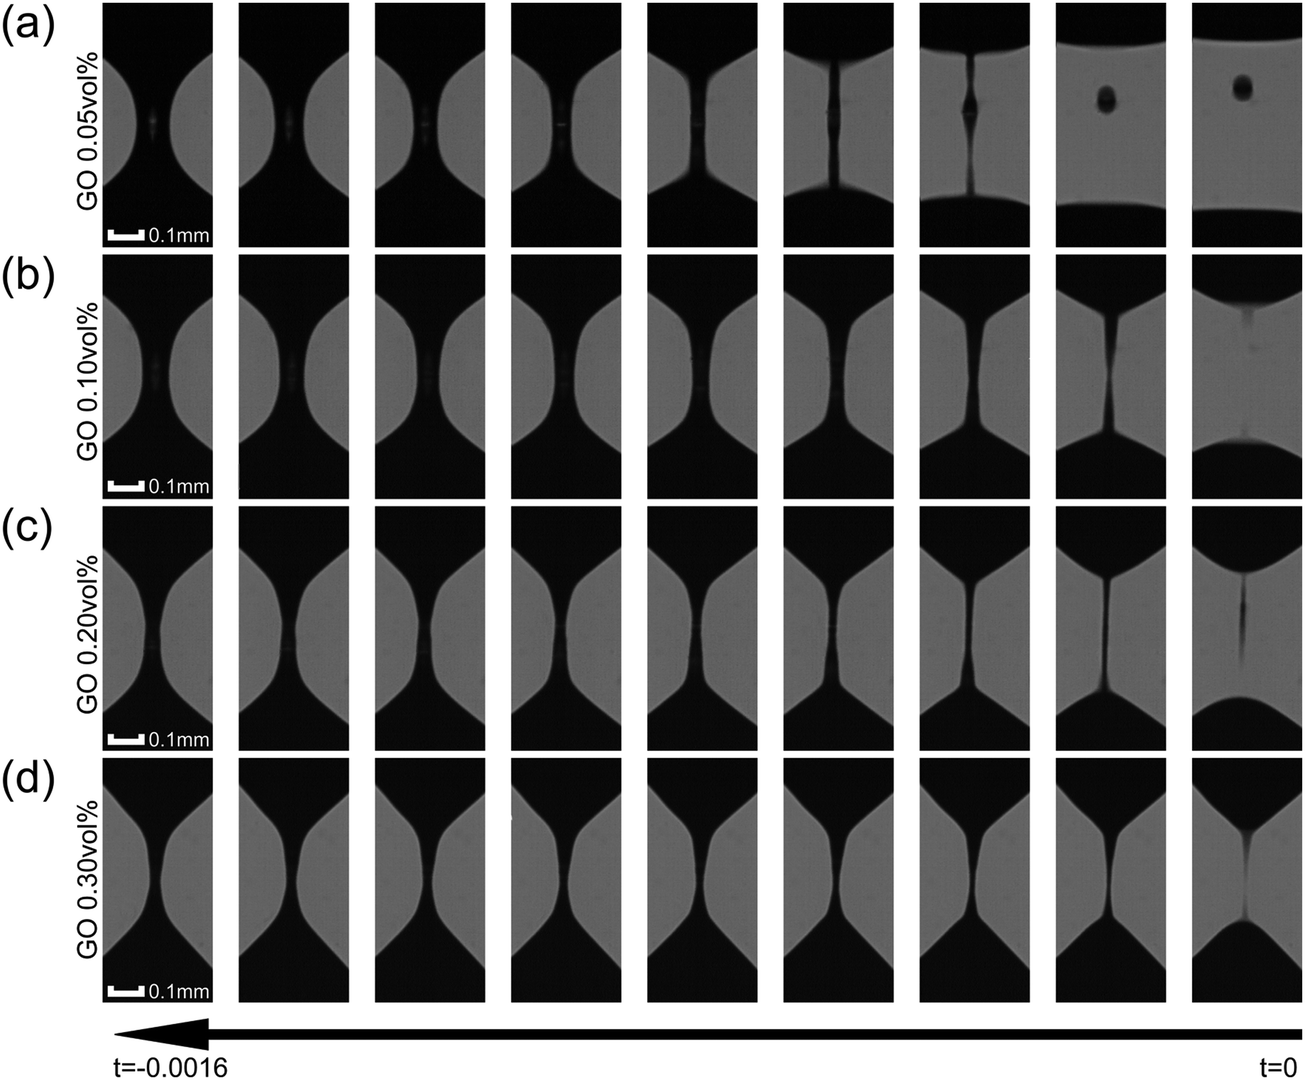 | ||
| Fig. 3 Images of capillary thinning and breakup of the filament for GO suspensions for concentrations between 0.05 vol% and 0.3 vol% tested in the CaBER. The time interval between consecutive images is 0.165 ms. The images show the different behaviours near breakup for different concentrations. At 0.05 vol% GO (a) the filament exhibits a Newtonian-like behaviour. As concentration increases up to 0.4 vol% the filament does not form a straight-walled column immediately prior to breakup and conical tapering becomes evident (b–d). | ||
From the time evolution of the filament diameter at height corresponding to breakup (tracked backwards in time, Fig. 4), we observe that the 0.05 vol% GO solution is linear when near filament breakup, confirming Newtonian-like response to axial elongation [eqn (1)]. At concentrations above 0.05 vol% GO “necking” takes place and a conical taper forms near the breakpoint prior to filament breakup (Fig. 3). For 0.2 and 0.3 vol% concentrations, the time evolution of the filament diameter seems to follow a power law [eqn (2)];34,35 where Φ(n) is a numerical constant, K is the consistency factor and n is the power law exponent.
 | (2) |
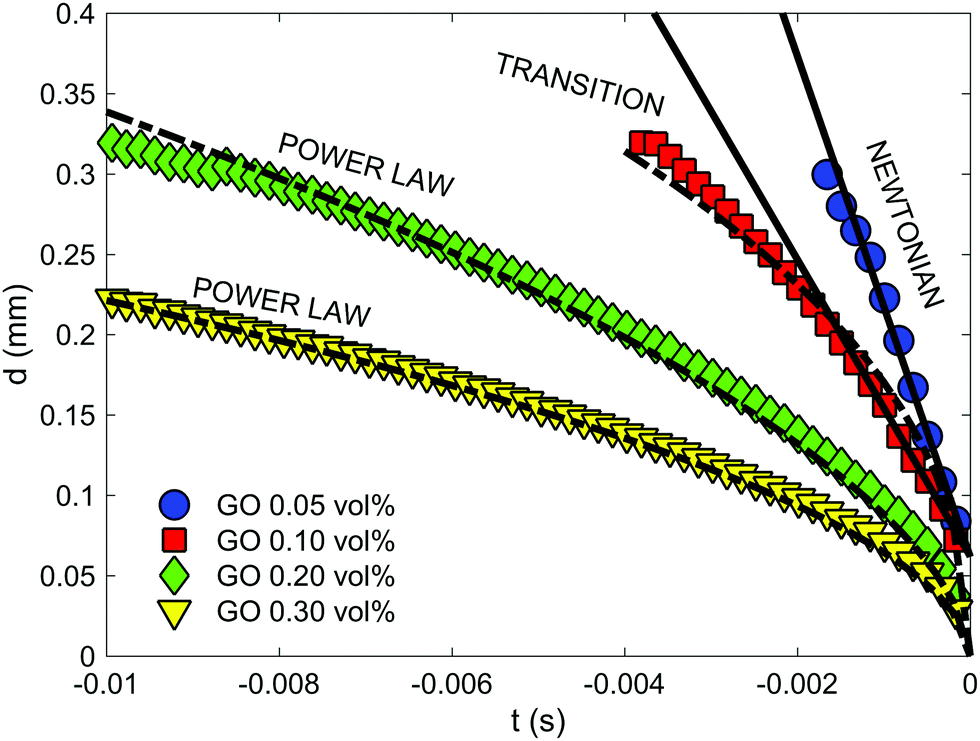 | ||
| Fig. 4 CaBER results: time evolution of filament diameter at height corresponding to breakup (where t = 0 is the breakup time). Each symbol represents a different concentration and each plotted profile is the average of 5 independent measurements per concentration. Data at low concentrations seem to fit to the viscous regime (eqn (1)). At 0.1 vol% there is a transition with a behaviour that do not fit well either with the viscous regime (eqn (1)) or the power law (eqn (2)). Concentrations of 0.3 and 0.4 vol% fit well to power law (eqn (2)) with n values of 0.585 and 0.535 respectively. | ||
However, at a concentration of 0.1 vol% GO, the time evolution of the filament diameter is not well described by a power law (Fig. 4) and perhaps a better fit to the data is a linear fit for t > −0.0015 s, which suggests Newtonian-like response very near to filament breakup at this concentration. This is highly likely related to the migration of GO flakes from the ‘neck’, as they are not forming a continuous network in the suspension. Using the front factor14,30,33,36,37 and assuming that the surface tension is equal to that of water (σ = 72 mN m−1 at 20 °C) the slope of the linear fits to the data in Fig. 4a and b yields viscosity values of μs ≈ 33 mPa s and μs ≈ 63 mPa s for GO suspensions with concentrations 0.05 vol% and 0.10 vol%, respectively. At concentrations of 0.2 and 0.3 vol% GO; power law exponents obtained from the data in Fig. 4c and d are n = 0.585 and n = 0.535, respectively.
Whilst the observed trends are consistent, the analyses reveal a significant amount of scatter between repeated runs for a given concentration. This can be explained due to the contribution of different aspects: the 2D nature of GO flakes (large lateral surface but thickness in the nm range) that can roll up, bend and twist forming nano-scrolls; the large lateral size distribution (lateral size varying from ∼10 to 230 μm); as well as potential concentration fluctuations due to the observed flake migration within the filaments close to breakup. Despite these uncertainties, extensional tests provide new insights into the behaviour of 2D colloids at very low concentrations and contribute to better understand structural evolution and network formation. The extensional results reveal that the behaviour of GO colloids are also highly concentration dependent at very low concentrations, with Newtonian-like response at a concentration of 0.05 vol% and the emergence of shear-thinning-like behaviour at concentrations as low as 0.20 vol%. At higher concentrations yield stress effects complicate the analysis of CaBER data still further.35,38 In fact, samples of GO with concentration higher than 0.3 vol% could not be consistently loaded into the CaBER device using a pipette as the samples would not form straight walled cylinders under their own surface tension prior to initiation of breakup. This leads to inconsistent results due to differences in the initial sample volumes. Further work is required to develop more consistent protocols when using CaBER to materials exhibiting significant yield stress behaviour such as GO at printable concentrations.
Shear rheology
Viscosity curves with small uncertainties (Fig. 5a) confirm the strong relationship between the concentration of GO flakes and network formation in the suspension and as a result in their rheological parameters (μ0 and power law exponent, Fig. 6a). The zero-shear-viscosity values, μ0, were determined as the average of the plateau at low shear (Fig. 5a, only steady state values between 0.015 and 0.025 s−1 were considered), and the power law exponent was calculated fitting the data between 0.03 and 100 s−1.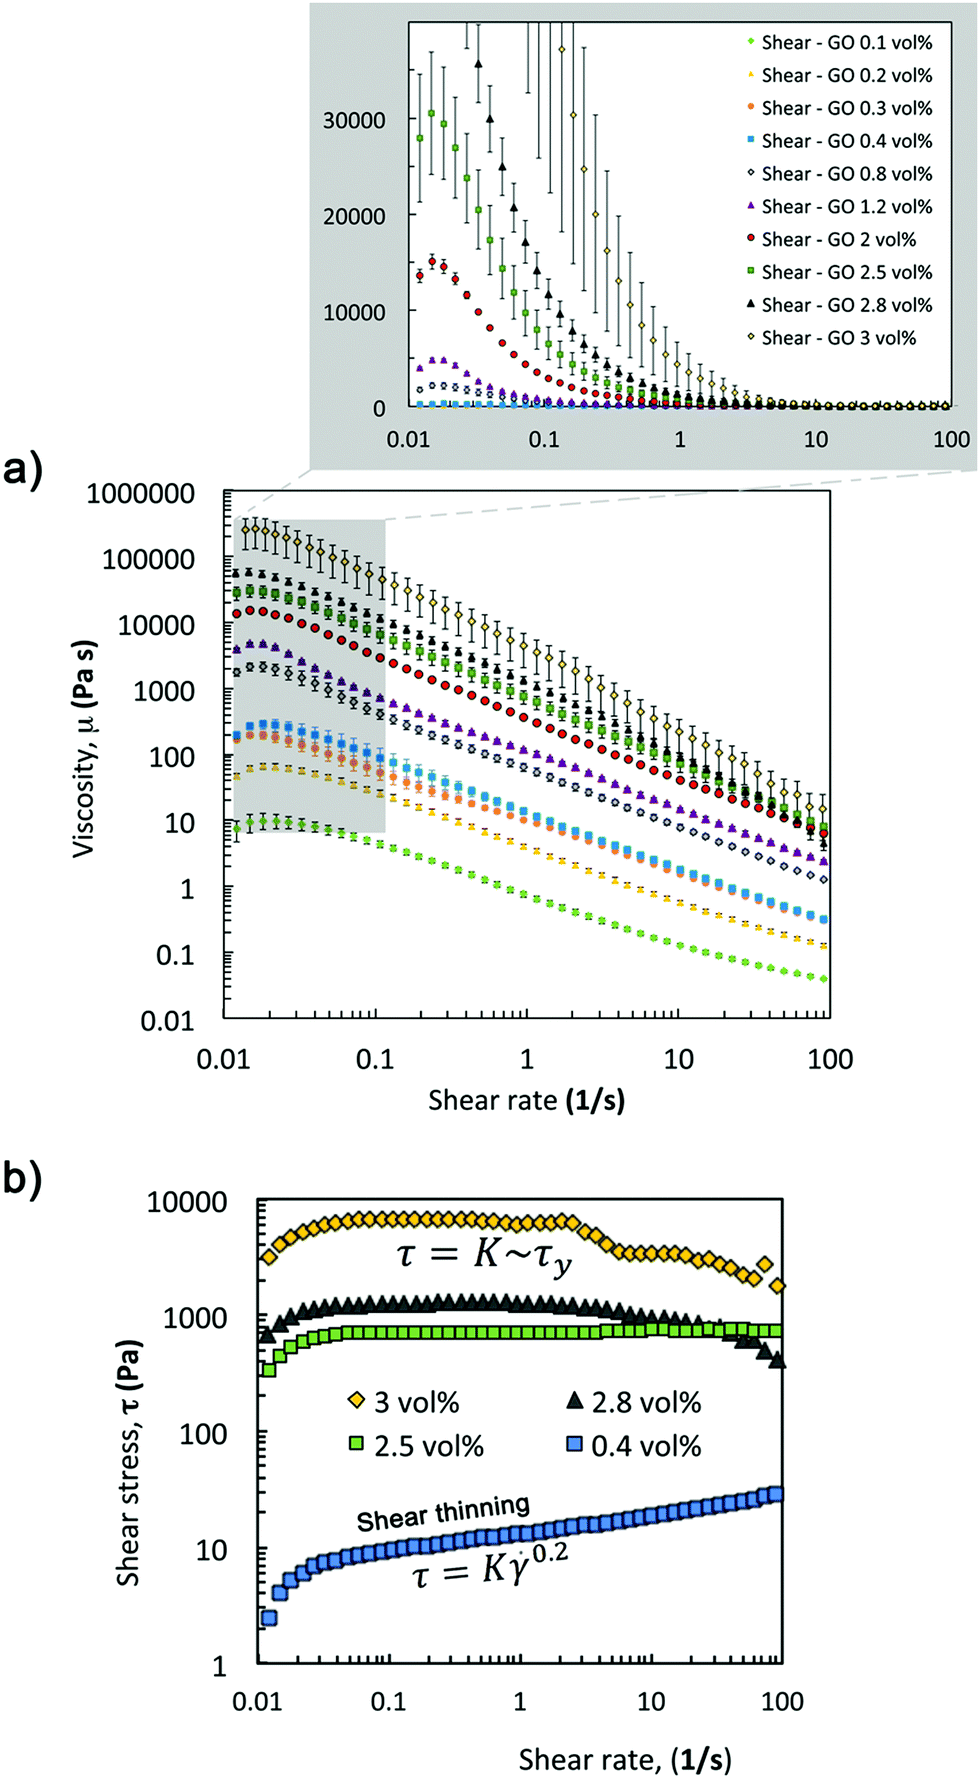 | ||
Fig. 5 Shear rheology: (a) viscosity curves for GO suspensions with increasing concentrations from 0.1 to 3 vol% GO. The flow ramps were performed under shear-rate control in a TA ARES G2. The curves show an initial plateau followed by a shear-thinning region that can be fitted to a power law. Transient effects (i.e. steady-state conditions not reached during limited time used in current protocol) are identified at low shear (first point in each curve). (b) The shear stress vs. shear rate graph shows a transition from power-law behaviour (for example 0.4 vol%, τ = K![[small gamma, Greek, dot above]](https://www.rsc.org/images/entities/i_char_e0a2.gif) 0.2) to a regime for the printable concentrations in which the shear stress does not depend on the shear rate (at 2.5, 2.8 and 3 vol%, τ = K ∼ τy). At 3 vol% transient effects are also identified at shear rates above 1 Pa, likely due to the shear stress being below the yield stress. For this sample, the data above 1 s−1 have not been considered in the analyses. 0.2) to a regime for the printable concentrations in which the shear stress does not depend on the shear rate (at 2.5, 2.8 and 3 vol%, τ = K ∼ τy). At 3 vol% transient effects are also identified at shear rates above 1 Pa, likely due to the shear stress being below the yield stress. For this sample, the data above 1 s−1 have not been considered in the analyses. | ||
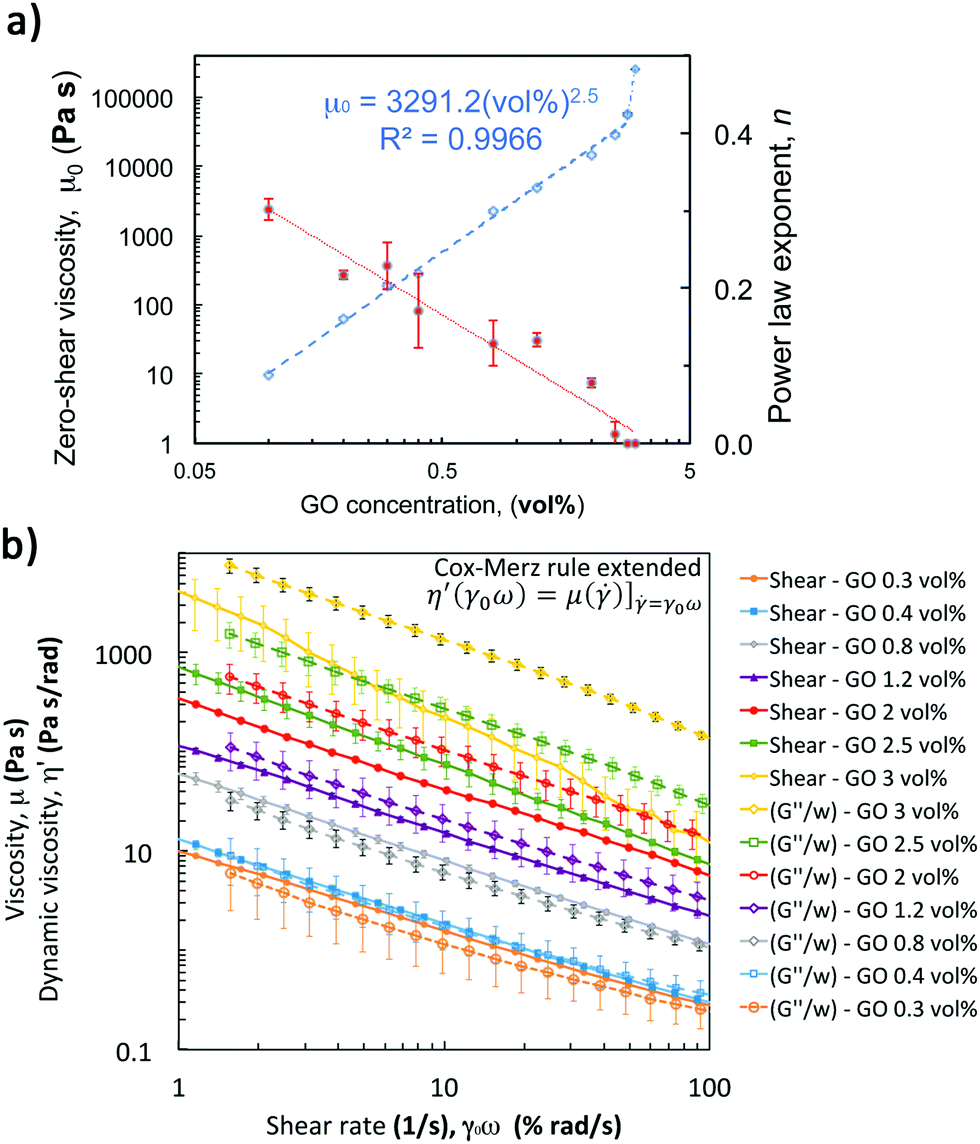 | ||
| Fig. 6 Shear rheology of GO suspensions: (a) effect of flake concentration on zero-shear viscosity and flow index (calculated from viscosity curves in Fig. 5). Zero shear viscosity (determined as the average in the plateau at low shear) increases with GO vol% following a power with an exponent of ∼2.5. At 3 vol% there is a remarkable change of trend that has not been considered for the fit. The flow index, n, is calculated fitting the data within the shear-thinning region (between 0.1 < < 100 s−1) in the viscosity curve to a power law (calculating n − 1 as the slope in the log–log plot (Fig. 5a)). The index gets closer to 0 as the concentration increases. (b) Shear viscosity curves compared with the results of the extended Cox-Merz rule applied to dynamic data from frequency sweeps. The data show that this rule can be applied to concentrations between 0.3 and 1.2 vol% over this shear rate range, but not for higher concentrations. | ||
Fitting these zero-shear-viscosity values vs. GO content to a power-law confirms that μ0 does indeed increase with concentrations up to 2.8 vol% following a power law with an exponent of ∼2.5 (Fig. 6a). This exponent is in good agreement with the trend observed for storage modulus, G′, and yield stress, σy, that follow a power law with an exponent between 2.5 and 2.9 according to the literature14,26,30,36,37 and to the new oscillatory results in this work. From the viscosity curves (Fig. 5a) we find that a 0.1 vol% GO suspension has a slightly shear-thinning behaviour with shear zero viscosity of 9.62 ± 0.05 Pa s and power law exponent n of 0.302 ± 0.014 (Fig. 6a, obtained from the fit of the shear thinning region and calculating n − 1 from the log–log plot in Fig. 5a). According to extensional tests this concentration falls within the transition region from Newtonian-like to non-Newtonian. As the GO concentration increases from 0.1 vol% to 2 vol% the exponent n decreases down to 0.012 ± 0.006, and n approaches to essentially zero at 2.5, 2.8 and 3 vol% GO (Fig. 6a), demonstrating the evolution towards an intensely shear-thinning ‘stiff’ material and more yield-stress-fluid-like behaviour.
We found that at ‘printable’ concentrations (2.5, 2.8 and 3 vol%) the stress becomes essentially independent of the shear rate. Plotting the evolution of shear stress with shear rate (Fig. 5b) it is possible to identify the transition from a power law behaviour (τ ∼ Kn) to a regime where the stress is constant (τ ∼ K ∼ τy). At concentrations of 3 vol% GO, there is a sharp change in the observed trend; μ0 increases up to values in the order of 250 kPa and does not follow the same power-law exponent (Fig. 6a). At this concentration, transient effects take place at shear rates above 1 s−1 (Fig. 5a) likely due to the high stiffness and brittle response of the sample, and as a consequence, the data in this shear rate region have not been considered in our analysis.
Overall, we find that shear tests complement the results obtained with extensional and surface tension experiments to qualitatively understand network formation and the transition to non-Newtonian behaviour at low concentrations. The flow ramps can also be used to quantify the zero-shear viscosity and power-law exponent at intermediate concentrations between 0.4 vol% and 2 vol%. As we reach the printability window (between 2 and 3 vol% GO) shear tests become more uncertain for quantitative purposes, however these tests provide useful insights to identify the ‘printability’ threshold, i.e. the transition from a power-law behaviour to a regime where n ∼ 0 and the shear stress is therefore independent of the shear rate. Transient effects at low shear (Fig. 5a) may slightly underestimate the zero-shear viscosity. Steady state flow sweeps would be more appropriate to avoid these transient effects, however, further studies at low shear rates are beyond the scope of this work.
Oscillatory rheology
Performing a combination of SAOS and LAOS experiments on GO suspensions with concentrations above 0.4 vol% enable us to reliably identify and quantify the structural changes during aggregation and breakdown, and to approximately replicate some of the structural changes during the printing process. A 5-step oscillatory sequence (Fig. 7a) illustrates the stability and structure evolution, and it enables us to determine if the materials undergo any ‘history’ effects. The initial time sweep (fixed strain 0.5%, and frequency 0.5 Hz) is used to quantify the initial structure (G0) at different concentrations. Comparing these initial values with the values at the end of the experiments (Gend′) we quantify the bulk recovery of the structure (Fig. 7). The responses of GO suspensions with concentrations of 0.1 and 0.2 vol% under this 5-step sequence, provide similar results with large uncertainty and are therefore not considered in the following analysis. This is due to the transition stage from Newtonian-like to a weak viscoelastic fluid (around 0.1 vol% as concluded from the extensional tests in CaBER and the surface tensions measurements), and coupled with equipment/protocol limitations. Beyond these concentrations, a similar structure evolution is observed for suspensions with concentrations between 0.3 and 3 vol% (Fig. 7b): they are initially stable during the first time sweep (fixed Hz, %); in the second step both moduli consistently increase with frequency; then recover their initial structure during the second time sweep (fixed Hz, %); the amplitude sweep shows the ‘yielding’ or network break-down as the strain increases (similarly to the structure changes during printing); and the last step (time sweep, fixed Hz, %) indicates to what extent the network recovers, which varies depending on the concentration (Fig. 7c).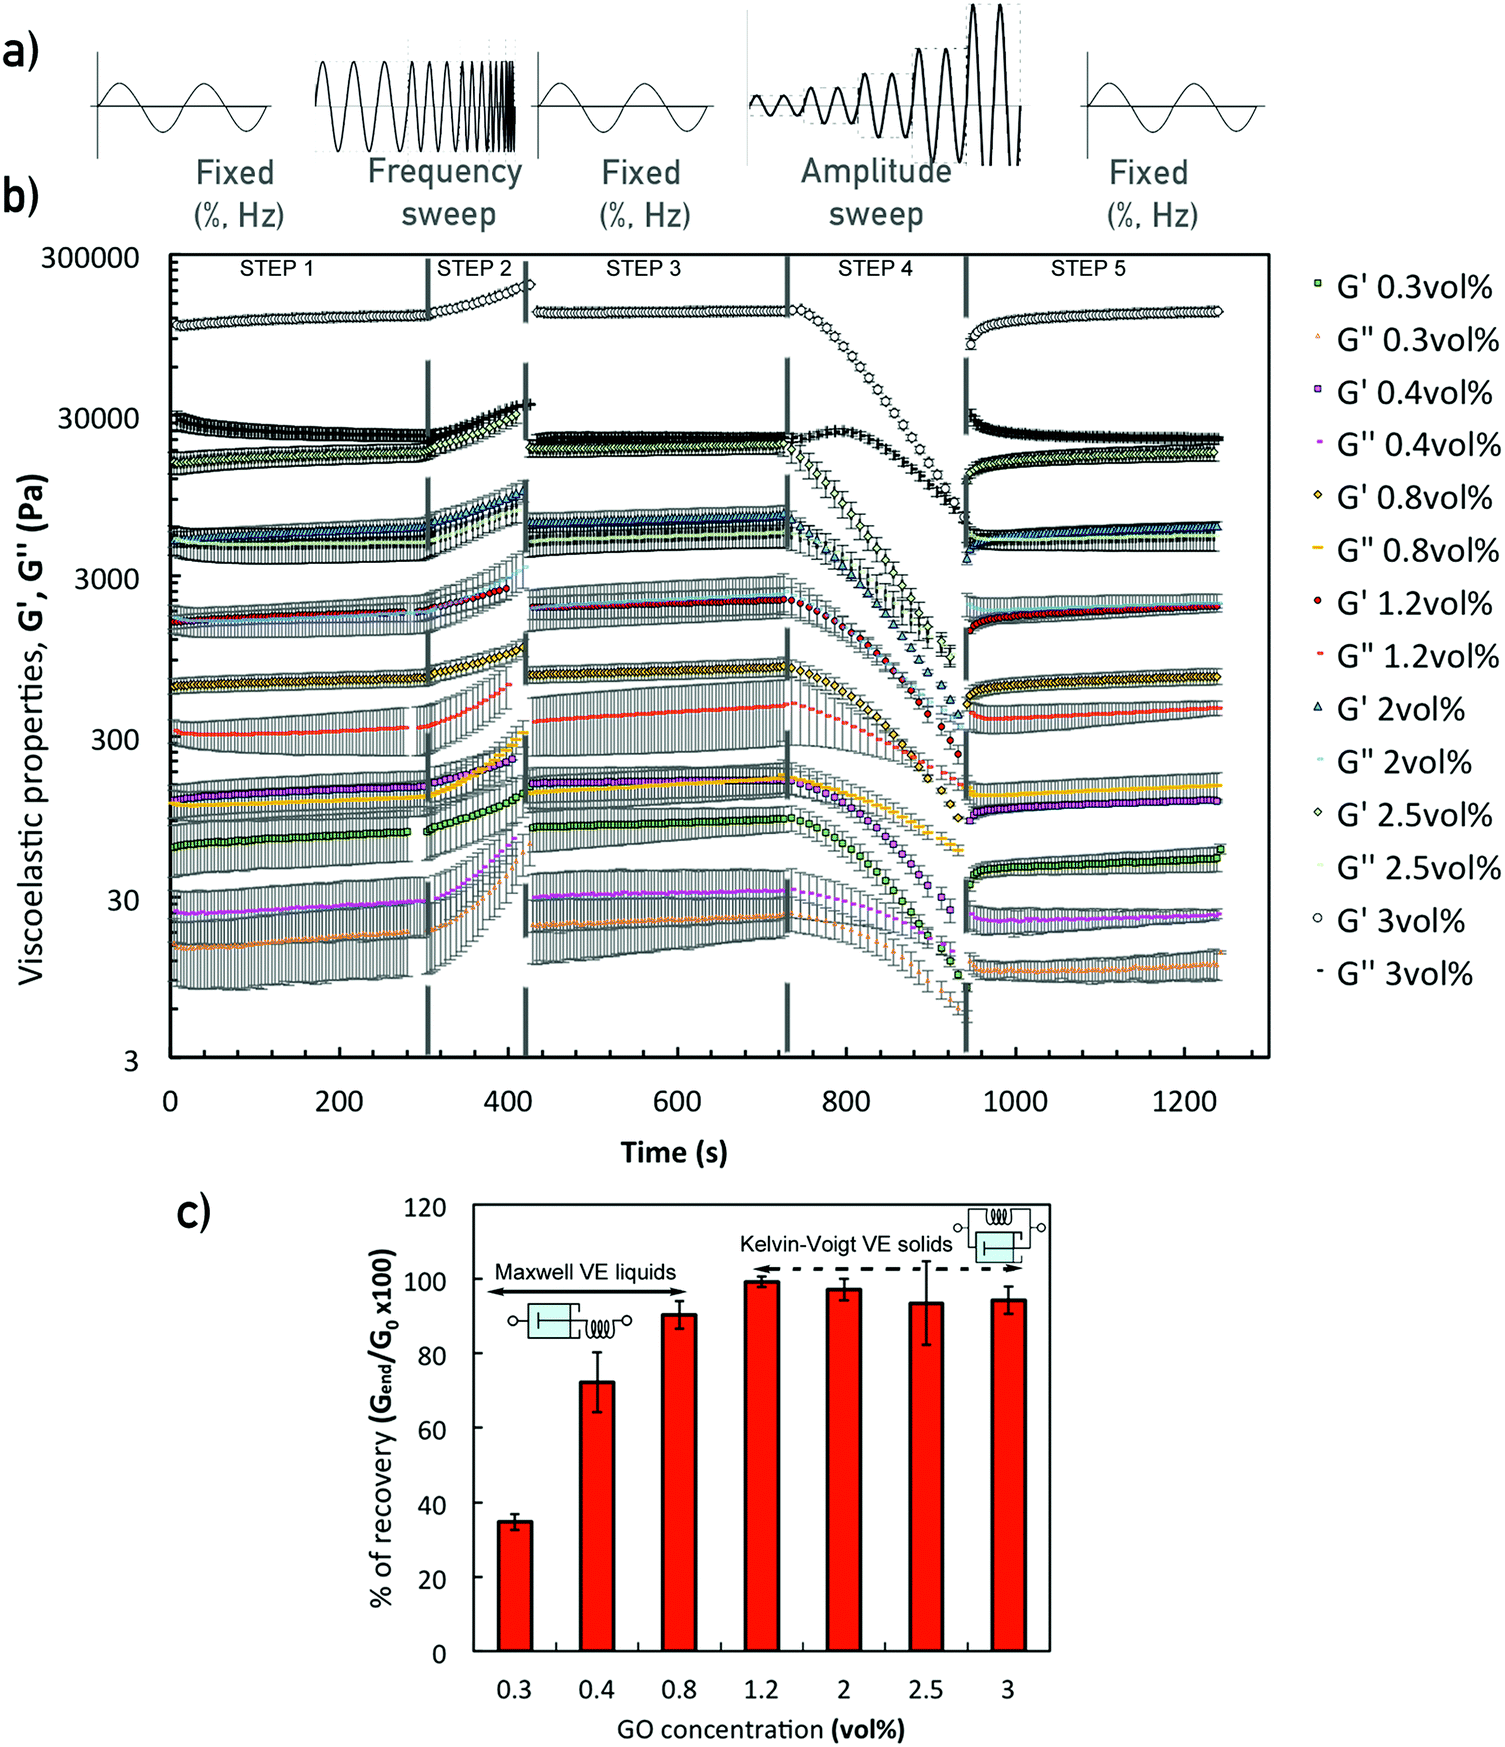 | ||
| Fig. 7 Oscillatory rheology of GO suspensions. (a) Sine waves illustrating the sequence of oscillatory stimuli applied on the samples (from left to right: time sweep (0.5%, 0.5 Hz); frequency sweep (0.5%); time sweep (0.5%, 0.5 Hz); amplitude sweep (0.5%) and time sweep (0.5%, 0.5 Hz)). (b) 5-step structure evolution for GO suspensions with concentrations between 0.3 and 3 vol%; and (c) effect of concentration on recovery behaviour. As the concentration increases the behaviour shifts from a viscoelastic liquid that undergoes permanent deformation (Maxwell liquids at concentrations from 0.3 vol% to 0.8 vol%) to viscoelastic solids (Kelvin–Voigt) that recover their stiffness upon cessation of the stimulus. Error bars were calculated as the standard deviation among three repeats for each test performed. | ||
From the second step in the sequence, it is possible to determine if the oscillatory data for formulations of 2D GO colloids can be used to approximate the flow behaviour or vice versa. Applying the extended Cox–Merz rule (Rutgers–Delaware, eqn (3))14,38 to dynamic data (frequency sweeps, step 2, fixed strain 0.5% (Fig. 7b)) suggest that this empirical rule can be reasonably applied to intermediate concentrations, above 0.3 vol% and below 2 vol% (Fig. 6b).
| [η′(γ0ω) = μ()]=γ0ω | (3) |
The transformations (eqn (3)) match reasonably well with the steady state shear results (Fig. 6b) for concentrations within this range. As the concentration increases up to 2 vol% and beyond, as we approach the printable region, the overestimation of the viscosity using dynamic data becomes clear (Fig. 6b). From these results, it seems that the extended Cox–Merz rule can be applied to suspensions of GO colloids at intermediate concentrations.
The concentration of GO flakes has an important effect on the structural recovery after the amplitude sweep (Fig. 7c). At concentrations below 1.2 vol% GO, the networks do not completely recover after breakdown. The percentage of recovery at 0.3 vol% is below ∼50%, at 0.4 vol% around ∼75% and increases up to ∼90% for 0.8 vol% GO, which suggest a Maxwell fluid (viscoelastic liquid) behaviour undergoing permanent deformation.14,26 Beyond these concentrations the recovery of the storage modulus, G′, is almost complete within the experimental uncertainty (Fig. 7c), indicating the transition to a Kelvin–Voigt fluid (viscoelastic solid). From these results, we consider that the threshold for network formation or ‘gel’ point takes place between 0.8 and 1.2 vol% GO.
Overall, this 5-step oscillatory sequence provides a qualitative assessment of formulation stability, structural evolution and recovery; it also enables to identify possible non-linear events taking place.14,39 However, they still have some limitations to quantitatively determine break-down and recovery parameters during step 4 (amplitude sweep) and step 5 (recovery time sweep). The amplitude sweep does not show the linear viscoelastic (LVR) for any of the concentrations, which suggests that the fixed strain, γ0 at 0.5% (selected based on previous work)14 is just at the limit or at the start of the ‘yielding’ region. In addition, some of the formulations do not exhibit a ‘flow’ point (crossover G′ = G′′) below 50% (γmax in step 4). Since some of the networks have not been completely broken down, the recovery calculated from step 5 (Fig. 7b) is not fully accurate because each suspension will be recovering from a different initial condition.
We designed two additional experiments to provide a more reliable quantification of the break-down and rebuild stages: a second amplitude sweep under a wider range of strains (0.01 to 150%), and a ‘recovery’ test (transition from LAOS (150%) to SAOS (0.5%)). By representing the viscoelastic properties (G′ & G′′) versus the oscillation stress in the amplitude sweep (Fig. 8a), the evolution of the yielding region as concentration increases is clear. It is possible to quantify the trend of different rheological parameters: the ‘at rest’ structure (as the average of G′ within the LVR, Fig. 8b); γy and σy (at the limit of the LVR, Fig. 8a and c); γf and σf (at the cross-over point (G′ = G′′), Fig. 8c); and the FTI values (defined in experimental, Fig. 8c). The ‘at rest’ stiffness of the network (GLVR′) follows a power-law relationship (exponent of ∼3) with GO concentrations up to 2.8 vol%, but at 3 vol% there is a remarkable change of trend with GLVR′ values of ∼250 kPa. The flow stress, σf, also increases with a power exponent of ∼2 in the same range, and a similar jump is observed at 3 vol% with σf ∼ 5.3 kPa. The evolution of the yield stress, σy, changes exponentially with the concentration, which leads to FTI values getting closer to ∼10 within the ‘printing region’ (2 < vol% ≤ 3). The FTI evolution seems to be one of the key parameters related with ‘printability’. Below 0.8 vol% the viscoelastic network is very weak with σy and σf below ∼1 Pa and ∼20 Pa respectively (Fig. 8c), and the FTI values do not follow a clear trend. Above the 0.8 vol% threshold, FTI values steadily drop from 100 to 10 at 3 vol% (Fig. 8c), which nicely illustrates the transition from a weak network to a stiff and “brittle” soft material. This parameter is indicative of the ability of the structure to yield, break-down and similarly to rebuild during the printing process.
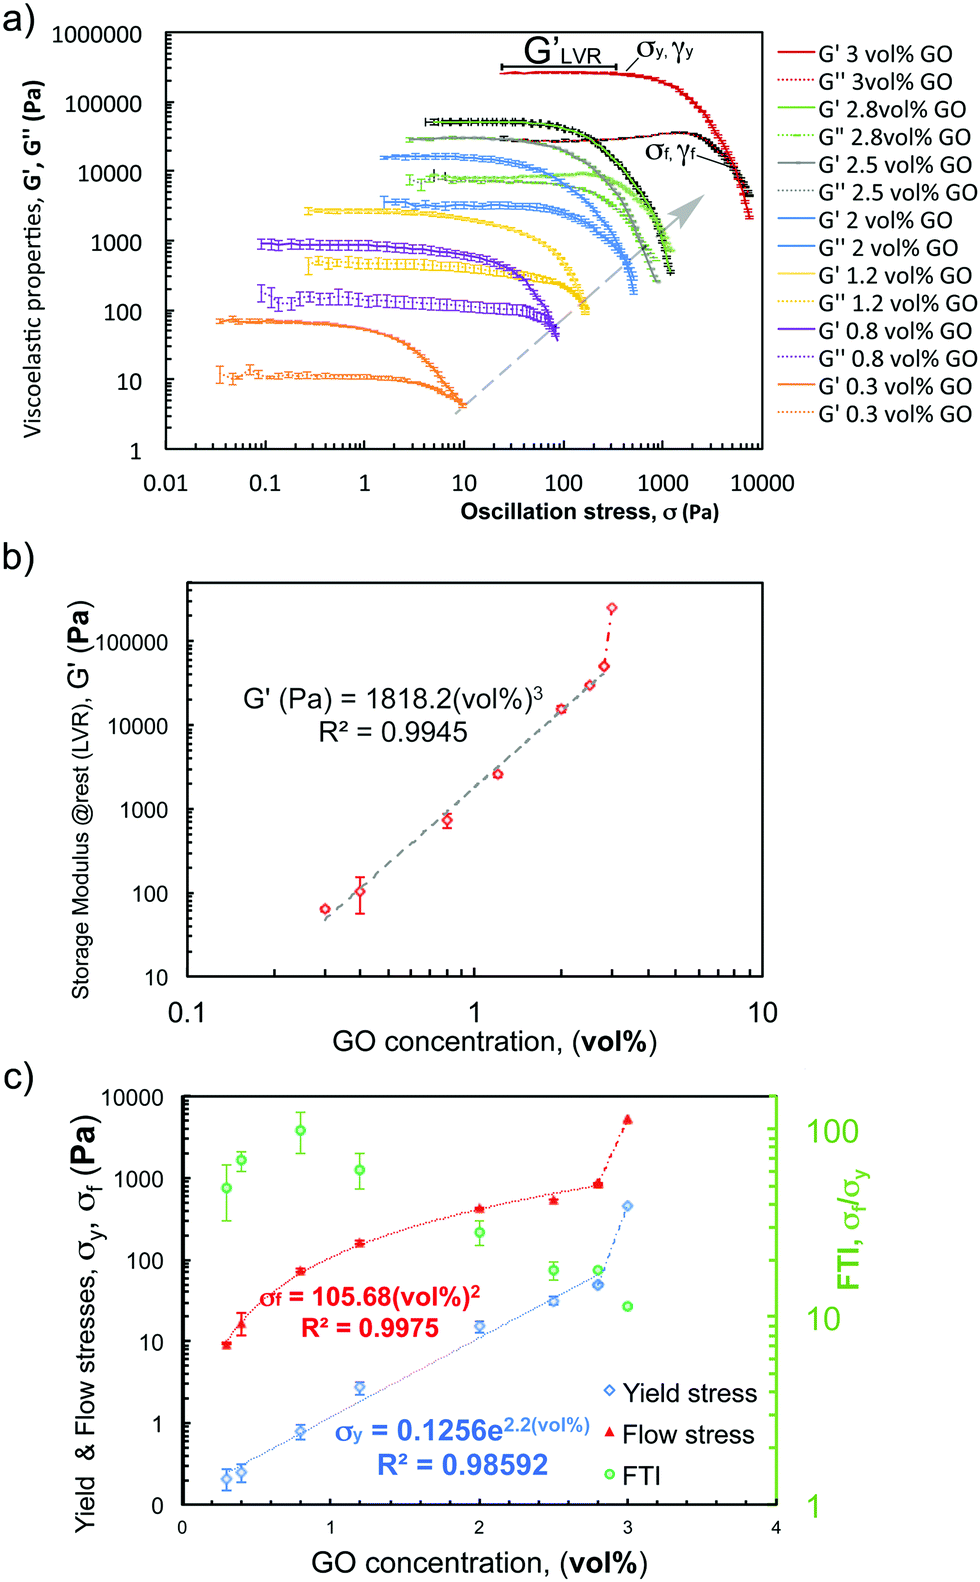 | ||
| Fig. 8 Oscillatory rheology of GO suspensions. (a) Amplitude sweeps showing the LVR and yielding region for GO suspensions with increasing concentrations. G′ (thick lines) and G′′ (dashed lines) are plotted against the oscillation stress to visualise the evolution of the yield stress, σy, and the flow stress, σf, as concentration increases. (b) Stiffness, G′, evolution with GO concentration. Same as the zero-shear viscosity, G′ increases with the power of GO concentration between 0.1 and 2.8 vol%. At 3 vol% a remarkable change of trend is identified. (c) Evolution of yield stress, σy (determined at the limit of LVR: when G′ values start to drop ∼10%), flow stress, σf (calculated as oscillation stress at flow point, G′ = G′′), and Flow Transition Index (FTI, calculated as the ratio σf/σy) with GO concentration. | ||
The transition from LAOS to SAOS in the ‘recovery’ tests enables us to monitor the reformation of the network (Fig. 9 and 10), which is a key aspect to enable the printing of complex structures without compromising resolution. Applying a strain of 150% (LAOS) for at least 3 min ensures that all the samples are liquid-like before monitoring the transition to 0.5% strain (SAOS).
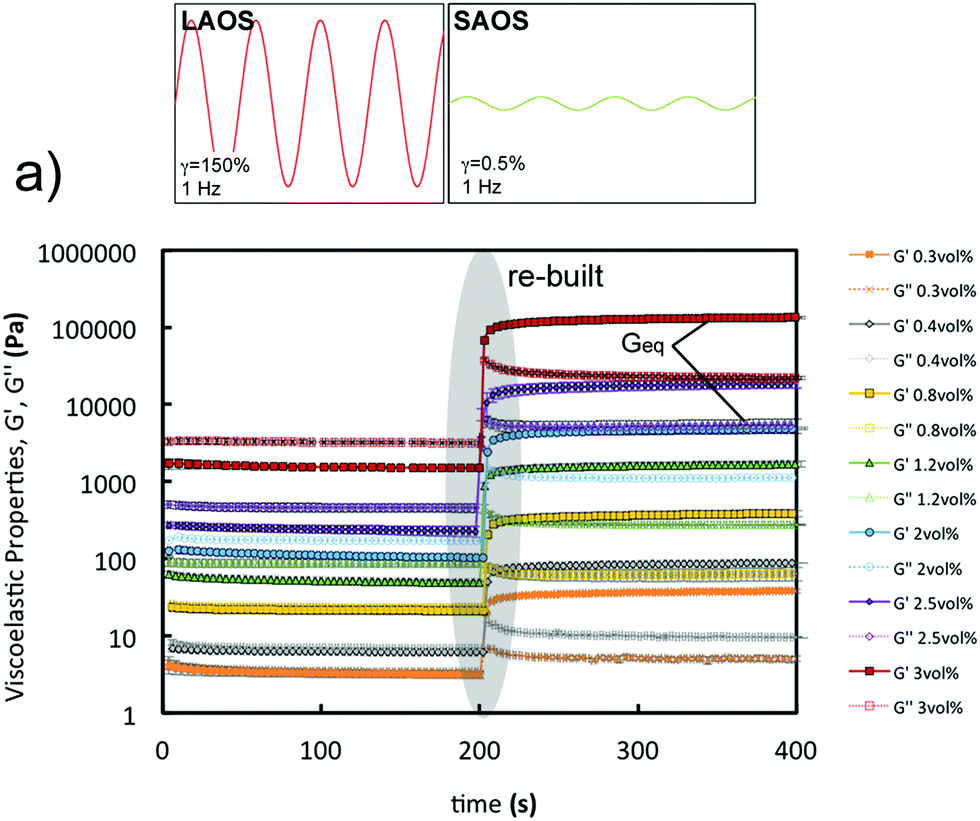 | ||
| Fig. 9 Oscillatory rheology of GO suspensions: recovery behaviour during LAOS-to-SAOS transition. Samples are subjected to a large amplitude (150% strain) time sweep to ensure that they are in the liquid-like regime, followed by a small amplitude (0.5% strain) time sweep. Both fixed at a frequency of 0.5 Hz in a TA ARES G2. The transition region (highlighted in grey) can be divided into three stages each with a different gradient (Fig. 10). | ||
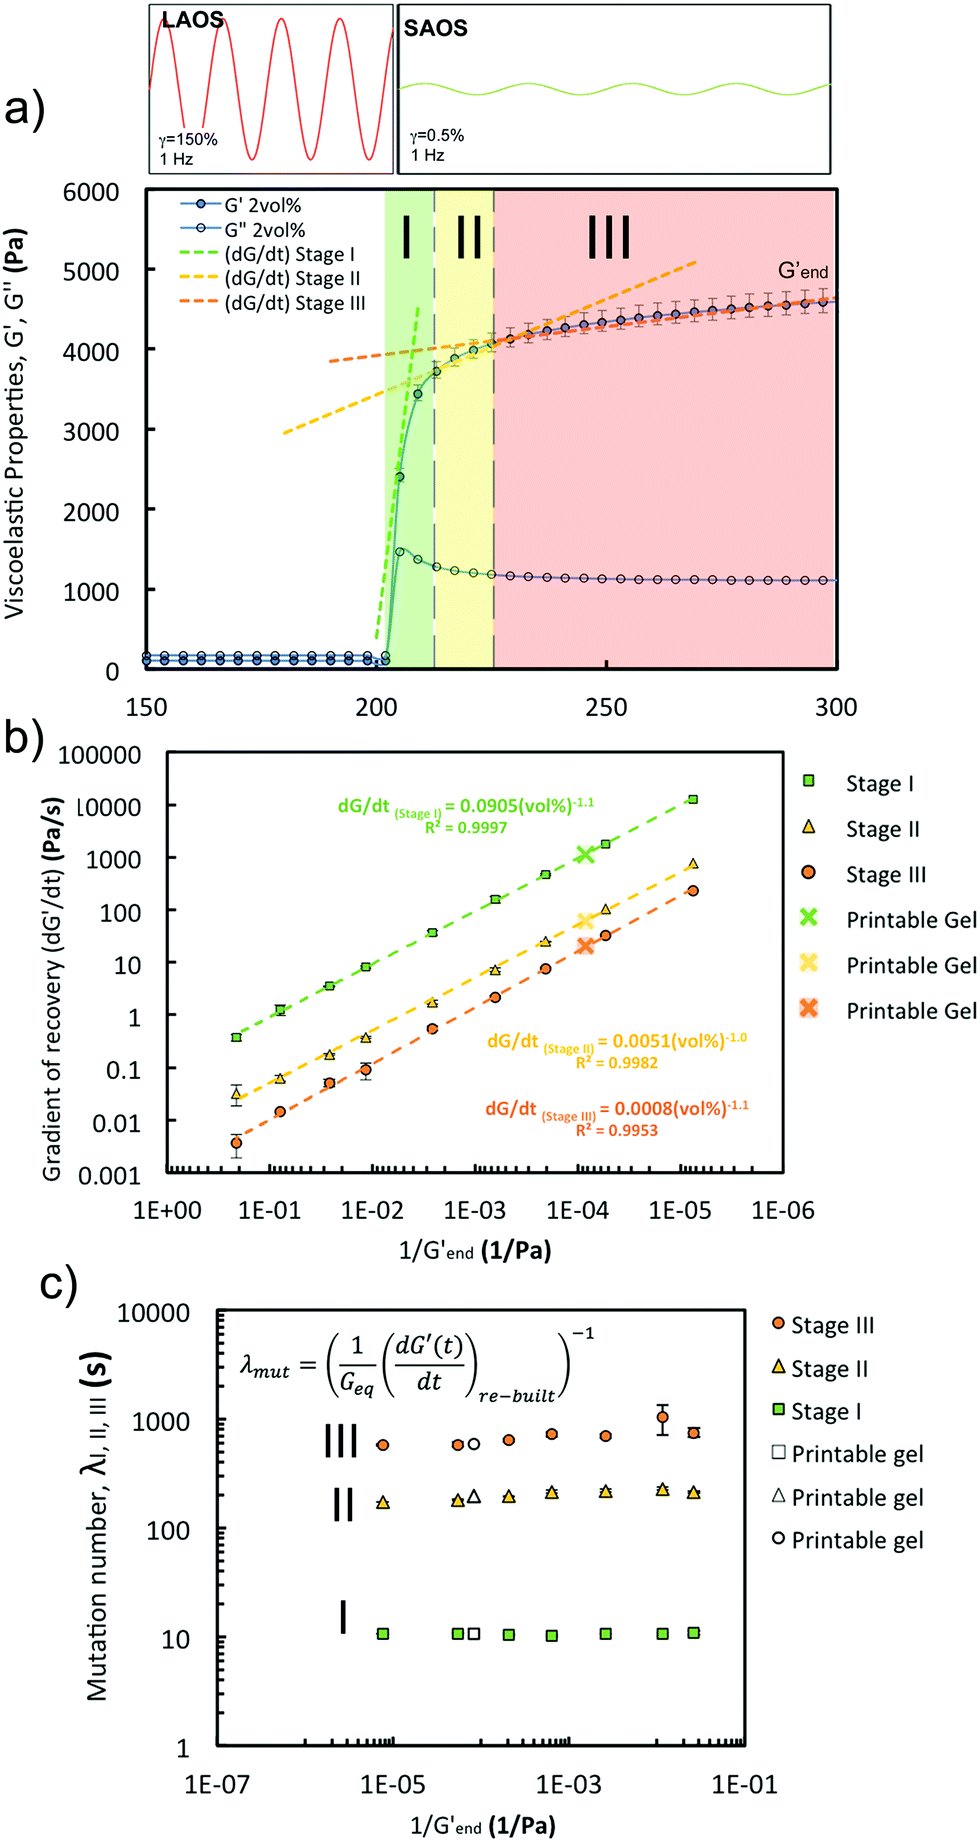 | ||
| Fig. 10 Oscillatory rheology of GO suspensions: (a) ‘Recovery’ curve for the 2 vol% GO suspensions illustrating the different recovery stages (I, II, III) highlighted in the graph and that have been considered to calculate the three (dG′/dt) gradients in (b). The curve shows that the main recovery takes place in stage I. The three gradients (b) exhibit a power relationship with 1/Gend′ (G′ varies with a power of GO concentration (Fig. 8)). (c) The mutation numbers for stages I, II, III calculated using [eqn (4)] (in the inset) are ∼ constant for the three stages and do not vary with concentration. These parameters demonstrate the proportionality between the ‘rebuilt’ kinetics (dG′/dt) and the stiffness of the network (G′) for GO suspensions. | ||
GO suspensions with low concentrations show permanent deformation, behaving as a viscoelastic liquid (i.e. Maxwell model); at 0.8 vol% GO and above there is no permanent deformation, these GO networks behave as a viscoelastic solid (i.e. a Kelvin–Voigt model). The change of G′ and G′′ over time during the SAOS test suggests that all the samples recover their stiffness in a similar fashion: a ‘quick’ and steep initial recovery G′ (stage I), followed by a slower increase of viscoelastic properties (stage II) that then leads to a plateau region (stage III) (Fig. 9). A characteristic gradient (dG′/dt, Fig. 10a) for each stage of the ‘rebuild’ can be calculated from the G′ vs. time curves (Fig. 9). Each of the gradients increases with the power of the GO concentration (vol%), or alternatively with the inverse of the storage modulus, Gend′ (Fig. 10b) which also increases with GO concentration following a power law (exponent of ∼3, Fig. 8b). The magnitude and timescale of the structural recovery in stage I is key to facilitate ‘printability’. We define a ‘mutation number’ for each stage to quantify both (stiffness and reformation time).39 The ‘mutation number’, λ(s) (eqn (4)), scales the magnitude of these gradients with the stiffness (Gend′) of the network.
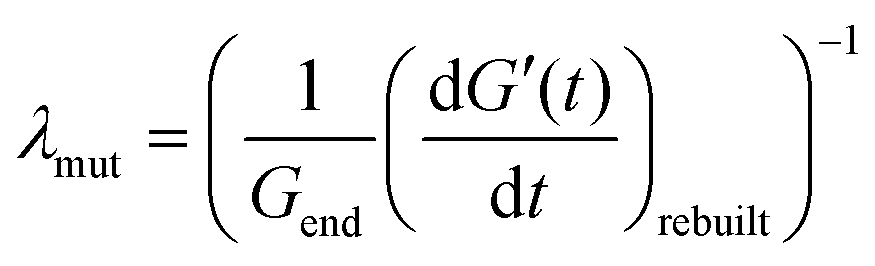 | (4) |
Due to the relationship between the kinetics of the recovery (dG′/dt) with the stiffness of the networks (Gend′), the mutation numbers for the three stages, λ1, λ2 and λ3 (with values of ∼10 s, ∼200 s and ∼1000 s respectively), do not depend on GO concentration (i.e. with 1/Gend′, Fig. 10c). This is also true for a different gel formulation used for comparative purposes (Fig. 10c). According to our results, the main rheological parameter that quantifies the ‘rebuilt’ is G′. This means that given a formulation, it is possible to determine its ‘printability’ just from an amplitude sweep, using a quantitative criterion based on the GLVR′ value, the flow stress and the FTI. We can then use these parameters to build a ‘printability’ map for our GO formulations and define a quantitative window (Fig. 11): ‘stiffness’ (GLVR′) at rest is at least of the order of ∼10 kPa and FTI approaches values of ∼20 or below, which correspond to at least σf of 500 Pa and a GLVR′/σf ratio of 20. Perhaps somewhat surprisingly, these findings confirm that current paste-specific ‘printability’ criteria that rely only on simple G′ and ‘yield stress’ determination2,5,6,9,11,40–42 (the latter defined as flow stress, σf, here) are a valid approach.
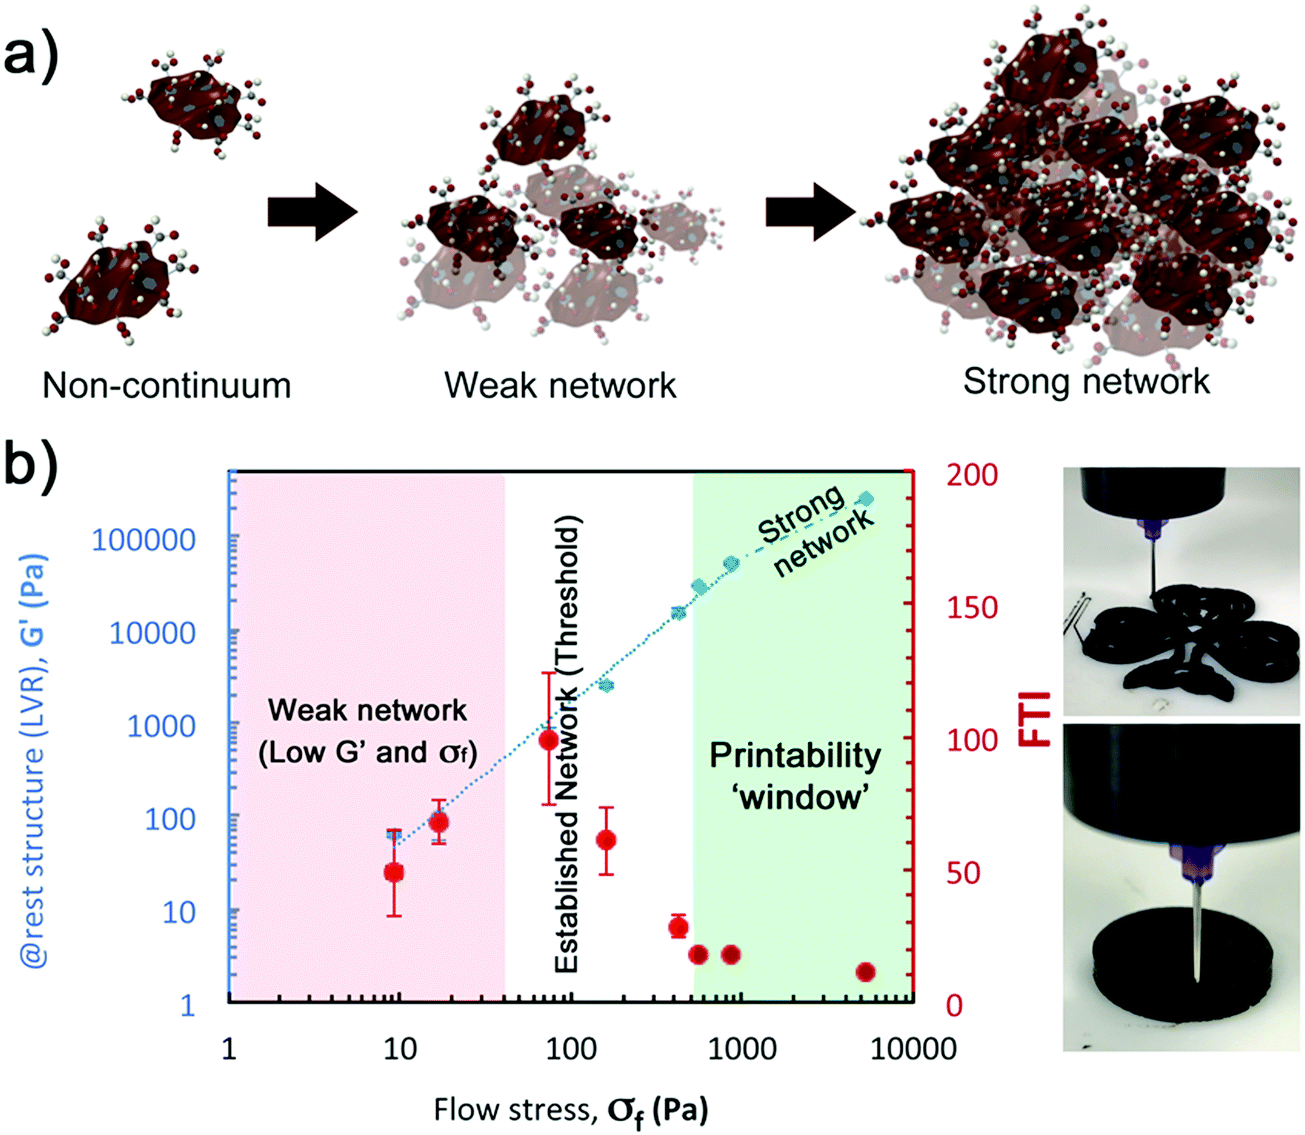 | ||
| Fig. 11 ‘Printability’ map for GO suspensions including three key rheology parameters: @rest structure or network stiffness (GLVR′), flow stress, σf (calculated as the oscillation stress at the crossover point, when G′ = G′′), and flow transition index FTI (the ratio between the flow stress and the yield stress, σf/σy). The stiffness (GLVR′) of the GO networks increase as σf increases following a power relationship up to 2.8 vol%. The trend changes abruptly at 3 vol%. At concentrations below 0.8 vol% the network across flakes is weak, resulting in very small values of σf and G′, in this range FTI values do not display a clear trend. From 0.8 vol%, considered as the ‘network threshold’, the FTI clearly decreases revealing the ‘brittle’ character of the networks. Printable concentrations, between 2 vol% and 3 vol%, exhibit an FTI value <20 with small uncertainties and a G′/σf ratio ≥20. | ||
Conclusions
The 2D nature of GO colloidal suspensions provides a unique library of soft materials with fascinating rheological behaviour from Newtonian-like behaviour to printable viscoelastic solids. This in-depth rheological study combining extensional, shear and oscillatory rheology and surface tension measurements provides new insights on GO network formation and ‘printability’. Extensional results show that the transition from Newtonian like response to shear-thinning behaviour takes place at as small concentrations as 0.1 vol%, resulting in weak networks up to concentrations of 0.4 vol%. Above 0.4 vol%, GO flakes in water exhibit a wide range of behaviours from viscoelastic liquids to solids. Surface tension and rotational rheology results reveal that a well-established network is formed at about 0.8 vol%. At this point surface tension cannot be determined due to the yield stress behaviour. Shear tests provide reliable and quantitative results for viscoelastic liquids at concentrations between 0.1 and 0.8 vol% GO. The extended Cox–Merz rule to correlate dynamic data with flow can be used within this concentration range. Above 0.8 vol% the shear tests here performed show more variability, and the extended Cox–Merz rule can no longer be applied. We found that a combination of oscillatory tests is a reliable and robust approach to quantify the response of viscoelastic solid-like networks of GO. The analysis of a 5-step oscillatory sequence, amplitude sweeps and a LAOS-to-SAOS ‘recovery’ test reveals that the main rheological parameters to quantify the ‘printability’ of a formulation are the stiffness GLVR′, the flow stress, σf (crossover point G′ = G′′), and the flow transition index, FTI (σf/σy). Using these parameters, we can define a quantitative printing window for GO pastes at concentrations between 2 and 3 vol%. A modified 6-step oscillatory sequence with a wider amplitude sweep in step 4 (i.e. from ∼0.01 to 150% strain) combined with a variation of the recovery test (step 5 (LAOS time sweep at fixed 150% strain for 3 min), and step 6 (10 min SAOS time sweep at the minimum strain in step 4, ∼0.01% strain)) would provide a full characterisation of these rheological parameters. The proposed protocols and the analyses performed here pave the way to the establishment of common protocols to quantify and predict ‘printability’ of soft materials.Conflicts of interest
There are no conflicts to declare.Acknowledgements
We would like to thank Professor Eduardo Saiz (CASC, Department of Materials, Imperial College London) and the EPSRC grant EP/K01658X/1 for facilitating the Graphene Oxide (GO) materials used in this work. R. J. P. acknowledges the funding for a “Fellowship in Complex Fluids and Rheology” from the Engineering and Physical Sciences Research Council (EPSRC, UK) under Grant No. EP/M025187/1. We would also like to thank Prof. Phil Threlfall-Holmes (TH Collaborative Innovation) for useful discussions regarding the CaBER technique.Notes and references
- E. Feilden, E. García-Tuñón, F. Giuliani, E. Saiz and L. Vandeperre, J. Eur. Ceram. Soc., 2016, 36, 2525–2533 CrossRef CAS.
- J. A. Lewis, J. E. Smay, J. Stuecker and J. Cesarano, J. Am. Ceram. Soc., 2006, 89, 3599–3609 CrossRef CAS.
- J. Franco, P. Hunger, M. E. Launey, A. P. Tomsia and E. Saiz, Acta Biomater., 2010, 6, 218–228 CrossRef CAS PubMed.
- J. A. Lewis, Adv. Funct. Mater., 2006, 16, 2193–2204 CrossRef CAS.
- J. E. Smay, J. Cesarano and J. A. Lewis, Langmuir, 2002, 18, 5429–5437 CrossRef CAS.
- J. E. Smay, G. M. Gratson, R. F. Shepherd, J. Cesarano and J. A. Lewis, Adv. Mater., 2002, 14, 1279–1283 CrossRef CAS.
- E. García-Tuñón, S. Barg, J. Franco, R. Bell, E. D’Elia, R. C. Maher, F. Guitián and E. Saiz, Advanced Materials, 2015, 27, 1688–1693 CrossRef PubMed.
- V. G. Rocha, D. E. García-Tuñon, C. Botas, F. Markoulidis, E. Feilden, E. D'Elia, N. Ni, M. Shaffer and E. Saiz, ACS Appl. Mater. Interfaces, 2017, 9, 37136–37145 CrossRef CAS PubMed.
- U. T. Gonzenbach, A. R. Studart, D. Steinlin, E. Tervoort and L. J. Gauckler, J. Am. Ceram. Soc., 2016, 90, 3407–3414 CrossRef.
- E. Feilden, C. Ferraro, Q. Zhang, E. García-Tuñón, E. D'elia, F. Giuliani, L. Vandeperre and E. Saiz, Sci. Rep., 2017, 7, 13759 CrossRef PubMed.
- M. R. Sommer, L. Alison, C. Minas, E. Tervoort, P. A. R. X. Hs and A. X. R. Studart, Soft Matter, 2017, 13, 1794–1803 RSC.
- I. Donderwinkel, J. C. M. van Hest and N. R. Cameron, Polym. Chem., 2017, 8, 4451–4471 RSC.
- E. García-Tuñón, S. Barg, R. Bell, J. V. M. Weaver, C. Walter, L. Goyos-Ball and E. Saiz, Angew. Chem., Int. Ed., 2013, 52, 7805–7808 CrossRef PubMed.
- E. García-Tuñón, E. Feilden, H. Zheng, E. D’Elia, A. Leong and E. Saiz, ACS Appl. Mater. Interfaces, 2017, 9, 32977–32989 CrossRef PubMed.
- K. Fu, Y. Wang, C. Yan, Y. Yao, Y. Chen, J. Dai, S. Lacey, Y. Wang, J. Wan, T. Li, Z. Wang, Y. Xu and L. Hu, Adv. Mater., 2016, 28, 2587–2594 CrossRef CAS PubMed.
- V. G. Rocha, E. García-Tuñón, F. Markoulidis, E. Feilden, E. D’Elia, N. Ni, M. S. P. Shaffer and E. Saiz, ACS Appl. Mater. Interfaces, 2017, 9, 37136–37145 CrossRef CAS PubMed.
- B. G. Compton and J. A. Lewis, Adv. Mater., 2014, 26, 5930–5935 CrossRef CAS PubMed.
- S. V. Murphy and A. Atala, Nat. Biotechnol., 2014, 32, 773–785 CrossRef CAS PubMed.
- H.-W. Kang, S. J. Lee, I. K. Ko, C. Kengla, J. J. Yoo and A. Atala, Nat. Biotechnol., 2016, 34, 312–319 CrossRef CAS PubMed.
- N. A. Dudukovic, L. L. Wong, D. T. Nguyen, J. F. Destino, T. D. Yee, F. J. Ryerson, T. Suratwala, E. B. Duoss and R. Dylla-Spears, ACS Appl. Nano Mater., 2018, 1, 4038–4044 CrossRef CAS.
- J. Canny, IEEE Transactions of Pattern Analysis and Machine Intelligence PAMI-8, 1986, 6, 679–698 Search PubMed.
- L. Campo-Deaño and C. Clasen, J. Nonnewton. Fluid Mech., 2010, 165, 1688–1699 CrossRef.
- J. Sakamoto, J. van Heijst, O. Lukin and A. D. Schlüter, Angew. Chem., Int. Ed., 2009, 48, 1030–1069 CrossRef CAS PubMed.
- S.-L. Cai, W.-G. Zhang, R. N. Zuckermann, Z.-T. Li, X. Zhao and Y. Liu, Adv. Mater., 2015, 27, 5762–5770 CrossRef CAS PubMed.
- M. Gobbi, E. Orgiu and P. Samorì, Adv. Mater., 2018, 30, 1706103 CrossRef PubMed.
- T. G. Mezger, The Rheology Handbook, Vincentz Network GmbH & Co KG, 2006 Search PubMed.
- L. G. Cançado, A. Jorio, E. H. M. Ferreira, F. Stavale, C. A. Achete, R. B. Capaz, M. V. O. Moutinho, A. Lombardo, T. Kulmala and A. C. Ferrari, Nano Lett., 2011, 3190–3196 CrossRef PubMed.
- J. Kim, L. J. Cote, F. Kim, W. Yuan, K. R. Shull and J. Huang, J. Am. Chem. Soc., 2010, 132, 8180–8186 CrossRef CAS PubMed.
- F. Kim, L. J. Cote and J. Huang, Adv. Mater., 2010, 22, 1954–1958 CrossRef CAS PubMed.
- S. Naficy, R. Jalili, S. H. Aboutalebi, R. A. Gorkin III, K. Konstantinov, P. C. Innis, G. M. Spinks, P. Poulin and G. G. Wallace, Mater. Horiz., 2014, 1, 326–331 RSC.
- Z. Xu and C. Gao, ACS Nano, 2011, 5, 2908–2915 CrossRef CAS PubMed.
- L. E. Rodd, T. P. Scott, J. J. Cooper-White and G. H. McKinley, Appl. Rheol., 2005, 15, 12–27 CAS.
- D. T. Papageorgiou, Phys. Fluids, 1995, 7, 1529–1544 CrossRef CAS.
- G. H. McKinley, Annual Rheology Reviews, British Society of Rheology, 2005, 1–48 CAS.
- L. Martinie, H. Buggisch and N. Willenbacher, J. Rheol., 2013, 57, 627–646 CrossRef CAS.
- C. Vallés, R. J. Young, D. J. Lomax and I. A. Kinloch, J. Mater. Sci., 2014, 49, 6311–6320 CrossRef.
- W. Li, Y. Li, M. Su, B. An, J. Liu, D. Su, L. Li, F. Li and Y. Song, J. Mater. Chem. A, 2017, 44, 3639 Search PubMed.
- J. Mewis and N. J. Wagner, Colloidal Suspension Rheology, Cambridge University Press, 2012 Search PubMed.
- M. Geri, B. Keshavarz, T. Divoux, C. Clasen, D. J. Curtis and G. H. McKinley, 2018, arXiv preprint arXiv:1804.03061., 1–17.
- A. M. Barki, L. Bocquet and A. Stevenson, Sci. Rep., 2017, 7, 6017 CrossRef PubMed.
- E. Feilden, PhD thesis, Department of Materials. Imperial College London, 2017, 1–200.
- D. Kokkinis, M. Schaffner and A. E. R. Studart, Nat. Commun., 2015, 6, 1–10 Search PubMed.
| This journal is © The Royal Society of Chemistry 2019 |