 Open Access Article
Creative Commons Attribution 3.0 Unported Licence
Effects of particle stiffness on the extensional rheology of model rod-like nanoparticle suspensions†
Christian
Lang‡
 *a,
Jan
Hendricks
 b,
Zhenkun
Zhang
 c,
Naveen K.
Reddy
de,
Jonathan P.
Rothstein
f,
M. Paul
Lettinga‡
 a,
Jan
Vermant
 g and
Christian
Clasen
 b
b
aInstitute of Complex Systems-3, Forschungszentrum Jülich, 52428 Jülich, Germany. E-mail: c.lang@fz-juelich.de; Tel: +49 2461 61 2149
bDepartment of Chemical Engineering, KU Leuven, B-3001 Leuven, Belgium
cKey Laboratory of Functional Polymer Materials, Ministry of Education and Institute of Polymer Chemistry, Nankai University, Tianjin, 300071, P. R. China
dFaculty of Industrial Engineering, Hasselt University, Martelarenlaan 42, 3500 Hasselt, Belgium
eIMO, IMOMEC, Hasselt University, Wetenschapspark 1, 3590 Diepenbeek, Belgium
fMechanical and Industrial Engineering, University of Massachusetts, Amherst, MA 01003, USA
gDepartment of Materials, ETH Zürich, 8093 Zürich, Switzerland
First published on 29th November 2018
Abstract
The linear and nonlinear rheological behavior of two rod-like particle suspensions as a function of concentration is studied using small amplitude oscillatory shear, steady shear and capillary breakup extensional rheometry. The rod-like suspensions are composed of fd virus and its mutant fdY21M, which are perfectly monodisperse, with a length on the order of 900 nm. The particles are semiflexible yet differ in their persistence length. The effect of stiffness on the rheological behavior in both, shear and extensional flow, is investigated experimentally. The linear viscoelastic shear data is compared in detail with theoretical predictions for worm-like chains. The extensional properties are compared to Batchelor's theory, generalized for the shear thinning nature of the suspensions. Theoretical predictions agree well with the measured complex moduli at low concentrations as well as the nonlinear shear and elongational viscosities at high flow rates. The results in this work provide guidelines for enhancing the elongational viscosity based on purely frictional effects in the absence of strong normal forces which are characteristic for high molecular weight polymers.
1 Introduction
Non-spherical particles are more commonly found in nature than their spherical counterparts, and the chemical composition ranges from inorganic nanoparticles1–3 to biological filaments.4–6 There are many advantages for using non-spherical and in particular rod-like nanoparticles in industrial applications. First, stable rod-like particles are well suited as rheology modifiers, enhancing the shear thinning7 and increasing the extensional viscosity8 without imparting significant normal stress differences to the solution, as is the case for polymers, and for usage in spinning or spraying applications. Second, for attractive systems the percolation threshold is lowered,9–12 which is exploited for example in sag control agents. Non spherical suspensions also have a fascinating phase behavior.13,14 Furthermore, rod-like nanoparticles are commonly used to enhance mechanical, electrical and optical properties in suspensions15,16 or composites,17,18 as well as in coatings19 and structured consumer products.20 Similarly, their mechanical properties play an important role in biological systems, for example as a constituent of the cytoskeleton in cells.5,21The rheology of rod-like nanoparticle suspensions was reviewed by Solomon7 who identified four physiochemical properties that control their behavior: interactions between particles, aspect ratio, persistence length, and number density. Most systematic studies have been carried out for rod-like nanoparticle suspensions with relatively low aspect ratios L/d < 20.22–24 Additionally, many large aspect ratio rod-like particle suspensions, e.g. carbon nanotubes, glass fibers or actin, are typically polydisperse. The most extensively studied rod-like particles are carbon nanotubes and actin filaments, of which the material functions in shear and oscillatory flow have been determined. Intrinsic viscosities from shear rheology at low Péclet numbers are successfully used in determining the length of carbon nanotubes using the Kirkwood–Batchelor theory,25–29 which is in agreement with atomic force microscopy (AFM) results. The viscoelastic behavior of carbon nanotubes has been shown to arise predominantly from aggregate formation, unlike actin, where the viscoelastic behavior is additionally effected by stretching and bending.30–32 For extensional rheology of rigid rod-like particles, the theories of Batchelor,33 and Shaqfeh and Fredrickson34 have shown to be in quantitative agreement with experimental results for dilute fiber suspensions.8,35,36 However, these high aspect ratio rod-like particles have small persistence lengths, are polydisperse, and lack longterm colloidal stability.37,38 In the present work, we pursue an experimental study of both the shear and extensional flow properties on a model system of monodisperse virus nanoparticles, where the stiffness can be modified by genetic mutation. In addition, due to surface charges, these colloids have kinetic stability.
In the present study, we use the bacteriophages fd (wild type) and its mutant fdY21M.39,40 These virus particles are monodisperse and are in the colloidal domain (<1 μm), see Fig. 1. For the wild type fd virus, the dimensions are L = 880 nm and d = 6.6 nm with a persistence length Lp = 2800 ± 700 nm,14 while the stiffer mutant virus fdY21M is characterized by a slightly larger L = 910 nm, d = 6.6 nm and a 3.5 times larger persistence length Lp = 9100 ± 1600 nm.40 The viruses are inherently negatively charged at neutral pH13 and therefore stable in buffer solutions. The surface of both viruses consists of proteins, helically ordered along the core of circular DNA.41 For the mutant virus fdY21M, the 21st amino group of the capsid protein (g8p) is changed from tyrosine (Y) to methionine (M), causing a drastic change in stiffness because the larger methionine introduces a tighter packing of the virus coating. Since both bacteriophages are grown from a single colony of molecular clones of E.-coli bacteria, they are monodisperse by nature.
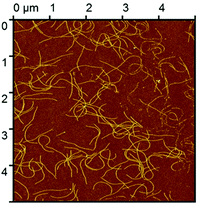 | ||
| Fig. 1 Atomic force microscopy picture of fd virus dispersed on a poly(allylamine)/silicon substrate. | ||
For suspensions of virus particles, only limited rheological data is available. Steady shear rheology was reported by Lang et al.,42 while other studies focus on the scaling of the material functions with particle concentration,43,44 salt concentration,45 and the detection of the suspension to gel transition.10,11 Close to the I–N transition, these systems were also interesting model systems to investigate shear banding phenomena.46–48 It has been observed in literature that due to the principle differences in the deformation profiles of shear and extensional flow, the evolution of rheological properties of microstructured fluids are drastically different,49,50 with a strongly enhanced elongational viscosity.51,52 The Trouton ratio, Tr = ηe/η, defined as the ratio between elongational viscosity, ηe, and shear viscosity, η, at the same flow strength is a good way to characterize this. For a Newtonian fluid Tr = 3, while this should not hold for suspensions of rod-like particles. According to our knowledge, no experiments have been conducted to measure the extensional properties of suspensions made from model high aspect ratio rod-like particles, in particular evaluating the effect of persistence length. Therefore, the goal of this paper is to identify the differences between shear and uniaxial extensional flow behavior, illustrating also the influence of particle stiffness.
The paper is organized as follows. First, the relevant theories are briefly introduced followed by materials and methods. Then, we compare the data from linear and nonlinear rheological measurements in shear as well as elongational flow to the theoretical predictions.
2 Theory
Theoretical studies relating the structural properties of rod-like particles in a Newtonian medium to their rheological behavior began with the work of Jeffery,53 who described the motion of ellipsoidal particles in a simple shear flow in the dilute concentration regime φ < φ*, where φ is the volume fraction and φ* ∼ 1/dL2 is the overlap volume fraction, with L and d the length and thickness of the particles. To extend the analysis into the semi-dilute concentration regime, φ* < φ < φIN, where φIN is the isotropic nematic spinodal point, information on the effect of rotational diffusion due to Brownian motion becomes necessary. The rotational diffusion for very slender rod-like particles was first derived by Broersma:54 | (1) |
 | (2) |
![[small gamma, Greek, dot above]](https://www.rsc.org/images/entities/i_char_e0a2.gif) is the shear rate.
is the shear rate.
In the small Péclet number regime, the prediction of rheological properties for semidilute rod-like suspensions is given by the theories of Kirkwood and Plock,28 Batchelor,29 Doi and Edwards,55 and later Morse.56,57 In addition to the rotational relaxation time of rods, τr = 1/Dr, for semiflexible rods, a wormlike chain model can be used to capture the additional relaxation mechanisms, using the steric geometry and persistence length of the rods as well as the solvent viscosity and concentration of the suspension as key parameters. In particular, due to entanglement effects between particles in the semidilute regime, a long time rotational diffusion, τend = 1/〈Dr〉, is introduced that relates to the dilute Drvia:
| 〈Dr〉 ∼ Dr(νL3)−2, | (3) |
The zero shear viscosity η0 observed under steady state shear flow for Pe ≪ 1 was theoretically predicted by Doi and Edwards,55 and Shaqfeh and Fredrickson,34 and follow-up theories including hydrodynamics, e.g. by Djalili-Moghaddam and Toll.60 All these theories include at least one fitting parameter and generally underpredict η0. Since the zero shear viscosity of rod-like suspensions is hard to measure, as has been discussed elsewhere,42 we cannot compare the theories with measurements.
For Pe ≫ 1, the flow is dominated by hydrodynamic forces. In this regime, the effect of both, aspect ratio and Péclet number, on the orientational ordering of rod-like particles in flow was given by Hinch and Leal61 (HL). In the regime 1 ≪ Pe ≪ (L/d + d/L)3, they predict an intrinsic viscosity of:
 | (4) |
Theoretical predictions of the extensional viscosity ηe of rods in the high Péclet number regime were first derived by Batchelor33 for dilute suspensions and later by Shaqfeh and Fredrickson.34 Batchelor's prediction for the intrinsic elongational viscosity reads:
 | (5) |
 | (6) |
 , where
 ![[small epsi, Greek, dot above]](https://www.rsc.org/images/entities/i_char_e0a1.gif) is the extension rate.
is the extension rate.
3 Experimental
3.1 Materials
In order to make fd virus suspensions more suitable as a model system for rheological investigation, the virus is suspended in glycerol–water mixtures in order to slow down the particle dynamics and possible sedimentation effects, and to obtain an optical matching of the refractive indices that lowers the van der Waals attractions. In this manner, both macroscopic and microscopic long-term colloidal stability is ensured, thus allowing for long time measurements as well as low frequency and low rate rheological experiments.Anhydrous glycerol (≥99.5%) and Trizma base were obtained from Sigma Aldrich and used as received without further purification. Mixing 20 mM water-based Tris buffer with 90 mM NaCl resulted in an ionic strength of 100 mM. This buffer solution was mixed with glycerol to obtain two buffered water/glycerol mixtures of 86.01 and 86.03 wt% glycerol with an ionic strength of 16 mM.
Fd virus and fdY21M were grown and purified following standard biological protocols,39 using the XL-1 blue strain of E. coli as a host bacterium. The yield from 6 L of growth medium is about 90 mg of virus. The virus particles were cleaned by multiple centrifugation steps at 3.6 × 10⁴g for 2 h each and ultra-centrifugation at 1.1 × 10⁵g for 12 h. In the final step of purification, virus particles were redispersed in a small volume of 100 mM Tris buffer to produce a highly viscous slurry. Under continuous stirring, the slurry was mixed with anhydrous glycerol until a weight fraction of 86.03 m% glycerol for the fd medium and 86.01 m% for the fdY21M medium was reached. Further dilution was accomplished by mixing the mother solutions with glycerol–Tris buffer mixtures of the same compositions. The glycerol/water ratio was chosen to minimize water uptake from the surrounding air.
3.2 Methods
The rheological properties of the virus suspensions in glycerol–Tris buffer were investigated using a strain controlled ARES LS rheometer (TA Instruments, New Castle, USA). All rheometry experiments were carried out at 22 °C with a cone-plate geometry of 25 mm diameter and a cone angle of 2.5°, using a solvent trap. The samples were pre-sheared at 100 s−1 for 5 min with a subsequent resting period of 100 min to avoid artifacts from sample loading and for equilibration of structure and temperature. In order to assess the lower time limit for steady shear experiments, the transient viscosity was recorded over time and the steady state viscosity was obtained from the final plateau value, see Fig. 3. Using this protocol, steady state viscosity data was obtained for shear rates between 0.01 s−1 and 1000 s−1. All flow curves as well as oscillatory experiments were determined using samples from one batch and repeated at least three times to ensure reproducibility. For dynamic measurements, strain amplitude sweeps were carried out prior to frequency sweeps to access the linear viscoelastic regime. Frequency sweeps were carried out within a frequency range for which restructuring time scales, τr, were longer than the measurement times. The restructuring half time of 108.9 s was obtained from stress relaxation measurements comparable to the relaxation of the Kerr effect,58 which sets the lower limit for the frequency to 0.0092 s−1.Uniaxial extensional rheometry was performed using a Haake CaBER-1 extensional rheometer (Thermo Haake GmbH, Karlsruhe, Germany), where the drive unit was used to control position and separation velocities of two circular parallel plates with a diameter Dp = 4 mm. The evolution of the thinning fluid filament between the two plates was recorded by a high speed camera62 (Photron Fastcam SA-2, Photron, San Diego CA, USA). The video images were subsequently analyzed by digital image processing implemented in Matlab in order to determine the full filament profile along with the position and dimension of the minimum filament radius Rmin.62 To control the liquid filament thinning, the fluid was extended by rapidly stretching the fluid from an initial plate separation of 2 mm to a plate separation of 6 mm. Extensional viscosities were calculated from fitting the minimum diameter evolution close to breakup using a similarity solution by Papageorgiou:63
 | (7) |
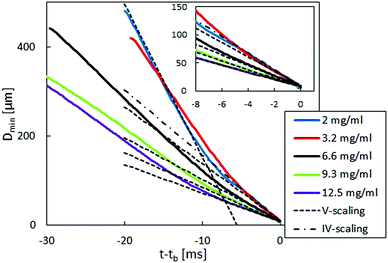
![[small epsi, Greek, dot above]](https://www.rsc.org/images/entities/i_char_e0a1.gif) (t) = (−2/Dmin)(dDmin(t)/dt), where Dmin is the minimum filament diameter before imposing the stretch. Each experiment was repeated at least five times to ensure reproducibility. In Fig. 4, Dmin is shown as a function of time, with tb being the time of filament breakup. Each line represents one typical experiment. The dashed and dash-dotted lines are fits of the similarity solution used for the viscosity calculation in the viscous case (V-scaling) as well as the inertial-viscous case (IV-scaling). At early times and large minimum diameter, the filament does not fulfill the slenderness assumption required for the application of eqn (7) and gravitational forces cannot be neglected.67 With decreasing diameter, a visco-capillary balance (V-scaling) is approached which is eventually followed by an inertia-viscous balance (IV-scaling). With increasing viscosity, the transition between the V-scaling and the IV-scaling moves to lower filament diameters and appears at diameters below the optical resolution limit for concentrations above 2 mg ml−1.
(t) = (−2/Dmin)(dDmin(t)/dt), where Dmin is the minimum filament diameter before imposing the stretch. Each experiment was repeated at least five times to ensure reproducibility. In Fig. 4, Dmin is shown as a function of time, with tb being the time of filament breakup. Each line represents one typical experiment. The dashed and dash-dotted lines are fits of the similarity solution used for the viscosity calculation in the viscous case (V-scaling) as well as the inertial-viscous case (IV-scaling). At early times and large minimum diameter, the filament does not fulfill the slenderness assumption required for the application of eqn (7) and gravitational forces cannot be neglected.67 With decreasing diameter, a visco-capillary balance (V-scaling) is approached which is eventually followed by an inertia-viscous balance (IV-scaling). With increasing viscosity, the transition between the V-scaling and the IV-scaling moves to lower filament diameters and appears at diameters below the optical resolution limit for concentrations above 2 mg ml−1.
The surface tension of each system was determined using the pendant drop method. A value of σ = 63 ± 1 mN m−1 was obtained for all suspensions under investigation, independent of the particle concentration.
4 Results
4.1 Small amplitude oscillatory shear
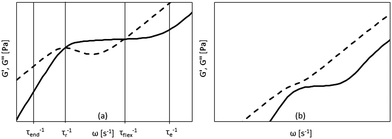
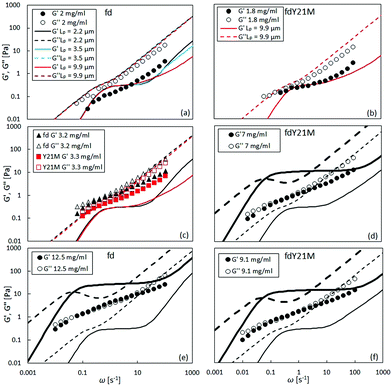
In the linear viscoelastic regime, the relaxation times of fd virus suspensions were probed using small amplitude oscillatory shear and evaluate the dynamic moduli, G′(ω) and G′′(ω), as a function of the angular frequency, ω. Fig. 5 shows the linear shear rheology of the flexible fd and stiff fdY21M. For the low nanoparticle concentrations (1 mg ml−1 < c < 3 mg ml−1) in Fig. 5(a) and (b), both virus suspensions show liquid like behavior with G′′ > G′ at all experimentally accessible frequencies. Despite the obvious differences between the moduli of the two species at low concentrations, the dynamic moduli curves are of similar form at intermediate concentrations. Here, both of the moduli curves touch each other, having equal values at a certain frequency, as indicated in Fig. 5(c) as well as by the open symbols in Fig. 6. At even higher concentrations (c > 4 mg ml−1), an elastic plateau region emerges, in which G′ > G′′, producing two crossover points, indicated in Fig. 5(e) and (f) as well as by the closed symbols in Fig. 6. The two crossover points mark the relaxation times of rotational self diffusion and chain undulation, τr > τflex. The inverse relaxation times, 1/τr, represent a measure of rotational self diffusion and are relatively low due to the high viscosity suspending medium. Eqn (1) gives Dr = 1/τr = 0.22 s−1 for fdY21M and Dr = 0.23 s−1 for fd in the dilute limit. While we find lower frequency crossover points similar to those predicted by eqn (3), located between 0.06 s−1 < 1/τr < 0.2 s−1 for both rods, the reciprocal relaxation time of chain undulation lies between 0.4 s−1 < 1/τflex < 1 s−1 for the stiff rod fdY21M and 0.4 s−1 < 1/τflex < 6.3 s−1 for the flexible fd. A broadening of the elastic region with increasing concentration can be clearly seen in Fig. 6, where the closed symbols represent the low and high frequency boundaries of this region for different concentrations compared to the predictions by Morse theory. This broadening between crossover points in the direction of higher frequencies for fd virus compared to the fdY21M virus indicates the importance of stress relaxation due to chain undulation for more flexible rod-like particles. From the values for τe ∼ Le4/DrLp, located at the onset of equal slope of both moduli, it is possible to estimate the average tube length Le ∼ Lp(ρL2)−2/5, where ρ is the contour length per unit volume, of both systems.57 The identifiable values of 1/τe seem to be concentration independent. We find Le ≈ 0.3 μm for fd virus and Le ≈ 0.9 μm for fdY21M, thereby, roughly confirming the difference in persistence length between the two systems.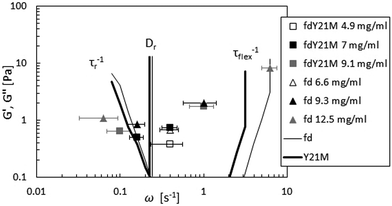 | ||
| Fig. 6 Touching (open symbols) and crossover points (closed symbols) of moduli compared to Morse theory for fd (thin line) and fdY21M (thick line). The straight lines show Dr computed from eqn (1). The lower frequency crossover points mark the inverse rotational relaxation time τr−1 and the higher frequency cross over points are the inverse undulation time τflex−1. | ||
The theoretical prediction by Morse57 agrees qualitatively with the experimental moduli for flexible fd whereas for fdY21M it agrees both qualitatively and quantitatively at low concentrations, as shown in Fig. 5(a) and (b). Interestingly, the predictions for the wild type fd are not in agreement with the experiments. Since the agreement with the storage modulus of fdY21M is better, we investigated whether a change in persistence length for the Morse prediction of fd virus leads to a more quantitative agreement. Fig. 5(a) shows a comparison of the experiment with three different theoretical curves obtained for three persistence lengths up to and including the persistence length of fdY21M. The theoretical predictions for different stiffnesses are indistinguishable for lower frequencies and differ only in the high frequency regime. Therefore, we conclude that Morse theory gives a better estimate of the complex moduli of stiffer rods as compared to more flexible ones. Another possibility for the discrepancies between theory and experiment could be the use of a wrong effective thickness in the definition of the number density used in Morse theory, resulting from the unknown zeta potential of our solvent. We applied a large range of different particle thicknesses, from 6 to 25 nm, but the sensitivity of the predictions to the thickness is limited.
Morse theory seems to overestimate the magnitude of the intrinsic moduli at higher concentrations and predicts a more complex curve shape than observed in our experiments, see Fig. 5(e), (d), and (f), whereas experiments on significantly longer rods show indeed the predicted curve shape.68 From Fig. 5(e) and (f) as well as from Fig. 6, it can be observed that the theory predicts a decrease of 1/τflex with increasing stiffness. As indicated by the theoretical lines in Fig. 6, however, the broadening of the elastic region observed in our experiments seems to be more drastic than the theoretical prediction.
At low frequencies, both systems should show a strongly reduced rotational diffusion 〈Dr〉 ≈ 0.012 s−1 due to entanglement effects. Despite the highly viscous buffer solution, we are not able to clearly identify the slope of the moduli curves in the low frequency regime or the diffusivity in the entanglement affected long time regime. Therefore, zero shear viscosities of the suspensions,  , are not measurable from the oscillatory data.
4.2 Steady shear viscosity
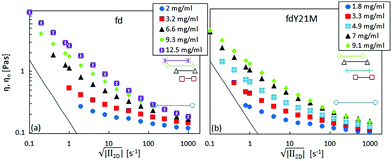
Fig. 7 displays the shear viscosity of fd (full symbols) and fdY21M (open symbols) as a function of shear rate for different concentrations. The shear viscosity of the flexible virus, fd, given in Fig. 7(a), is higher than the viscosity of the stiff virus, fdY21M, shown in Fig. 7(b), for all shear rates. The highly concentrated samples display the strongest shear thinning behavior in the low shear rate region compared to other concentrations. Fig. 8(a) shows the shear rate dependent intrinsic viscosity of fd and fdY21M following eqn (4), calculated from the data in Fig. 7. Using the intrinsic viscosity instead of the shear viscosity itself brings all flow curves of one type of rod at different concentrations to a single master curve. The intrinsic viscosity of the more flexible fd virus is still higher than the intrinsic viscosity of the stiffer rod fdY21M for the complete measurable shear rate range. In Fig. 8(b), the shear rate is scaled by the rotational diffusion given in eqn (1), bringing the two measured curves closer together. In the high Péclet number regime, the data is in good agreement with the theoretical prediction by Hinch and Leal,61 combining eqn (4) with a fitted aspect ratio of 45 for fd and 37 for fdY21M. This points in the direction of hydrodynamic interactions dominating the high shear rate regime. Using these effective aspect ratios, the estimated hydrodynamic radii of the two rods, given their well-known length, are 19.6 nm for fd and 24.6 nm for fdY21M, which is significantly larger than the bare diameter of 6.6 nm. This can be attributed to hydrodynamic interactions that decay over a distance of ∼2d for aligned rods,69 whilst the glycerol also might form a solvation layer.
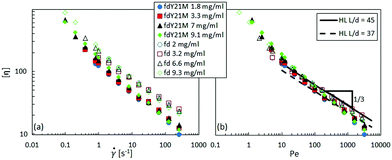 | ||
| Fig. 8 (a): Intrinsic viscosity as a function of shear rate for different concentrations. (b): Intrinsic viscosity as a function of Péclet number as defined by eqn (2). The line shows a prediction by HL theory. | ||
4.3 Uniaxial extension
The apparent extensional viscosity of rod-like particles was measured using capillary breakup extensional rheometry. In Fig. 7, we show a comparison between the shear viscosity and the extensional viscosity, plotted as a function of the square root of the second invariant of the rate of deformation tensor . The range of extension rates over which constant extensional viscosities are reported is a consequence of the type of experiment. The decreasing filament diameter in Fig. 4 causes a continuously increasing capillary pressure and thus for a Newtonian liquid an increasing extension rate. It is seen that the elongational viscosity is generally higher than the shear viscosity.
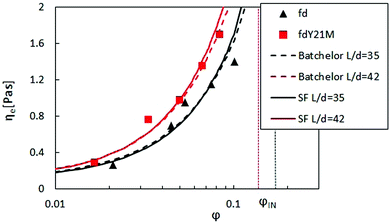
For Newtonian liquids, the Trouton ratio is ηe/η = 3, independent of extensional rate and concentration. In rod-like colloidal suspensions, ηe is predicted to be independent of Pe in the limit of high Péclet numbers, however, it depends on concentration, as given in eqn (5) and (6). In Fig. 9, the two theoretical curves are fitted to the measurement of the elongational viscosity. The theoretical prediction agrees with the measured data, if hydrodynamic aspect ratios of 35 for fd, and 42 for fdY21M are used as fitting parameters, or effective hydrodynamic thicknesses of d = 25.1 nm for fd, and 21.7 nm for fdY21M. Thus, the hydrodynamic radius of the stiff rods under extensional flow is larger than that of the flexible rods, opposite of what was obtained from fitting the steady shear flow curves at high shear rates.
Accordingly, we observe higher Trouton ratios for the stiffer virus fdY21M compared to the more flexible virus fd, as can be seen in Fig. 10, where the Trouton ratio of both systems is plotted as a function of  for different concentrations. Again, this is markedly different from the behavior in steady shear flow where the viscosity of the stiff fdY21M is lower than the values obtained for the more flexible virus fd.
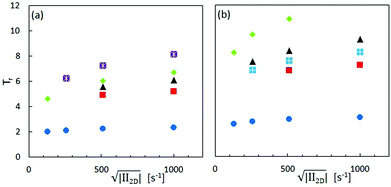 | ||
| Fig. 10 Trouton ratio as a function of the square root of the second invariant of the rate of deformation tensor for different concentrations of (a) fd and (b) fdY21M. Legend, see Fig. 7. | ||
5 Discussion and conclusions
In this paper, we investigated the shear and extensional rheological properties of ideal stiff and more flexible rods, using rod-like viruses with similar aspect ratio (L/d = 120) and different stiffness, respectively, L = Lp/10 and L = Lp/3. We find that at high rates the shear and extensional viscosity can be described by purely hydrodynamic theories for both systems: the shear viscosity displays the 1/3 dependence on shear rate predicted by eqn (4), while the volume fraction dependence of the extensional viscosity is well described by eqn (6). This is in strong contrast to measurements on carbon nanotubes, a polydisperse system, for which the concentration dependence of the extensional viscosity is much stronger.70For interpreting the results, we make use of the fact that the length of the systems is very well defined, so that the only fit parameter for both, extensional and shear viscosity, is the effective hydrodynamic radius. For the stiff rods, we find roughly the same value for the effective hydrodynamic radius from the two completely different types of experiments. Such as reported in the literature,69 the hydrodynamic radius exceeds the solvation layer of the particles.
We also find, however, that stiffness of the rods plays an important role. The effect of stiffness is of opposite character for both types of deformations.
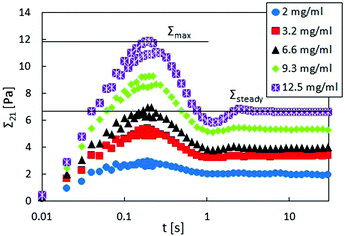
The shear viscosity of the more flexible rods at high shear rates is higher than for the stiff fdY21M. This could be due to the fact that flexible rods have the tendency to form complex structures such as hairpins,71 causing steric interactions, which can be neglected for stiff rods, as was done in both theories. This argument is not valid for extensional flow as in this case the more flexible virus should just stretch and behave very similar to the stiff virus. Still, the extensional viscosity is significantly smaller for the more flexible virus. We do not have an explanation for this observation, but we do note that this is also the case for the viscosity at the point of stress overshoot to the steady state value, see Fig. 11, although in this case the difference decreases with increasing concentration.
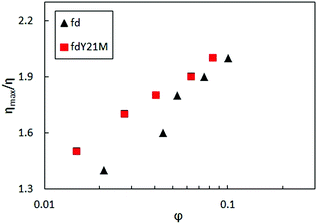 | ||
Fig. 11 Overshoot viscosity divided by steady state viscosity as a function of concentration at ![[small gamma, Greek, dot above]](https://www.rsc.org/images/entities/i_char_e0a2.gif) = 10 s−1. = 10 s−1. | ||
So far, we discussed the effect of flexibility for very high rates, but the difference in flexibility between fd and fdY21M is also reflected in the linear dynamic data. Indeed, comparing τflex for both systems at high concentrations, as displayed in Fig. 5(d) and (e), we observe that this quantity is a factor 10 higher for the stiff system as compared to the flexible one. Moreover, τr of the flexible system compared to τr at the same volume fraction of the stiff rods is smaller, since the purely geometric hindrance of the flexible system is reduced, see Fig. 7.
In conclusion, this work suggests that stiffness is a particularly important parameter in controlling the extensional viscosity of formulations containing rod-like particles. In order to support these suggestions, one would need to measure ordering at high shear rates, for example by performing Rheo-SANS measurements.
Conflicts of interest
There are no conflicts to declare.Acknowledgements
The authors would like to acknowledge David C. Morse for the fruitful discussions and O. Deschaume for performing AFM measurements. This study was funded by the European Union within the Horizon 2020 project under the DiStruc Marie Skłodowska Curie innovative training network; grant agreement no. 641839 as well as under the People Programme (Marie Curie Actions) of the European Union's Seventh Framework Programme (FP7/2007-2013) under REA grant agreement no. 607937 (SUPOLEN), the Research Foundation Flanders (FWO, grant no. G077916N), and a senior fellowship (SF/14/018, KU Leuven Internal Funds).Notes and references
- W. D. Kingery, H. K. Bowen and D. R. Uhlmann, Introduction to ceramics, Wiley-Interscience, 1976 Search PubMed.
- D. Hradil, T. Grygar, J. Hradilova and P. Bezdicka, Appl. Clay Sci., 2003, 22, 223–236 CrossRef CAS.
- L. Bailey, H. N. W. Lekkerkerker and G. C. Maitland, Soft Matter, 2007, 3, 1145–1162 RSC.
- W. M. Stanley and T. F. Anderson, J. Biol. Chem., 1941, 139, 325–338 CAS.
- E. L. Elson, Annu. Rev. Biophys. Biophys. Chem., 1988, 17, 397–430 CrossRef CAS.
- M. T. Cabeen and C. Jacobs-Wagner, Nat. Rev. Microbiol., 2005, 3, 601–610 CrossRef CAS.
- M. J. Solomon and P. T. Spicer, Soft Matter, 2010, 19, 1391–1400 RSC.
- J. Mewis and A. B. Metzner, J. Fluid Mech., 1974, 62, 593–600 CrossRef.
- T. Schilling, S. Jungblut and M. A. Miller, Phys. Rev. Lett., 2007, 98, 108303 CrossRef CAS PubMed.
- Z. Zhang, N. Krishna, M. P. Lettinga, J. Vermant and E. Grelet, Langmuir, 2009, 25, 2437–2442 CrossRef CAS PubMed.
- M. Huang, R. Rotstein, S. Fraden, K. E. Kasza and N. T. Flynt, Soft Matter, 2009, 5, 2766–2771 RSC.
- N. K. Reddy and Z. Zhang, J. Rheol., 2012, 56, 1153–1174 CrossRef.
- E. Grelet and S. Fraden, Phys. Rev. Lett., 2003, 90, 198302 CrossRef.
- Z. Dogic and S. Fraden, Curr. Opin. Colloid Interface Sci., 2006, 11, 47–55 CrossRef CAS.
- A. V. Kyrylyuk and P. van der Schoot, PNAS, 2008, 105, 8221–8226 CrossRef CAS.
- K. M. Schultz, A. Baldwin, K. L. Kiick and E. M. Furst, Macromolecules, 2009, 42, 5310–5316 CrossRef CAS.
- D. Srivastava, C. Wei and K. Cho, Appl. Mech. Rev., 2003, 56, 215–230 CrossRef.
- E. K. Hobbie, J. A. Fagan, J. Obrzut and S. D. Hudson, ACS Appl. Mater. Interfaces, 2009, 1, 1561–1566 CrossRef CAS.
- S. Kheirandish, I. Guybaidullin, W. Wohlleben and N. Willenbacher, Rheol. Acta, 2008, 47, 999–1011 CrossRef CAS.
- A. D. Maynard, Nano Today, 2006, 1, 22–33 CrossRef.
- Y. C. Lin, G. H. Koenderink, F. C. MacKintosh and D. A. Weitz, Macromolecules, 2007, 40, 7714–7720 CrossRef CAS.
- M. Zrinyi, M. Kabai-Faix, F. Horkay and S. Fuhos, Langmuir, 1993, 9, 71–76 CrossRef CAS.
- M. J. Solomon and D. V. Boger, J. Rheol., 1998, 42, 929–949 CrossRef CAS.
- A. Mohraz and M. J. Solomon, J. Colloid Interface Sci., 2006, 300, 155–162 CrossRef CAS.
- V. A. Davis, L. M. Ericson, A. N. G. Parra-Vasquez, H. Fan, Y. Wang, V. Pietro, J. A. Longoria, S. Ramesh, R. K. Saini, C. Kittrell, W. E. Billups, W. W. Adams, R. H. Hauge, R. E. Smalley and M. Pasquali, Macromolecules, 2004, 37, 154–160 CrossRef CAS.
- A. N. G. Parra-Vasquez, I. Stepanek, C. A. Davis, V. C. Moore, E. H. Haroz, J. Shaver, R. H. Hauge, R. E. Smalley and M. Pasquali, Macromolecules, 2007, 40, 4043–4047 CrossRef CAS.
- S. Marceau, P. Dubois, R. Fulchiron and P. Cassagnau, Macromolecules, 2009, 42, 1433–1438 CrossRef CAS.
- J. G. Kirkwood and R. J. Plock, J. Chem. Phys., 1956, 24, 665–669 CrossRef CAS.
- G. K. Batchelor, J. Fluid Mech., 1970, 41, 545–557 CrossRef.
- F. C. MacKintosh, J. Kas and P. A. Janmey, Phys. Rev. Lett., 1995, 75, 4425–4428 CrossRef CAS.
- L. A. Hough, M. F. Islam, P. A. Janmey and A. G. Yodh, Phys. Rev. Lett., 2004, 93, 168102 CrossRef CAS.
- M. L. Gardel, J. H. Shin, F. C. MacKintosh, L. Mahadevan, P. Matsudaira and D. A. Weitz, Science, 2004, 304, 1301–1305 CrossRef CAS PubMed.
- G. K. Batchelor, J. Fluid Mech., 1971, 46, 813–829 CrossRef.
- E. S. G. Shaqfeh and G. H. Fredrickson, Phys. Fluids A, 1990, 2, 7–24 CrossRef CAS.
- J. F. T. Pittmann and J. Bayram, Int. J. Multiphase Flow, 1990, 16, 545–559 CrossRef.
- A. W. K. Ma, T. Chinesta, T. Tuladhar and M. R. Mackley, Rheol. Acta, 2008, 47, 447–457 CrossRef CAS.
- C. Joly-Duhamel, D. Hellio, A. Ajdari and M. Djabourov, Langmuir, 2002, 18, 7158–7166 CrossRef CAS.
- Y. Y. Huang, S. V. Ahir and E. M. Terentjev, Phys. Rev. B: Condens. Matter Mater. Phys., 2006, 73, 125422 CrossRef.
- J. Sambrook and D. W. Russel, Molecular cloning: A laboratory manual, Cold Spring Harbor Press, New York, 2001 Search PubMed.
- E. Barry, D. Beller and Z. Dogic, Soft Matter, 2009, 5, 2563–2570 CAS.
- Z. Zhang, J. Buitenhuis, A. Cukkemane, M. Brocker, M. Bott and J. K. G. Dhont, Langmuir, 2010, 26, 10593–10599 CrossRef CAS PubMed.
- C. Lang, J. Kohlbrecher, L. Porcar and M. P. Lettinga, Polymers, 2016, 8, 291 CrossRef.
- C. Graf, H. Kramer, M. Deggelmann, M. Hagenbuchle, C. Johner, C. Martin and R. Weber, J. Chem. Phys., 1993, 98, 4920–4929 CrossRef CAS.
- F. G. Schmidt, B. Hinner, E. Sackmann and J. X. Tang, Phys. Rev. E: Stat. Phys., Plasmas, Fluids, Relat. Interdiscip. Top., 2000, 62, 5509–5517 CrossRef CAS.
- E. Sarmiento-Gomez, D. Montalvan-Sorrosa, C. Garza, J. Mas-Oliva and R. Castillo, Eur. Phys. J. E: Soft Matter Biol. Phys., 2012, 35, 35–49 CrossRef CAS.
- K. Kang, M. P. Lettinga, Z. Dogic and J. K. G. Dhont, Phys. Rev. E: Stat., Nonlinear, Soft Matter Phys., 2006, 74, 026307 CrossRef.
- K. Kang and J. K. G. Dhont, EPL, 2008, 84, 14005 CrossRef.
- J. K. G. Dhont, K. Kang, M. P. Lettinga and W. J. Briels, Korea-Australia Rheology Journal, 2010, 22, 291–308 Search PubMed.
- D. E. Smith and S. Chu, Science, 1998, 281, 1335–1340 CrossRef CAS.
- D. E. Smith, H. P. Babcock and S. Chu, Science, 1999, 283, 1724–1727 CrossRef CAS.
- R. K. Prud'homme and G. G. Warr, Langmuir, 1994, 10, 3419–3426 CrossRef.
- C. A. Cathey and G. G. Fuller, J. Non-Newtonian Fluid Mech., 1988, 30, 303–316 CrossRef CAS.
- G. B. Jeffery, Proc. R. Soc. London, 1922, 102, 161–179 CrossRef.
- J. Broersma, J. Chem. Phys., 1960, 32, 1626–1632 CrossRef.
- M. Doi and S. F. Edwards, J. Chem. Soc., Faraday Trans. 2, 1977, 74, 918–932 RSC.
- D. C. Morse, Macromolecules, 1998, 31, 7030–7043 CrossRef CAS.
- D. C. Morse, Macromolecules, 1998, 31, 7044–7067 CrossRef CAS.
- M. Doi and S. F. Edwards, J. Chem. Soc., Faraday Trans. 2, 1977, 74, 560–570 RSC.
- V. Shankar, M. Pasquiali and D. C. Morse, J. Rheol., 2002, 46, 1111–1154 CrossRef CAS.
- M. Djalili-Moghaddam and S. Toll, J. Non-Newtonian Fluid Mech., 2005, 132, 73–83 CrossRef CAS.
- E. J. Hinch and L. G. Leal, J. Fluid Mech., 1972, 52, 683–712 CrossRef.
- W. Matheus, C. Mcllroy, O. G. Harlen and C. Clasen, Phys. Fluids, 2015, 27, 093301 CrossRef.
- D. T. Papageorgiou, Phys. Fluids, 1995, 7, 1529–1544 CrossRef CAS.
- G. H. McKinley and A. Tripathi, J. Rheol., 2000, 44, 653–670 CrossRef CAS.
- J. Eggers, Phys. Rev. Lett., 1993, 71, 3458–3460 CrossRef.
- J. Eggers, Rev. Mod. Phys., 1997, 69, 865–929 CrossRef CAS.
- L. Campo-Deano and C. Clasen, J. Non-Newtonian Fluid Mech., 2010, 165, 1688–1699 CrossRef CAS.
- F. G. Schmidt, B. Hinner and E. Sackmann, Phys. Rev. E: Stat. Phys., Plasmas, Fluids, Relat. Interdiscip. Top., 2000, 61, 5646–5653 CrossRef CAS.
- M. P. Lettinga, J. K. G. Dhont, Z. Zhang, S. Messlinger and G. Gompper, Soft Matter, 2010, 6, 4556–4562 RSC.
- N. Darsono, H. Mizunuma and H. Obara, J. Soc. Rheol., Jpn., 2012, 40, 101–109 CrossRef CAS.
- I. Kirchenbuechler, D. Guu, N. A. Kurniawan, G. H. Koenderink and M. P. Lettinga, Nat. Commun., 2014, 5, 5060 CrossRef CAS PubMed.
Footnotes |
| † Electronic supplementary information (ESI) available: Intrinsic moduli of fd and fdY21M at all measured concentrations. See DOI: 10.1039/c8sm01925h |
| ‡ Laboratory for Soft Matter and Biophysics, KU Leuven, 3000, Leuven, Belgium. |
| This journal is © The Royal Society of Chemistry 2019 |

