
 Open Access Article
 This Open Access Article is licensed under a
 Creative Commons Attribution 3.0 Unported Licence
Virtual unrolling of spirally-wound lithium-ion cells for correlative degradation studies and predictive fault detection†
Matt D. R.
Kok
 abc,
James B.
Robinson
ac,
Julia S.
Weaving
a,
Anmol
Jnawali
ab,
Martin
Pham
ac,
Francesco
Iacoviello
a,
Daniel J. L.
Brett
abc and
Paul R.
Shearing
*abc
abc,
James B.
Robinson
ac,
Julia S.
Weaving
a,
Anmol
Jnawali
ab,
Martin
Pham
ac,
Francesco
Iacoviello
a,
Daniel J. L.
Brett
abc and
Paul R.
Shearing
*abc
aElectrochemical Innovation Lab, Department of Chemical Engineering, University College London, London, WC1E 7JE, UK. E-mail: p.shearing@ucl.ac.uk
bThe Faraday Institution, Quad One, Becquerel Avenue, Harwell Science and Innovation Campus, Didcot, OX11 0RA, UK
cElectrochemical Diagnostics & Forensics Lab, Department of Chemical Engineering, University College London, London, WC1E 7JE, UK
First published on 19th August 2019
Abstract
A spirally-wound LG 18650 MJ1 lithium-ion battery was imaged in 3D before and after 1061 cycles using X-ray computed tomography. The battery's capacity had faded to 79% of its initial value and some of that fade was attributed to delamination in the innermost region of the ‘jelly-roll’ structure. A method for virtually unrolling the jelly-roll and analysing it in different coordinates is presented. The method allows efficient comparison of the position and shape of the electrodes at different times and highlights imperfections present in the jelly-roll before cycling which were shown to nucleate the delamination of the electrode.
Introduction
Lithium-ion batteries have become ubiquitous in modern life due to their high energy and power densities, relatively long cycle life and portability. This widespread deployment has generated a huge market and increased the need for improved performance, longevity and reliability of cells. The cycle life of a battery is governed by a wide array of factors1,2 including, the temperatures that cells are exposed to,3 rate of operation4 and the depth-of-discharge of each cycle.5 There are many varied degradation mechanisms6 and similarly varied techniques for tracking them including acoustic time-of-flight measurements,7 electrochemical methods,8 and X-ray computed tomography (CT) among others. X-ray CT has been shown to be a powerful, non-destructive technique to investigate batteries with studies highlighting its efficacy in identifying microstructural evolution9,10 and cell failure.11,12Using X-ray CT, Waldmann et al.13 identified deformations in spirally-wound cells (which exhibit what is commonly referred to as a ‘jelly-roll’ architecture), of a number of cell chemistries as a result of high rate cycling. Comparison to cells cycled at low rates showed substantially larger deformations; similar deformations, observed towards the centre of the cell, were observed by Pfrang et al.14 The capacity fade observed in the cells was ascribed to delamination of the cathode in the central region of the jelly-roll.
In this work, the structural deformation of the electrodes of a commercial cell are examined using X-ray CT. Virtual unrolling of the jelly-roll structure provides a radially resolved deformation map of a battery electrode revealing, for the first time, that initial defects in the jelly-roll are nucleation points for electrode deformation which can be correlated to ageing and ultimately cell failure. The rapid nature of the X-ray CT scans, coupled with fast analysis, provides a pathway to an in-line quality assurance process, which currently rely on optical assessments15 of the electrodes prior to assembly, which could have a significant impact on safety, durability and recyclability of Li-ion batteries.
Methods & results
The major computational challenge in this study was the rigorous extraction of the jelly-roll. The ‘edge’ of the repeating layer was chosen to be the boundary between the anode and separator phase and the cathode as this offered the greatest contrast. The contrast was enhanced using an adaptive edge enhancement algorithm consisting of a linear deployment of a small kernel median filter, an unsharp mask and a Gaussian difference filter. The Cartesian coordinates of the edge were extracted using a modified marching cubes algorithm around the mean of the image.16Once extracted, the 2-dimensional jelly-roll should form a continuous Archimedean spiral, which in cylindrical coordinates is:
| r = a + bϕ | (1) |
The radius (r) plotted versus the angle (ϕ) would produce a series of straight lines, each representing a different loop of the spiral. Fig. 1(b) demonstrates this trend between 0 and 270 degrees.
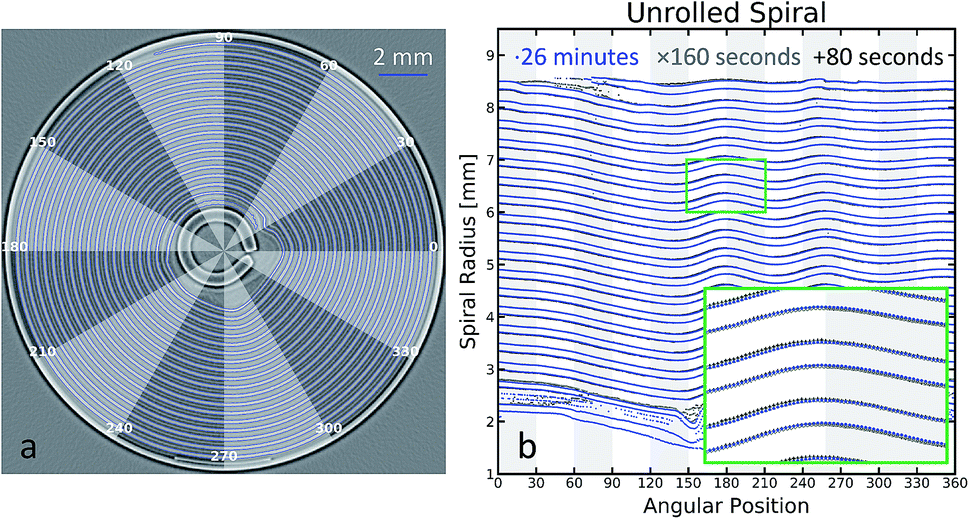 | ||
| Fig. 1 (a) Example of an orthoslice after edge enhancement, the blue line shows the contour. (b) A plot of the radius of the spiral versus the angular position for three different length acquisition times. The inset image shows the plot in higher resolution. | ||
A coordinate system transform is performed on the extracted data. The centre of rotation of the cell is found by trying multiple centres and minimizing the resulting eccentricity of the cylindrical casing of the cell. Following that, the radius and angular position can be determined according to:
 | (2) |
 | (3) |
Fig. 1(b) also highlights the efficacy of this method for rapid in-line quality assurance. The inset image shows that essentially identical unrolled contours can be extracted with an 80 second or 26 minute acquisition. Coupled with computationally efficient methods presented here, the full shape of a spiral wound electrode can be imaged and analysed in under two minutes representing a substantial improvement in characterisation times using more traditional methods, which would require qualitatively analysing the greyscale images of the battery to assess the shape and quality of the jelly roll. Additionally these methods are completely non-destructive and non-intrusive.
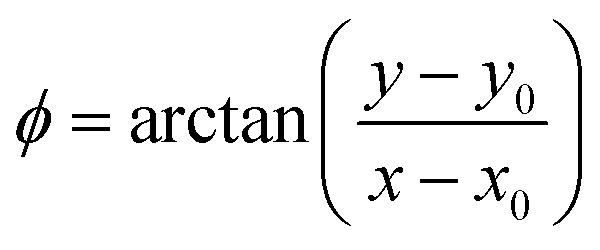
The battery was cycled until its capacity had faded to approximately 79% of the initial capacity, which is the end of its primary life making it only useable in secondary applications.17 Non-destructive 3D tomography of the battery after cycling showed a small mechanical failure in the inner region of the jelly-roll, near the centre of the cell.
Fig. 2(a) shows the capacity fade if the MJ1 over the first 1097 cycles and Fig. 2(b) a series of orthoslices from tomograms at times between 0 and 1089 cycles. When comparing these two images it is clear there is a strong correlation between the amount of deformation in the centre of the jelly roll and the capacity loss experienced by the cell.
 | ||
| Fig. 2 (a) Capacity fade of the MJ1 cell over 1097 cycles. (b) A series of orthoslices of the cell over time, showing the gradual increase in the size of the large deformation on the inner portion of the jelly roll. | ||
Fig. 3 shows a progression of orthoslices from tomography performed at this point. Fig. 3(a) is a YZ orthoslice showing the deformation of the jelly-roll, the most prominent feature is the damage to the jelly roll. The middle image Fig. 3(b) shows an XY orthoslice through the area that shows the most significant deformation and the right side Fig. 3(c) is a region-of-interest (ROI) scan of the most affected region of the jelly-roll. The capacity loss observed is likely from the delamination of and damage to the electrodes. The active materials in both electrodes are no longer in good electrical contact with one another, with the electrochemical pathways significantly elongated as a result of the delamination. The ‘kink’ or deformation in the coil is relatively small; however, it spans a region of more than 25 mm inside the electrode itself, which results in noticeable capacity fade. Lastly, the high-resolution ROI scan shows the cathode inside the kink has fractured and delaminated from the current collector, further reducing the available active mass in the battery.
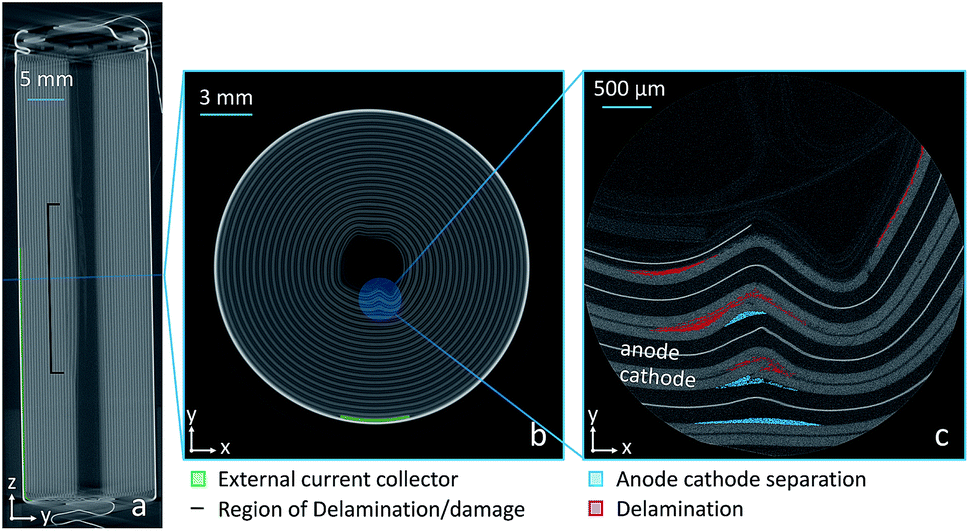 | ||
| Fig. 3 (a) YZ orthoslice showing the 18650 interior after 1061 cycles. (b) Higher-resolution tomography of the cell. (c) Higher-resolution tomography of the specific ROI. | ||
The mechanism of this deformation and delamination can be explored by analysing the unrolled jelly-roll as seen in Fig. 1(b) before and after cycling. Comparing the results one orthoslice at a time would be very arduous, so the analysis was simplified by dividing the jelly-roll into different equal-sized layers of interest. Here, five different regions are presented, each representing 100 orthoslices, totalling 3.6 mm of electrode, each. The electrode was divided into these regions based on the location of the external current collector tab which can be seen at the 270 degree position (bottom) of the orthoslice in Fig. 3(b).
The ‘top’ regions, shown in Fig. 4(b) are not influenced directly by the presence of the current collector while the bottom regions are Fig. 4(a). The middle region, shown in blue spans the edge of the current collector tab, with roughly half above and half below its end. The data obtained from each of these regions is presented by extracting the coordinates of the unrolled electrode for each of the 100 slices and then overlaying the results on top of each other.
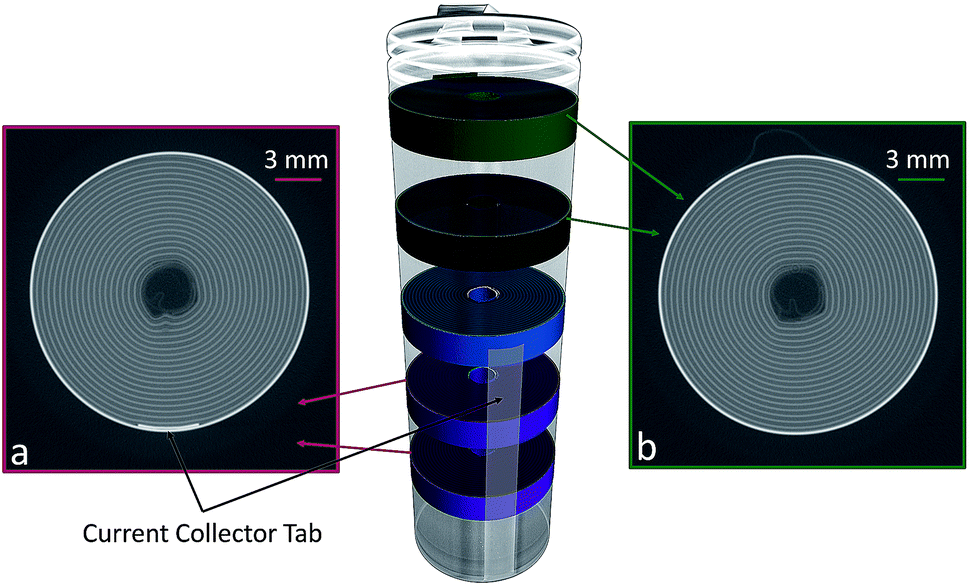 | ||
| Fig. 4 Schematic detailing the different regions analysed in this study. The bottom (a) has an external current collector while the top (b) does not. The middle region (in blue) has the end of the current collector. | ||
Fig. 5 provides a direct insight into the cause of the delamination. The pristine electrode (black) has a small point of inflection or imperfection near the location of the external current collector (270 degrees). The cycling of the cell (blue) clearly increases the magnitude of the inflection, with the eventual deformation of the jelly-roll and delamination of the electrodes taking place exactly in line with the imperfection. The large macro deformation inside the coil is the most obvious change in the electrode but Fig. 5 also shows there is significant deformation in large portions of the jelly-roll. The outermost layer of the electrode, shows significant deformation around the current collector. The constant expansion and contraction of the electrode during cycling forced the layer to fold around the irregular shaped tab.
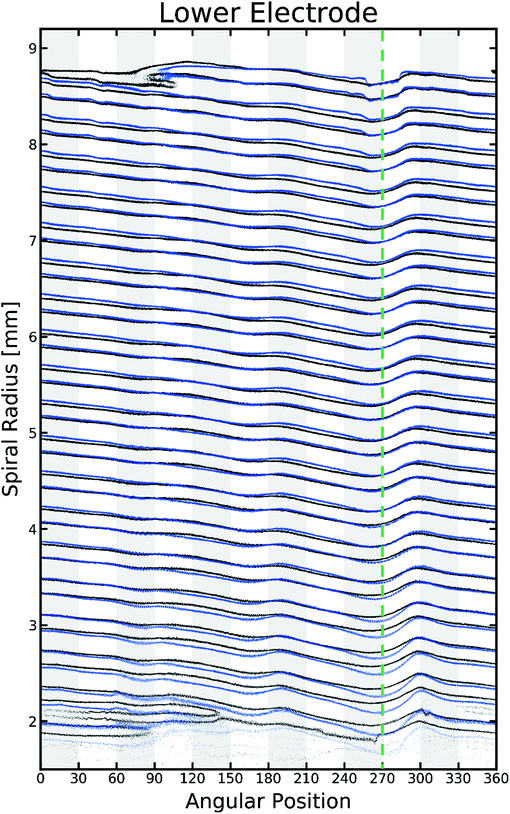 | ||
| Fig. 5 The unrolled jelly-roll of the lowest region in the electrode. The black points show the electrode before cycling and the blue after. The dashed green line indicates the position of the current collector tab. | ||
Fig. 6 presents the deformation patterns in the jelly-roll for the bottom Fig. 6(a), middle Fig. 6(b) and top Fig. 6(c) of the cell. The electrode position before and after cycling are presented in black and grey, respectively. The coloured areas represent regions of significant deformation during cycling. Red regions show inward movement, such as the ‘kink’ visible after cycling while blue areas indicate a net outward deformation. The shape of these deformation patterns helps explain the nature of these processes within the cell. While cycling the individual electrodes expand and contract as a function of state of charge. Theoretically at a given state of charge the electrode position should remain identical, regardless of cycle number, but this is not the case. Over extended cycling, architectural anomalies within the cell (for example the current collector tab), act as anchor points, constraining ‘jelly-roll’ movement. By contrast, other features (for example the free volume in the centre of the cell) provide freedom for electrode movement; consequently there is a differential displacement depending both on angular and radial position. We would expect that these irreversible deformations would form faster for a battery being cycled at higher rates and slower for a battery cycled at lower rates.
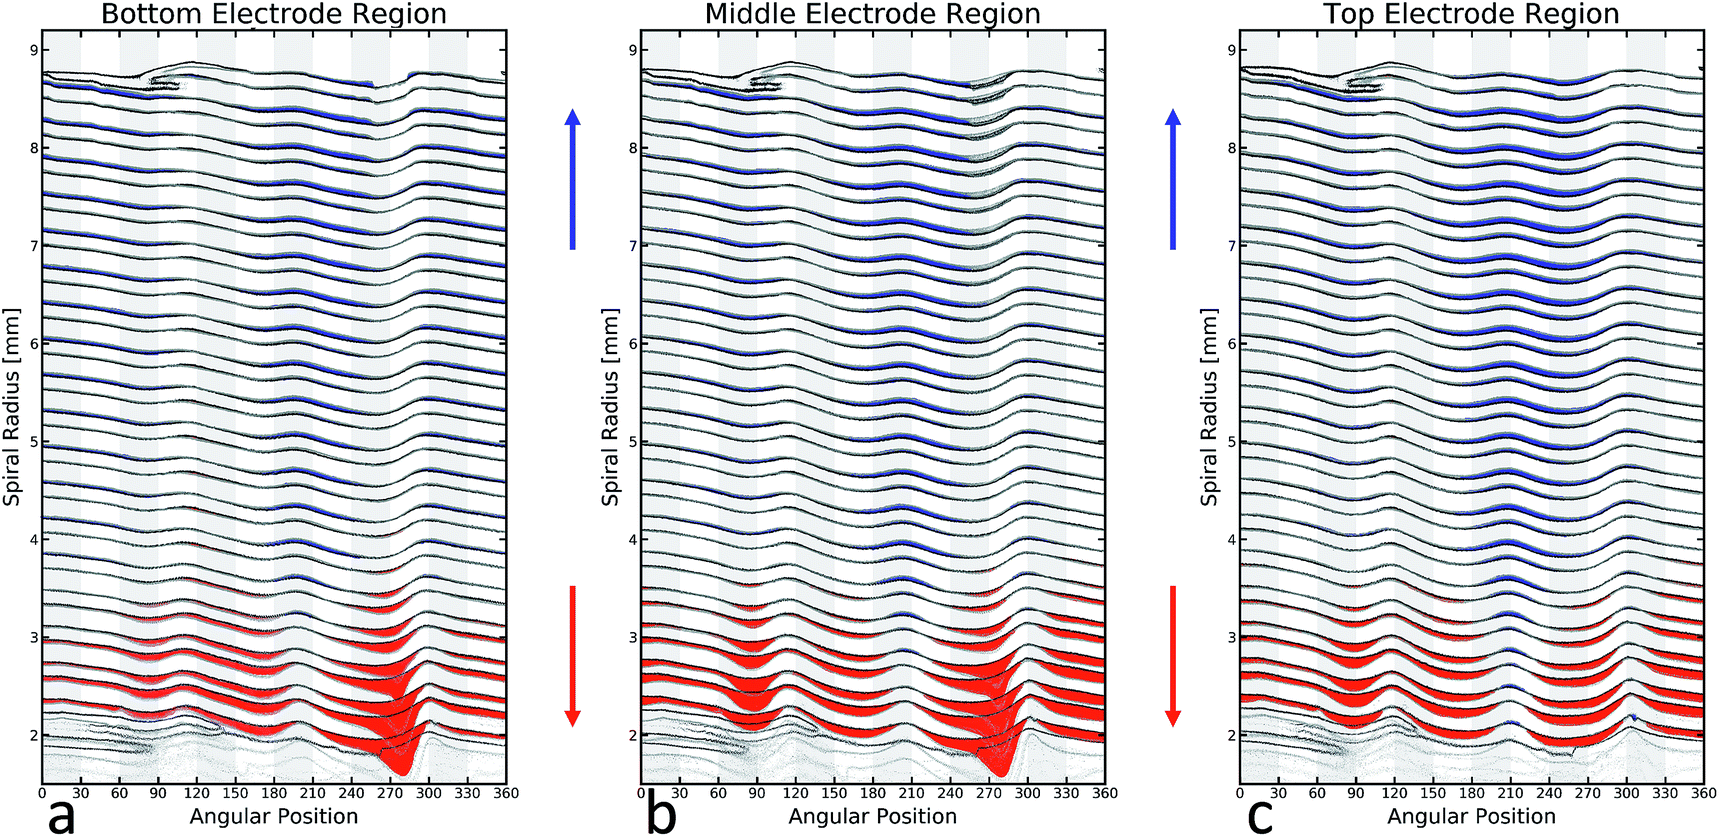 | ||
| Fig. 6 Deformation patterns in three different regions of the cell after cycling. (a) The bottom electrode region, (b) the middle of the electrode and (c) the top. Blue regions indicate net outward deformation and red net inward. | ||
The major changes in the jelly-roll can be seen most clearly through the red and blue regions in Fig. 6. The jelly-roll irreversibly deforms outwardly (blue) into any space left available during the initial winding of the battery. These spaces are created by inconsistent surfaces external to the jelly-roll. The bottom of the battery imaged here is being influenced by two of these features. The first is the external current collector, visible at 270 degrees. On either side of the collector, there is significant outward deformation in the jelly-roll. The second feature is the end of the spiral electrode, which is visible between 90 and 120 degrees, near the top of the figure. Again, after cycling the electrode migrates and deforms into this space. In the top of the cell, the external current collector is no longer present but still has a significant effect. While not an inconsistency in the manner described above, the end of the current collecting tab is a very significant discontinuity in the electrode, and its abrupt termination leads to a very significant void to expand into. Wherever the electrode was unable to deform outwardly it will deform inwardly (red). This leads to the most significant inward deformation to be located in line with the anchor points described above. If sufficiently high forces are applied to inward deformation, a delamination event will occur, as is clearly evident in the cell demonstrated here. This will occur where the highest stresses are being generated which will likely be in line (radially) with the current collector.
Conclusions
The method presented here, and accompanying results, demonstrate a significant advance in understanding Li-ion cell failure and degradation mechanisms. X-ray CT was used to image and examine an 18650 Li-ion cell as it aged and its capacity faded beyond primary use. By virtually unrolling the jelly-roll structure, the failure mechanism was able to be correlated with physical features and defects. Specifically, the location of the eventual failure and delamination in the electrode was near an obvious imperfection in the jelly-roll that was visible before the battery was cycled. Additionally, this nucleation point for eventual failure existed because the electrode was imperfectly coiled due to the presence of the external tab for current collection which also facilitated the uneven stresses which developed in the electrode, causing the failure and delamination in the innermost coil, where those stresses would be the largest. The duration of the X-ray CT performed in this work can be substantially reduced at the expense of some resolution; however, the authors have noted that alternative scanning approaches using lab systems which can take as little as ca. 80 s are sufficient to achieve the required quality to perform the analysis described here. By virtually unrolling the battery, we are able to detect features and trends that would otherwise be very difficult to determine, which has led to improved understanding of how the battery operates and degrades. The rapid scan and calculation time of this technique provides an opportunity to use a similar method as part of an industrial quality assurance scheme. Doing this will increase the confidence a manufacturer can have as to the reliability of the cells produced, potentially enabling a selection process in which cells used in high-stress environments or high-value such as electric vehicles can be tested in-line. The development of such a system, which would impose maximum allowable deviations in the jelly-roll, could also provide pass/fail criteria for recycled cells. This would greatly enhance the prospects for second life applications of cells which have the capability to perform in less demanding, e.g. stationary, applications improving the whole life efficiency and economics of the batteries produced.Conflicts of interest
There are no conflicts to declare.Acknowledgements
This work was supported by the Engineering and Physical Sciences Research Council [EP/R020973/1, EP/K005030/1, EP/M028100/1]; and the Faraday Institution [faraday.ac.uk; EP/S003053/1], grant numbers FIRG003 and FIRG001. PRS and JBR acknowledge the support of the Royal Academy of Engineering under CiET1718\59 and ICRF1718\1\34 respectively.References
- M. Broussely, S. Herreyre, P. Biensan, P. Kasztejna, K. Nechev and R. J. Staniewicz, Aging mechanism in Li ion cells and calendar life predictions, J. Power Sources, 2001, 97–98, 13–21 CrossRef CAS.
- J. Vetter, P. Novák, M. R. Wagner, C. Veit, K.-C. Möller and J. O. Besenhard, et al., Ageing mechanisms in lithium-ion batteries, J. Power Sources, 2005, 147(1–2), 269–281 CrossRef CAS . Available from: https://www.sciencedirect.com/science/article/pii/S0378775305000832.
- J. B. Robinson, E. Engebretsen, D. P. Finegan, J. Darr, G. Hinds and P. R. Shearing, et al., Detection of internal defects in lithium-ion batteries using lock-in thermography, ECS Electrochem. Lett., 2015, 4(9), A106–A109 CrossRef CAS.
- J. Li, E. Murphy and J. Winnick, Studies on the cycle life of commercial lithium ion batteries during rapid charge–discharge cycling, J. Power Sources, 2001, 102, 294–301 CrossRef CAS . Available from: http://www.sciencedirect.com/science/article/pii/S0378775301008217.
- M. Ecker, N. Nieto, S. Käbitz, J. Schmalstieg, H. Blanke and A. Warnecke, et al., Calendar and cycle life study of Li(NiMnCo)O2-based 18650 lithium-ion batteries, J. Power Sources, 2014, 248, 839–851, DOI:10.1016/j.jpowsour.2013.09.143.
- C. R. Birkl, M. R. Roberts, E. McTurk, P. G. Bruce and D. A. Howey, Degradation diagnostics for lithium ion cells, J. Power Sources, 2017, 341, 373–386, DOI:10.1016/j.jpowsour.2016.12.011.
- J. B. Robinson, M. Maier, G. Alster, T. Compton, D. J. L. Brett and P. R. Shearing, Spatially resolved ultrasound diagnostics of Li-ion battery electrodes, Phys. Chem. Chem. Phys., 2019, 21(12), 6354–6361 RSC.
- N. Watrin, B. Blunier and A. Miraoui, Review of adaptive systems for lithium batteries state-of-charge and state-of-health estimation, 2012 IEEE Transp Electrif Conf Expo, ITEC, 2012, vol. 3, pp. 1–6 Search PubMed.
- J. B. Robinson, D. P. Finegan, T. M. M. Heenan, K. Smith, E. Kendrick and D. J. L. Brett, et al., Microstructural Analysis of the Effects of Thermal Runaway on Li-Ion and Na-Ion Battery Electrodes, J. Electrochem. Energy Convers. Storage, 2018, 15(1), 1–9 Search PubMed.
- A. Kriston, A. Pfrang, H. Döring, B. Fritsch, V. Ruiz and I. Adanouj, et al., External short circuit performance of graphite–LiNi1/3Co1/3Mn1/3O2 and graphite–LiNi0.8Co0.15Al0.05O2 cells at different external resistances, J. Power Sources, 2017, 361, 170–181 CrossRef CAS.
- D. P. Finegan, E. Darcy, M. Keyser, B. Tjaden, T. M. M. Heenan and R. Jervis, et al., Identifying the Cause of Rupture of Li-Ion Batteries during Thermal Runaway, Adv. Sci., 2018, 5(1), 1700369 CrossRef PubMed.
- D. P. Finegan, M. Scheel, J. B. Robinson, B. Tjaden, I. Hunt and T. J. Mason, et al., In-operando high-speed tomography of lithium-ion batteries during thermal runaway, Nat. Commun., 2015, 6, 6924 CrossRef CAS PubMed.
- T. Waldmann, S. Gorse, T. Samtleben, G. Schneider, V. Knoblauch and M. Wohlfahrt-Mehrens, A mechanical aging mechanism in lithium-ion batteries, J. Electrochem. Soc., 2014, 161(10), 1742–1747 CrossRef.
- A. Pfrang, A. Kersys, A. Kriston, D. U. Sauer, C. Rahe and S. Käbitz, et al., Long-term cycling induced jelly roll deformation in commercial 18650 cells, J. Power Sources, 2018, 392, 168–175, DOI:10.1016/j.jpowsour.2018.03.065.
- J. Kurfer, M. Westermeier, C. Tammer and G. Reinhart, Production of large-area lithium-ion cells – preconditioning, cell stacking and quality assurance, CIRP Ann. - Manuf. Technol., 2012, 61(1), 1–4, DOI:10.1016/j.cirp.2012.03.101.
- T. Lewiner, H. Lopes, A. W. Vieira and G. Tavares, Efficient Implementation of Marching Cubes' Cases with Topological Guarantees, J. Graph. Tools, 2003, 8(2), 1–15 CrossRef.
- E. Wood, M. Alexander and T. H. Bradley, Investigation of battery end-of-life conditions for plug-in hybrid electric vehicles, J. Power Sources, 2011, 196(11), 5147–5154, DOI:10.1016/j.jpowsour.2011.02.025.
Footnote |
| † Electronic supplementary information (ESI) available: Supplementary information includes specific information about the cell used in the study, detailed information about the cycling parameters used and information about the tomography. See DOI: 10.1039/c9se00500e |
| This journal is © The Royal Society of Chemistry 2019 |