
 Open Access Article
 This Open Access Article is licensed under a Creative Commons Attribution-Non Commercial 3.0 Unported Licence
Laser cleavable probes for in situ multiplexed glycan detection by single cell mass spectrometry†
Jing
Han
ab,
Xi
Huang
a,
Huihui
Liu
a,
Jiyun
Wang
a,
Caiqiao
Xiong
 *a and
Zongxiu
Nie
*abc
*a and
Zongxiu
Nie
*abc
aBeijing National Laboratory for Molecular Sciences, Key Laboratory of Analytical Chemistry for Living Biosystems, Institute of Chemistry, Chinese Academy of Sciences, Beijing 100190, China. E-mail: znie@iccas.ac.cn; xiongcq@iccas.ac.cn
bUniversity of the Chinese Academy of Sciences, Beijing 100049, China
cNational Center for Mass Spectrometry in Beijing, Beijing 100049, China
First published on 17th October 2019
Abstract
Glycans binding on the cell surface through glycosylation play a key role in controlling various cellular processes, and glycan analysis at a single-cell level is necessary to study cellular heterogeneity and diagnose diseases in the early stage. Herein, we synthesized a series of laser cleavable probes, which could sensitively detect glycans on single cells and tissues by laser desorption ionization mass spectrometry (LDI-MS). This multiplexed and quantitative glycan detection was applied to evaluate the alterations of four types of glycans on breast cancer cells and drug-resistant cancer cells at a single-cell level, indicating that drug resistance may be related to the upregulation of glycan with a β-D-galactoside (Galβ) group and Neu5Aca2-6Gal(NAc)-R. Moreover, the glycan spatial distribution in cancerous and paracancerous human tissues was also demonstrated by MS imaging, showing that glycans are overexpressed in cancerous tissues. Therefore, this single-cell MS approach exhibits promise for application in studying glycan functions which are essential for clinical biomarker discovery and diagnosis of related diseases.
Introduction
Glycans decorate proteins and lipids through glycosylation on cells, and determine the localization, activity and functions of proteins or lipids and thereby play a key role in controlling various cellular processes,1–4 such as cell–cell communication, interaction with pathogens, binding of chemical messengers and response to environmental perturbations. The aberrant expression of glycans is often associated with various human diseases, such as prostate cancer and colorectal cancer.5–9 Therefore, the analysis of glycans can offer insight into glycosylation functions and contribute to diagnosis and targeted therapy.Traditional technologies limited glycan analysis to the provided data that are averaged over a bulk cell population,10–13 but even genetically identical cells present in the same microenvironment can show strong variations in biochemical compositions and even in phenotypes.14–16 The shift from bulk to single-cell analysis is necessary in developing glycan profiling, which plays an essential role in measuring cell-to-cell heterogeneity within a population and diagnosing diseases in the early stage.17–19 However, the small volume (approximately one picoliter) of chemical contents within individual cells and isolation of single cells from cell cultures or tissues are challenges in single-cell analysis.20,21 With high sensitivity, high throughput and multiplexed capabilities, mass spectrometry (MS) is becoming a major analytical platform for single-cell metabolomics and proteomics.22–27 Unfortunately, the low ionization efficiency and complicated MS pattern of glycans limit the application of MS in glycan profiling at a single-cell level.28–30 Therefore, there is great demand to develop a single-cell MS approach which could analyse multiple glycans sensitively at the single-cell level and provide spatial information of glycans on tissues.
Herein, a multiplexed and sensitive glycan detection approach based on laser cleavable probes is developed. In this method, four probes with different mass tags were synthesized, which can be combined with lectins (i.e., the specifically carbohydrate-binding protein) for the detection of four kinds of glycans at the single-cell and tissue level. The scaffold of these probes comprises three major components as depicted in Scheme 1. The mass tag (purple) with the laser cleavage site (green) which could be cleaved under 355 nm laser irradiation was linked to the reactive site (blue) bearing the amine-selective N-hydroxysuccinimide (NHS) moiety. The probes were connected to the lectins by the reaction of the amino groups of lectins with the NHS moiety of the probes. The lectin–probe conjugates selectively recognize and form a bond with the glycans on cells and tissues. After irradiation using a 355 nm laser, the C–S bond could be broken efficiently,31 and thiochromenium ions are released for the sensitive LDI-MS detection. Therefore, the multiplexed analysis of glycans was converted to the corresponding mass tags, which overcomes the low ionization efficiency of glycans. This novel strategy was applied to evaluate the alterations of glycans on the breast carcinoma cell line MCF-7 and its drug resistance cell line MCF-7R to explore the relationship between drug resistance and glycans at the single-cell level. Furthermore, the MS imaging based on this approach can provide the glycan spatial distribution in fresh human breast tissues, which showed different expression levels of four types of glycans in cancerous and paracancerous tissues.
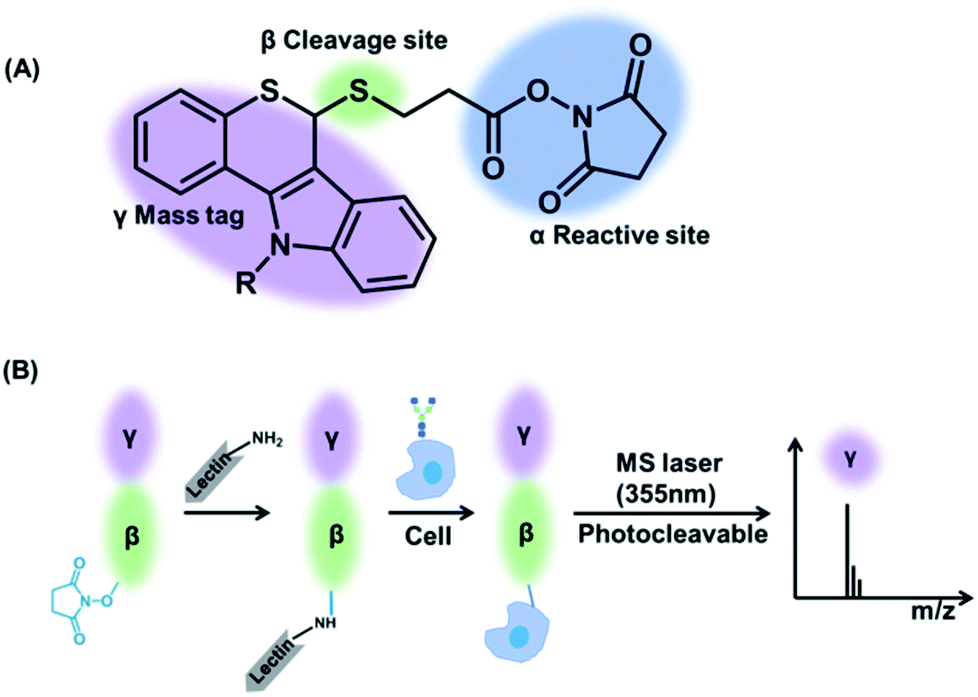 | ||
| Scheme 1 (A) The structure of laser cleavable probes. The reactive site containing an amine-specific moiety (α) is connected to the mass tag (γ) by a cleavage site (β). (B) The whole process of analysis of glycans using the laser cleavable probes. | ||
Results and discussion
Synthesis and characterization of laser cleavable probes
Four laser cleavable probes 1–4 as mass tags were chosen to detect glycans for the first time, and the detailed syntheses are provided in the ESI (Scheme S1 and Fig. S1–S8†).31 We first tested the laser cleavable efficiency of these four probes under LDI-MS conditions (Fig. 1). With the irradiation of a 355 nm laser, the C–S bond was cleaved, accompanied by the release of thiochromenium ions for LDI MS detection. Every probe showed a clear background and a satisfactory signal-to-noise ratio. For the multiplexed analysis, these four probes were mixed in equal molar concentrations and then analysed by LDI-MS (Fig. S9†). A 14 Da mass difference can be sufficiently resolved by time-of-flight (TOF) MS analysis, and thus multiplex analysis could be achieved. For the glycan detection, four types of lectins, including concanavalin A (ConA), ricinus communis agglutinin (RCA120), wheat germ agglutinin (WGA) and sambucus nigra (SNA), were chosen to bind specifically to the α-D-mannosyl and α-D-glucosyl groups,32,33 β-D-galactoside (Galβ) residue group,34,35N-acetylglucosamine and sialic acids,36,37 and Neu5Aca2-6Gal(NAc)-R,38 respectively. The diffusion coefficients of the probes became smaller after the addition of lectins (Table S1†), which is because these probes could covalently bind to lectins via amide condensation between the NHS ester and the amino group.39,40 As shown in circular dichroism (Fig. S10†), the reaction between the probes and lectins didn't affect the structure and activity of lectins.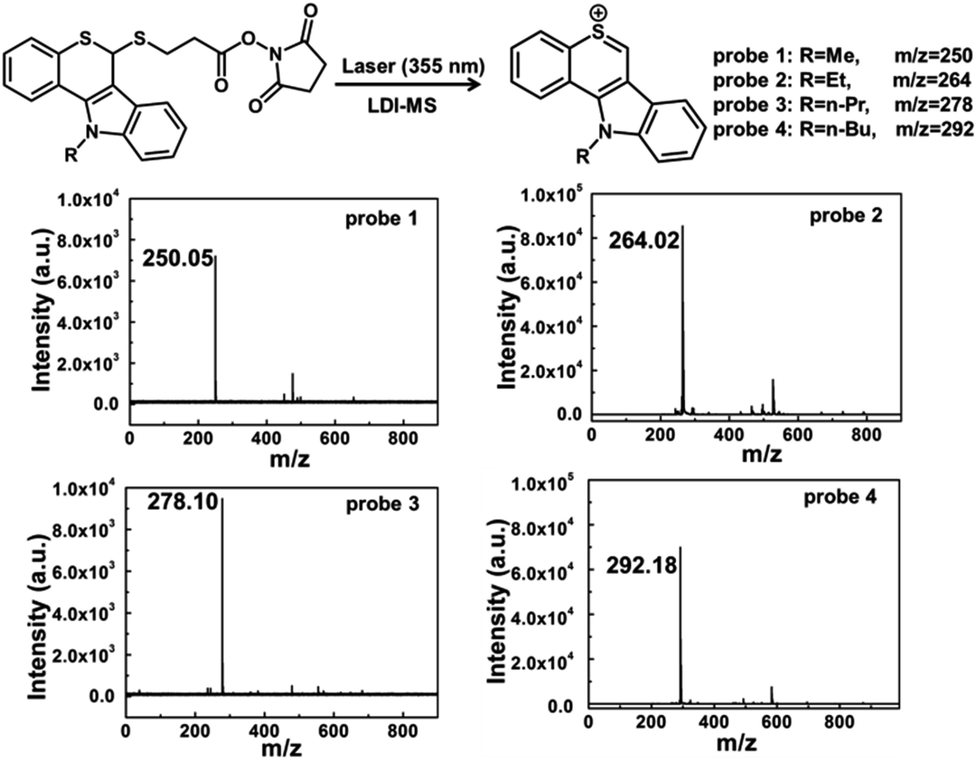 | ||
| Fig. 1 LDI-MS spectra of four laser cleavable probes 1–4. With the irradiation of a 355 nm laser, the C–S bond was cleaved, and the mass tags were produced for LDI-MS detection. | ||
In situ analysis of glycans
To evaluate the recognition ability of the conjugates, probe 1 bound to fluorescein isothiocyante (FITC)-labelled ConA was employed as a model to incubate with the breast carcinoma cell line MCF-7 and its drug resistance cell line MCF-7R. Confocal imaging results (Fig. S11†) showed that both MCF-7 and MCF-7R cells exhibited strong fluorescence signals on the membrane after incubation with FITC-labelled ConA–probe 1. These results demonstrated that the lectin–probe conjugate is an effective tool for glycan analysis on the cell membrane. Flow cytometry analysis also showed a distinct fluorescence increment of the cells after being cultured with FITC-labelled ConA–probe 1, which could be distinguished from the control cells (Fig. S12A†). For the monosaccharide inhibition assay, cells were incubated with FITC-labelled ConA–probe 1 (α-D-mannosyl and α-D-glucosyl groups binding lectin), which were pre-treated with free α-methyl-mannoside, α-methyl-glucoside and D-galactose. Flow cytometry analysis and confocal imaging indicated that α-methyl-mannoside and α-methyl-glucoside inhibited the binding of ConA–probe 1 to the cell surface, while the nonspecific D-galactose showed no inhibition (Fig. S12B and S13†). Hence, the recognition between the lectin–probe conjugates and glycans on the cell is verified to be specific.Glycan alterations were also investigated by treatment with the N-glycan inhibitor tunicamycin (TM), which specifically inhibits the formation of N-glycan with a pentasaccharide core of three mannose and two N-acetylglucosamine (GlcNAc2Man3).41 Cells were pre-treated with varied concentrations of TM for 24 h, and then stained with the ConA–probe 1 conjugate for reflecting mannosyl expression. As shown in the mass spectra (Fig. S14†), the expression of N-glycan in cells decreased along with the increase in the concentration of TM, which is correlated with the expression level of the α-mannosyl groups detected by flow cytometry analysis (Fig. S15†). It was also indicated that TM inhibited cell proliferation in a dose-dependent manner in the cell viability analysis (Fig. S16†). Therefore, this specific method based on laser cleavable probes could provide a valuable tool for screening glycan alternations.
For in situ glycan detection on cells, MCF-7 cells were cultured for 2 days, then trypsinized and incubated with four lectin–probe conjugates. As shown in Fig. 2 and S17–S19,† these four mass tags could be detected by LDI-MS with excellent sensitivity. Albumin from bovine serum (BSA) was chosen as a control protein to test the specificity of lectin–probe conjugates. No MS signal was detected in control experiments, indicating that the lectin–probe conjugates are specific to glycans on the cells. The probes were incubated with cells directly, and again no signal was observed. Equal molar amounts of the four lectin–probe conjugates were mixed and incubated with MCF-7 and MCF-7R cells according to the above steps. Four obvious peaks of mass tags could be clearly detected by LDI-MS, demonstrating the feasibility of this novel strategy for multiplexed glycan detection (Fig. 2D and S20†). Further, this method was used for semi-quantitation of cells. Cells were incubated with RCA120–probe 2 as per the above steps. ConA–probe 1 as the internal standard was mixed with the cells, and then directly analyzed by LDI-MS (Fig. S21†). The detection limit is 27 cells per mL according to the 3σ rule, and 100 μL cell suspensions were used, and thus 2.7 cells can be detected. Such a high sensitivity is attributed to the effective breaking and the easy ionization of our cleavable probes.
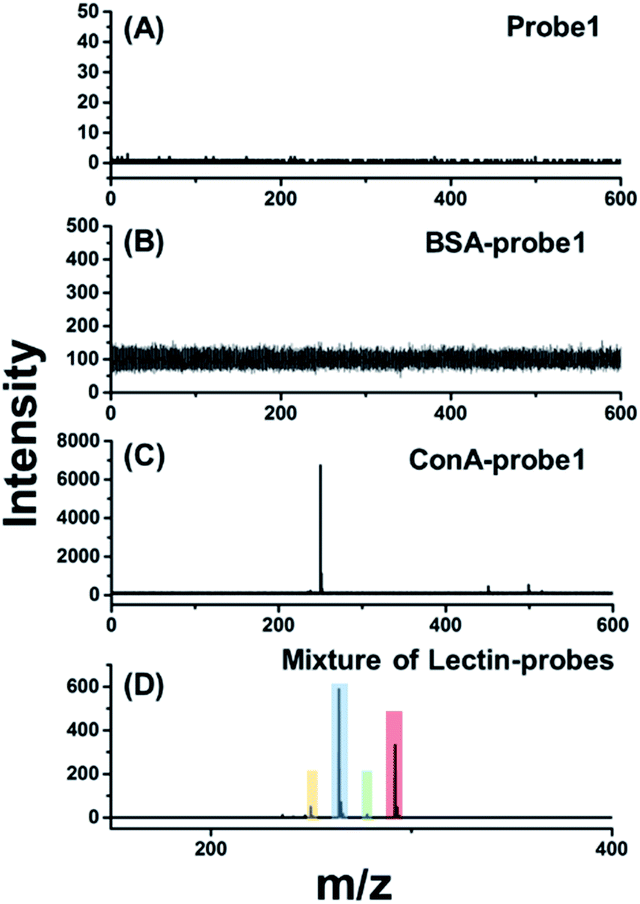 | ||
| Fig. 2 LDI-MS analysis of the cell surface glycans based on laser cleavable probes. The mass spectrum of MCF-7 cells labelled with (A) probe 1, (B) BSA–probe 1, (C) ConA–probe 1 and (D) an equal molar mixture of the four lectin–probes. | ||
Measurement of cell surface glycans at a single-cell level
In order to investigate if the glycan pattern would be related to the drug resistance at a single-cell level, our approach was applied on the breast carcinoma cell line MCF-7 and its drug resistance cell line MCF-7R. Cells were seeded on indium tin oxide (ITO)-coated glass slides for 24 h, and then incubated with lectin–probes for LDI-MS analysis. As can be seen from the optical imaging (Fig. S22†), single cells disappeared after LDI-MS analysis, even the close cells about 20 μm from each other (two-fold greater than the diameter of the laser probe). Histograms of ion abundances corresponding to the α-D-mannosyl and α-D-glucosyl groups (m/z 250.05), Galβ group (m/z 264.02), N-acetylglucosamine and sialic acids (m/z 278.10) and Neu5Aca2-6Gal(NAc)-R (m/z 292.18) were plotted for MCF-7 and MCF-7R cells. As shown in Fig. 3, the expression of glycans with the Galβ group (m/z 264.02) and Neu5Aca2-6Gal(NAc)-R (m/z 292.18) on MCF-7R cells was obviously higher than those on MCF-7 cells at a single-cell level (Fig. 3B and D), but glycans with α-D-mannosyl and α-D-glucosyl groups (m/z 250.05) and N-acetylglucosamine and sialic acids (m/z 278.10) were expressed almost the same on both MCF-7R and MCF-7 single cells (Fig. 3A and C). These results indicated that the drug resistance may be related to the obvious upregulation of glycan with the Galβ group and Neu5Aca2-6Gal(NAc)-R.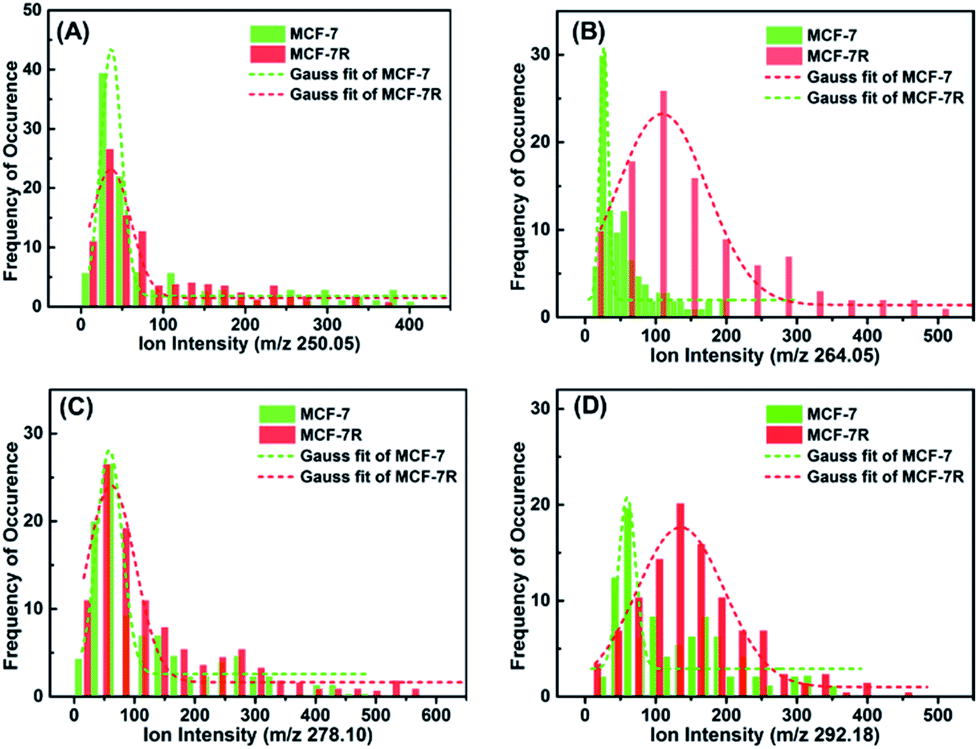 | ||
| Fig. 3 Histograms of ion abundances of the four lectin–probes (m/z 250.05, 264.02, 278.10 and 292.18) from MCF-7 (n = 100) and MCF-7R cells (n = 100), which corresponded to glycans with the α-D-mannosyl and α-D-glucosyl groups, Galβ group, N-acetylglucosamine, sialic acids and Neu5Aca2-6Gal(NAc)-R, respectively. These results show that drug resistance selectively influences the expression of glycans. | ||
To quantify the ratio of various glycans on the single cell surface by LDI-MS, the relative ionization efficiency of these mass tags must be considered.42 To test the ionization efficiency, equal molar amounts of ConA–probe 1 and RCA120–probe 2 were mixed with the cell lysate and analysed by LDI-MS. RCA120–probe 2 was more readily ionized, giving rise to a molecular ion abundance ratio (RCA120–probe 2/ConA–probe 1) of 1.28 ± 0.44, which could be used as the correction factor (CF) to determine the relative quantity of glycans on the cell. After correction of the experimentally observed ratio of 9.59 ± 2.34 by a CF of 1.28 ± 0.23, the amount of glycans with the Galβ group was determined to be 7.49 ± 0.45 times greater than that of glycans with α-D-mannosyl and α-D-glucosyl groups on the single MCF-7 cell surface. A similar analysis was done for each of the other lectin–probes in comparison to ConA–probe 1. As shown in Fig. S23–S25 and Table S2,† it was found that the expression level of glycans with Galβ and Neu5Aca2-6Gal(NAc)-R groups is higher than that of glycans with α-D-mannosyl and α-D-glucosyl groups, N-acetylglucosamine and sialic acids on the surface of both MCF-7 and MCF-7R at a single-cell level, which was consistent with the above results averaged over an entire cell population (Fig. 2D and S20†). These results demonstrated the feasibility of this method for quantitative detection of multiple glycans at a single-cell level.
MS imaging of fresh tissues
The visible distribution of glycans in cancerous and paracancerous tissues obtained by mass spectrometry imaging is promising in the diagnosis of various cancers.43–45 However, it's still a challenge in glycan imaging owing to the low ionization efficiency and complicated MS pattern of glycans. To overcome these limitations, we applied four conjugates (ConA–probe 1, RCA120–probe 2, WGA–probe 3 and SNA–probe 4) to breast cancer tissues in MS imaging. As shown in Fig. 4, the expression of these four types of glycans was different. The expression of glycans with Galβ and Neu5Aca2-6Gal(NAc)-R groups was higher than that of glycans with α-D-mannosyl and α-D-glucosyl groups and N-acetylglucosamine on the cancerous tissues, which is consistent with the above cell analysis. Additionally, the distribution of glycans is different between the cancerous and paracancerous tissues. Glycans with α-D-mannosyl, α-D-glucosyl, Galβ, N-acetylglucosamine, sialic acid and Neu5Aca2-6Gal(NAc)-R groups in breast cancer were overexpressed compared to that in paracancerous tissues. The co-localization imaging of these four types of glycans could be simultaneously achieved in single MS scanning using a mixture of four lectin–probes, which indicated the capability of this method to detect alterations of multiple glycans.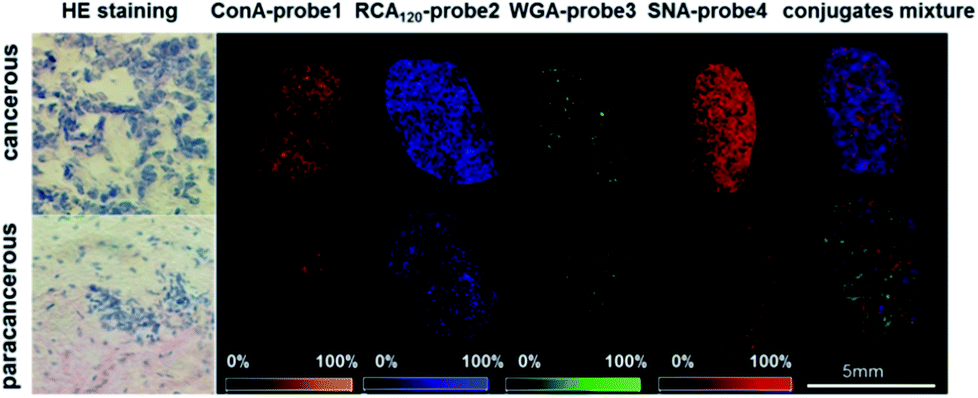 | ||
| Fig. 4 The MS imaging of ConA–probe 1 (orange): mannose; RCA120–probe 2 (blue): Galβ group; WGA–probe 3 (green): N-acetylglucosamine and sialic acids; and SNA–probe 4 (red): Neu5Aca2-6Gal(NAc)-R; and the co-localized MS imaging of these four glycans using an equal molar mixture of lectin–probes. The mass spectrum is shown in the ESI (Fig. S26†). HE staining is short for hematoxylin and eosin staining. | ||
Conclusion
In conclusion, a multiplexed glycan detection approach based on laser cleavable probes has been developed. Four laser cleavable probes with a 14 Da mass difference were synthesized to covalently conjugate to lectins, which could recognize specific glycans. Owing to the efficient ionization of mass tags, this sensitive approach could analyse the glycans at a single-cell level, which overcomes the limit of low ionization efficiency and complicated MS pattern of glycans. This method investigated the relationship between the glycan pattern and drug resistance at a single-cell level, which can be applied to the prediction of drug resistance phenotypes prior to chemotherapy. After correcting the ionization efficiencies, the ion abundances of their respective mass tag ion peaks could be used for relative quantification of multiple glycans on the cell surface. Moreover, this novel method was further used for imaging glycan distribution in human breast tissue, characterizing the alterations of glycans, which could be a tool for screening cancer progression. This strategy presents a sensitive and relatively quantitative platform for multiplexed glycan detection on single cells and tissues, which contributes to the understanding of glycan-related biological processes and correlation of glycan patterns with disease states for clinical diagnosis and treatment.Conflicts of interest
There are no conflicts to declare.Acknowledgements
This work was supported by grants from the National Natural Science Foundation of China (Grant No. 21625504, 21827807, 21621062 and 21790390/21790392) and Chinese Academy of Sciences.Notes and references
- B. Wollscheid, D. Bausch-Fluck, C. Henderson, R. O'Brien, M. Bibel, R. Schiess, R. Aebersold and J. D. Watts, Nat. Biotechnol., 2009, 27, 378–386 CrossRef CAS PubMed
.
- H. E. Murrey and L. C. Hsieh-Wilson, Chem. Rev., 2008, 108, 1708–1731 CrossRef CAS PubMed
- Q. Li, Y. Xie, G. Xu and C. B. Lebrilla, Chem. Sci., 2019, 10, 6199–6209 RSC
- D. P. Gamblin, E. M. Scanlan and B. G. Davis, Chem. Rev., 2009, 109, 131–163 CrossRef CAS PubMed
- Y. Haga, M. Uemura, S. Baba, K. Inamura, K. Takeuchi, N. Nonomura and K. Ueda, Anal. Chem., 2019, 91, 2247–2254 CrossRef CAS PubMed
- K. Ohtsubo and J. D. Marth, Cell, 2006, 126, 855–868 CrossRef CAS PubMed
- M. K. Sethi, W. S. Hancock and S. Fanayan, Acc. Chem. Res., 2016, 49, 2099–2106 CrossRef CAS PubMed
- H. Xiao, E. C. Woods, P. Vukojicic and C. R. Bertozzi, Proc. Natl. Acad. Sci. U. S. A., 2016, 113, 10304–10309 CrossRef CAS PubMed
- S. M. Chen, T. LaRoche, D. Hamelinck, D. Bergsma, D. Brenner, D. Simeone, R. E. Brand and B. B. Haab, Nat. Methods, 2007, 4, 437–444 CrossRef CAS PubMed
- W. Ma, S. Xu, H. Nie, B. Hu, Y. Bai and H. Liu, Chem. Sci., 2019, 10, 2320–2325 RSC
- Z. He, Q. Chen, F. Chen, J. Zhang, H. Li and J. M. Lin, Chem. Sci., 2016, 7, 5448–5452 RSC
- L. Feng, S. Hong, J. Rong, Q. You, P. Dai, R. Huang, Y. Tan, W. Hong, C. Xie, J. Zhao and X. Chen, J. Am. Chem. Soc., 2013, 135, 9244–9247 CrossRef CAS PubMed
- Y. Chen, L. Ding and H. Ju, Acc. Chem. Res., 2018, 51, 890–899 CrossRef CAS PubMed
- E. K. Neumann, T. D. Do, T. J. Comi and J. V. Sweedler, Angew. Chem., Int. Ed., 2019, 58, 9348–9364 CrossRef CAS PubMed
- J. Eberwine, J. Y. Sul, T. Bartfai and J. Kim, Nat. Methods, 2014, 11, 25–27 CrossRef CAS PubMed
- B. Yang, N. H. Patterson, T. Tsui, R. M. Caprioli and J. L. Norris, J. Am. Soc. Mass Spectrom., 2018, 29, 1012–1020 CrossRef CAS PubMed
- X. Chen, J. C. Love, N. Navin, L. Pachter, M. Stubbington, V. Svensson, J. V. Sweedler and S. A. Teichmann, Nat. Biotechnol., 2016, 34, 1111–1118 CrossRef CAS PubMed
- I. Tirosh, A. S. Venteicher, C. Hebert, L. E. Escalante, A. P. Patel, K. Yizhak, J. M. Fisher, C. Rodman, C. Mount, M. G. Filbin, C. Neftel, N. Desai, J. Nyman, B. Izar, C. C. Luo, J. M. Francis, A. A. Patel, M. L. Onozato, N. Riggi, K. J. Livak, D. Gennert, R. Satija, B. V. Nahed, W. T. Curry, R. L. Martuza, R. Mylvaga-nam, A. J. Iafrate, M. P. Frosch, T. R. Golub, M. N. Rivera, G. Getz, O. Rozenblatt-Rosen, D. P. Cahill, M. Monje, B. E. Bernstein, D. N. Louis, A. Regev and M. L. Suva, Nature, 2016, 539, 309–313 CrossRef PubMed
- M. Tabatabaei, G. Q. Wallace, F. A. Caetano, E. R. Gillies, S. S. G. Fergusonb and F. Lagugne-Labarthet, Chem. Sci., 2016, 7, 575–582 RSC
- M. Crow, A. Paul, S. Ballouz, Z. J. Huang and J. Gillis, Genome Biol., 2016, 17, 101 CrossRef PubMed
- L. Zhang and A. Vertes, Angew. Chem., Int. Ed., 2018, 57, 4466–4477 CrossRef CAS PubMed
- S. S. Rubakhin and J. V. Sweedler, Nat. Protoc., 2007, 2, 1987–1997 CrossRef CAS PubMed
- A. J. Ibáñeza, S. R. Fagerera, A. M. Schmidtb, P. L. Urbanc, K. Jefimovsd, P. Geigera, R. Dechante, M. Heinemannf and R. Zenobi, Proc. Natl. Acad. Sci. U. S. A., 2013, 110, 8790–8794 CrossRef PubMed
- T. J. Comi, T. D. Do, S. S. Rubakhin and J. V. Sweedler, J. Am. Chem. Soc., 2017, 139, 3920–3929 CrossRef CAS PubMed
- R. Liu, G. Zhang and Z. Yang, Chem. Commun., 2019, 55, 616–619 RSC
- C. Lombard-Banek, S. A. Moody and P. Nemes, Angew. Chem., Int. Ed., 2016, 55, 2454–2458 CrossRef CAS PubMed
- L. Sun, K. M. Dubiak, E. H. Peuchen, Z. Zhang, G. Zhu, P. W. Huber and N. J. Dovichi, Anal. Chem., 2016, 88, 6653–6657 CrossRef CAS PubMed
- Y. Feng, B. Chen, Q. Yu, X. Zhong, D. C. Frost, C. Ikonomidou and L. Li, Anal. Chem., 2019, 91, 3141–3146 CrossRef CAS PubMed
- N. Yamakawa, J. Vanbeselaere, L. Y. Chang, S. Y. Yu, L. Ducrocq, A. Harduin-Lepers, J. Kurata, K. F. Aoki-Kinoshita, C. Sato, K. H. Khoo, K. Kitajima and Y. Guerardel, Nat. Commun., 2018, 9, 4647–4661 CrossRef PubMed
- G. Xu, M. Wong, Q. Li, D. Park, Z. Chenga and C. B. Lebrilla, Chem. Sci., 2019, 10, 6992–7002 RSC
- N. Kang, J. M. Lee, A. Jeon, H. B. Oh and B. Moon, Tetrahedron, 2016, 72, 5612–5619 CrossRef CAS
- C. P. Swaminathan, N. Surolia and A. Surolia, J. Am. Chem. Soc., 1998, 120, 5153–5159 CrossRef CAS
- J. B. Sumner, N. Gralën and I. B. Eriksson-Quensel, Science, 1938, 87, 395–396 CrossRef CAS PubMed
- R. Ramasamy, Immunol. Cell Biol., 1987, 65, 147–152 CrossRef CAS PubMed
- S. G. Spain and N. R. Cameron, Polym. Chem., 2011, 2, 1552–1560 RSC
- F. Gabor, A. Schwarzbauer and M. Wirth, Int. J. Pharm., 2002, 237, 227–239 CrossRef CAS PubMed
- A. Yamamoio, R. Masaki and Y. Tashiro, J. Histochem. Cytochem., 1990, 38, 573–580 CrossRef PubMed
- D. J. Taatjes, J. Roth, W. Peumans and I. J. Goldstein, Histochem. J., 1988, 20, 478–490 CrossRef CAS PubMed
- C. L. Allen and J. M. J. Williams, Chem. Soc. Rev., 2011, 40, 3405–3413 RSC
- M. J. Humphrey and R. A. Chamberlin, Chem. Rev., 1997, 97, 2243–2266 CrossRef PubMed
- A. D. Elbein, Annu. Rev. Biochem., 1987, 56, 497–534 CrossRef CAS PubMed
- Z. J. Zhu, P. S. Ghosh, O. R. Miranda, R. W. Vachet and V. M. Rotello, J. Am. Chem. Soc., 2008, 130, 14139–14143 CrossRef CAS PubMed
- A. Rmpp, S. Guenther, Y. Schober, O. Schulz, Z. Takats, W. Kummer and B. Spengler, Angew. Chem., Int. Ed., 2010, 49, 3834–3838 CrossRef PubMed
- B. Heijs, S. Holst, I. H. Briaire-de Bruijn, G. W. van Pelt, A. H. de Ru, P. A. van Veelen, R. R. Drake, A. S. Mehta, W. E. Mesker, R. A. Tollenaar, J. V. M. G. Bovee, M. Wuhrer and L. A. McDonnell, Anal. Chem., 2016, 88, 7745–7753 CrossRef CAS PubMed
- S. Holst, B. Heijs, N. de Haan, R. J. M. van Zeijl, I. H. Briaire-de Bruijn, G. W. van Pelt, A. S. Mehta, P. M. Angel, W. E. Mesker, R. A. Tollenaar, R. R. Drake, J. V. M. G. Bovee, L. A. McDonnell and M. Wuhrer, Anal. Chem., 2016, 88, 5904–5913 CrossRef CAS PubMed
Footnote |
| † Electronic supplementary information (ESI) available. See DOI: 10.1039/c9sc03912k |
| This journal is © The Royal Society of Chemistry 2019 |