
 Open Access Article
 This Open Access Article is licensed under a Creative Commons Attribution-Non Commercial 3.0 Unported Licence
Diverse π–π stacking motifs modulate electrical conductivity in tetrathiafulvalene-based metal–organic frameworks†
Lilia S.
Xie
 a,
Eugeny V.
Alexandrov
bc,
Grigorii
Skorupskii
a,
Davide M.
Proserpio
bd and
Mircea
Dincă
*a
a,
Eugeny V.
Alexandrov
bc,
Grigorii
Skorupskii
a,
Davide M.
Proserpio
bd and
Mircea
Dincă
*a
aDepartment of Chemistry, Massachusetts Institute of Technology, Cambridge, MA 02139, USA. E-mail: mdinca@mit.edu
bSamara Center for Theoretical Material Science (SCTMS), Samara State Technical University, Molodogvardeyskaya St. 244, Samara, 443100, Russia
cSCTMS, Samara University, Moskovskoe shosse 34, 443086, Samara, Russia
dDipartimento di Chimica, Università degli Studi di Milano, Milano, 20133, Italy
First published on 1st August 2019
Abstract
We report three electrically conductive metal–organic frameworks (MOFs) based on a tetrathiafulvalene linker and La3+. Depending on the solvent ratios and temperatures used in their solvothermal synthesis, these MOFs crystallize with different topologies containing distinct π–π stacking sequences of the ligand. Notably, their transport properties correlate rationally with the stacking motifs: longer S⋯S contact distances between adjacent ligands coincide with lower electrical conductivities and higher activation energies. Diffuse reflectance spectroscopic measurements reveal ligand-based intervalence charge transfer bands in each phase, implicating charge delocalization among mixed-valent tetrathiafulvalene units as the dominant mode of transport. Overall, these frameworks demonstrate how tuning the intermolecular interactions in MOFs serves as a route towards controlling their physical properties.
Introduction
The formation of strong metal–ligand bonds is considered to be the driving force behind the growth of most metal–organic frameworks (MOFs).1–4 Indeed, the field of reticular chemistry is based on the conservation of the inorganic secondary building units (SBUs) of MOFs across different linker lengths and functionalities.5–8 These design principles have enabled the synthesis of families of MOFs with predictable structures and targeted properties, such as selective gas sorption9–12 and ligand-based catalytic activity.13–15On the other hand, many metal–ligand combinations that can yield multiple MOF polymorphs have complex phase spaces that preclude straightforward application of reticular chemistry principles. In addition, the deliberate design of systems in which noncovalent ligand–ligand interactions compete energetically with covalent metal–ligand bond formation is relatively unexplored. Nevertheless, many desirable properties, such as electrical conductivity16–19 and luminescence18,20–22 can be realized in MOFs based on electroactive, strongly interacting ligands. Moreover, the specific arrangements of ligands in extended MOF structures can engender emergent properties that are not accessible in the molecular counterparts.23–25 Thus, strategies to tune these noncovalent ligand–ligand interactions would allow for better control over the growth and physical properties of the resulting MOFs.
The tetrathiafulvalene tetrabenzoate (TTFTB) ligand tends to form extensive π–π interactions in extended structures, imbuing MOFs with a diverse suite of properties,26 including electrical16,17,27 and proton28 conductivity, and redox-dependent breathing behaviour in response to guest molecules.29,30 Recent work from our group has shown that supramolecular ligand interactions, rather than metal–ligand bonds, surprisingly drive the formation of new topologies in two TTFTB MOF structures based on Mg2+,31 and Tm3+, Yb3+ and Lu3+,32 respectively. This work provided hints that the manipulation of ligand–ligand interactions rather than SBU formation could provide a more general pathway for realizing new structures and topologies. In particular, we hypothesized that combining the TTFTB ligand with larger lanthanides27,33 would allow us to further expand the range of π–π stacking interactions due to the highly flexible coordination environment of the lanthanides. These new structures would allow us to further interrogate the relationships among growth conditions, supramolecular interactions, and electrical and optical properties.
Here, we show that varying the solvent mixture and temperature in the reaction of the TTFTB ligand with La3+ leads to the isolation of three frameworks with distinct topologies and π–π stacking motifs. Their electrical conductivities, ranging from 10−9 to 10−6 S cm−1 at room temperature, show a striking correlation with the S⋯S contact distances. Variable temperature conductivity and diffuse reflectance spectroscopy measurements corroborate the influence of π–π interactions on the electrical properties. These results demonstrate how controlling ligand–ligand interactions can dictate the physical properties of MOFs in a rational manner.
Results and discussion
Crystal structures and π–π stacking motifs
Combining tetrathiafulvalene tetrabenzoic acid (H4TTFTB) and La(NO3)3·6H2O in different ratios of N,N-dimethylformamide (DMF), ethanol (EtOH) and H2O at temperatures ranging from 50 to 65 °C led to the crystallization of three distinct MOFs (Scheme 1), whose structures were determined using single crystal X-ray diffraction (SCXRD) (Tables S1–S3†).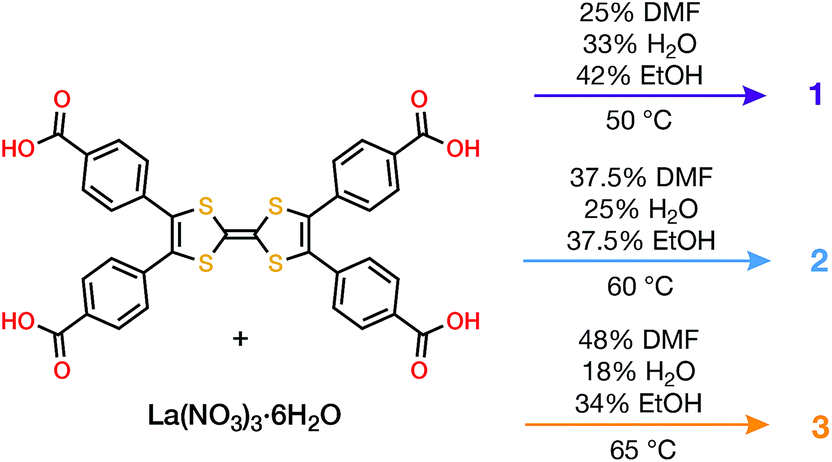 | ||
| Scheme 1 Conditions for solvothermal growth of 1, 2 and 3. | ||
All three phases have broad commonalities in their structures. One-dimensional (1D) chains of La atoms coordinated by ligand carboxylates (and solvent molecules) comprise the inorganic SBUs. The TTF units of the ligands organize into 1D stacks running parallel to the La chains. Finally, the TTF stacks and La chains line 1D solvent-filled channels, which extend throughout each of the phases. Despite these structural resemblances, as well as similarities in their synthesis conditions and formulas, the TTFTB stacking motifs in each of these phases differ markedly (Fig. 1).
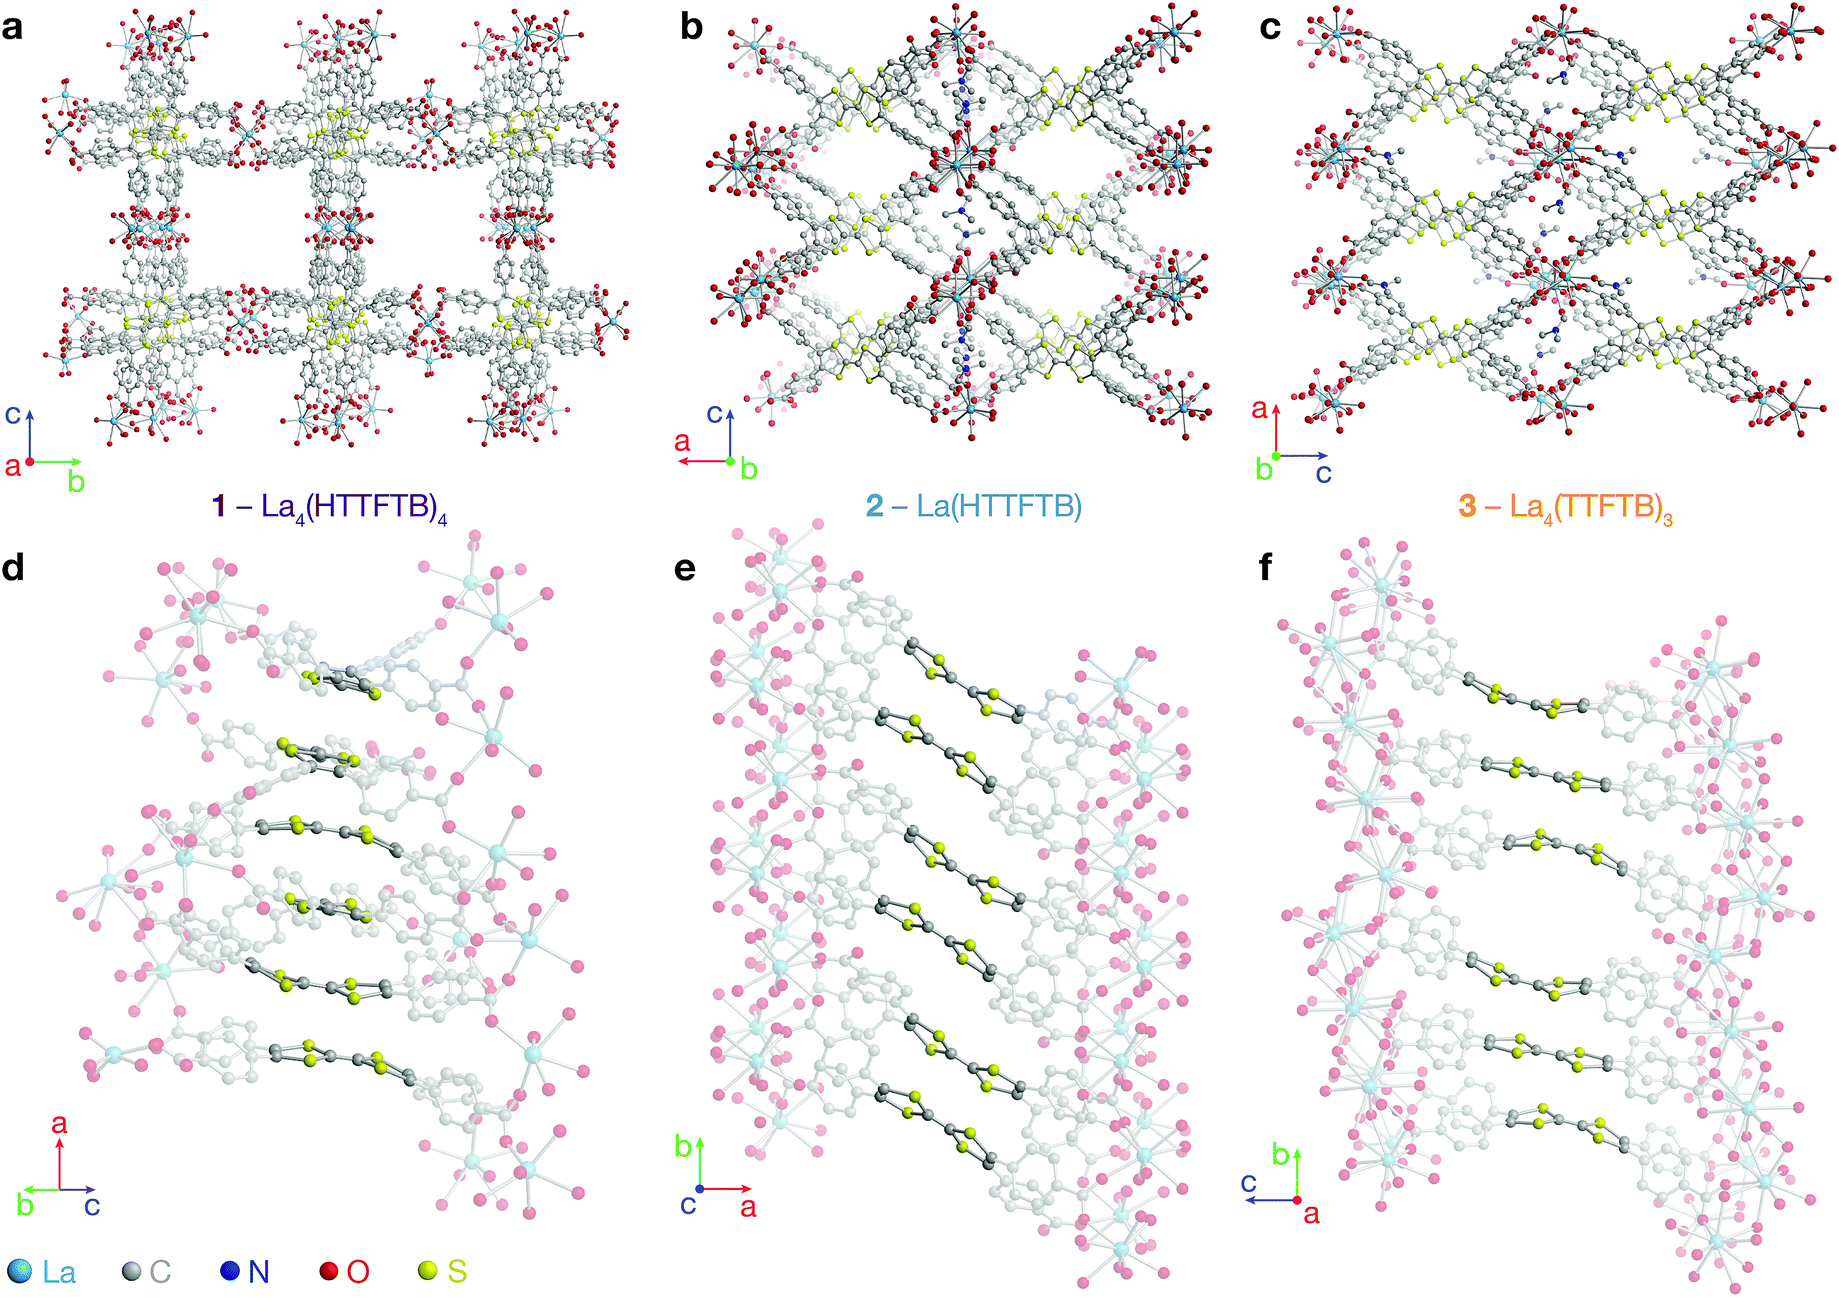 | ||
| Fig. 1 Crystal structures of 1, 2 and 3. (a–c) Structures viewed along the channels, displaying the two types of pores in each MOF; (d–f) representations emphasizing the TTF stacking sequences and infinite La–carboxylate chain inorganic secondary building units (coordinated solvent molecules are omitted for clarity). All H atoms are omitted for clarity. | ||
La4(HTTFTB)4 (1) contains four crystallographically distinct TTFTB ligands, which stack along [100]. Within the asymmetric unit, adjacent ligands are rotated by approximately 90° relative to one another, leading to a staggered arrangement. This geometry maximizes the π–π overlap among the TTF cores by minimizing steric repulsion among neighbouring benzoate groups.
La(HTTFTB) (2) and La4(TTFTB)3 (3) both contain diamond-shaped channels and stacks of parallel TTFTB ligands, with distinct stacking patterns among the TTF cores. In 2, the TTF units form nearly eclipsed dimers. Adjacent dimers are then arranged in a slipped-parallel orientation. In 3, the ligands pack in slipped-parallel trimers, with a larger gap between trimers.
Based on the geometric arrangement of the ligands, the relative extent of π–π overlap among these phases is 1 > 2 > 3. Only 1 contains S⋯S contact distances less than the S–S van der Waals radius sum of 3.60 Å (Tables S4–S6†). Furthermore, all four S atoms on each TTF core in 1 are within 4 Å of an S atom on a neighbouring TTF. The all-parallel arrangement of ligands in 2 does not allow for as much overlap, especially between dimers. Each TTF has four S⋯S contacts of less than 4 Å within the dimer, and one contact of 4.083(3) Å to the adjacent dimer. The slipped geometry within the trimers of 3 leads to longer S⋯S contacts and hence less efficient π–π overlap compared to the dimers of 2. In addition, the shortest S⋯S distance between trimers is 7.072(7) Å, almost twice the sum of the van der Waals radii.
Bulk synthesis and structural characterization
Tuning the temperature and solvent ratios led to optimized reaction conditions for bulk powders of each phase, as detailed in Scheme 1. Powder X-ray diffraction (PXRD) revealed that the products matched the structures determined by SCXRD and were crystalline and phase-pure (Fig. S7–S9†).Phase 2 could be activated under dynamic vacuum at 220 °C (Fig. S8†), while 1 and 3 exhibited loss of crystallinity upon direct removal of solvent (Fig. S7 and S9†). The mechanically flexible nature of the TTFTB ligand, which leads to breathing behaviour in some MOFs,29,30 may lead to structural collapse upon conventional activation. Solvent exchange with supercritical CO2 and subsequent drying34 yielded crystalline samples of 1 and 3. Nitrogen adsorption isotherms on activated 1, 2 and 3 revealed permanent microporosity, with Brunauer–Emmett–Teller (BET) surface areas of 596(1), 454(3), and 362(1) m2 g−1, respectively (Fig. S11†). The relative surface areas are consistent with the pore dimensions and geometries from the single crystal structures.
In relating the reaction conditions with the structures of the products, it is evident that higher ratios of H2O![[thin space (1/6-em)]](https://www.rsc.org/images/entities/char_2009.gif) :DMF produce phases with more π–π stacking. This observation is consistent with the stabilization afforded by ligand π–π interactions, both in solution and in the solid state. We hypothesize that increasing the H2O content in the solvent mixture destabilizes solution-phase π–π interactions among the ligands. Hence, these conditions favour the formation of MOFs with more π–π stacking as a route to lower the overall energy of the system.
:DMF produce phases with more π–π stacking. This observation is consistent with the stabilization afforded by ligand π–π interactions, both in solution and in the solid state. We hypothesize that increasing the H2O content in the solvent mixture destabilizes solution-phase π–π interactions among the ligands. Hence, these conditions favour the formation of MOFs with more π–π stacking as a route to lower the overall energy of the system.
The reaction temperature appears to have a greater influence on the crystallographic density of the entire framework than the extent of intermolecular interactions among the ligands. Using the solvent ratio in Scheme 1, we observed 1 as the product of reactions between 22 and 50 °C. In contrast, 2 and 3 were only isolated above 50 °C. Though the intermolecular π–π stacking in 1 is denser than 2 and 3, the overall framework density is significantly lower for 1, as indicated by the BET surface areas as well as the crystallographic densities (0.939 g cm−3, compared to 1.592 and 1.484 g cm−3 for 2 and 3, respectively). This dependence is in line with trends seen in other metal–organic systems.35
Topological analysis
On account of their 1D chain SBUs, all three phases are examples of rod MOFs.36,37 Further insights into their structures can be gained by an in depth topological analysis with the program ToposPro.38 Following the guidelines recently outlined by a IUPAC task group,39 we consider the tetratopic TTFTB ligand as two linked 3-connected nodes.40,41 As for the decomposition of the rod MOFs into their underlying nets, two algorithms in ToposPro were implemented that are complementary to the approach described by Schoedel et al.:37 points of extension and metals (PE&M), and straight rod representation (STR).Both approaches start with a decomposition of the network into SBUs and linkers (Fig. 2) using a clustering procedure39,42,43 that separates the ligand branches and the infinite rods. We identify the rod topology by marking the valence bonds M–Nm (M = metal, Nm = nonmetal) to “inter-cluster” edges. The PE&M algorithm proceeds with a second clustering procedure that, in our implementation, additionally contracts all functional groups (e.g. bridging carboxylate) coordinated to the metals to single points that represent the points of extension (PEs). As a result, we obtain a net of points of extension and metal centres (PE&M). In contrast with Schoedel et al.,37 we keep the connectivity between the PE and metal atoms (Fig. 2b) to avoid an arbitrary choice of edges between PEs. As always, following a simplification of the net by removing 0-, 1-, and 2-connected nodes (Fig. 2c), we obtain the PE&M underlying net of the rod MOF.
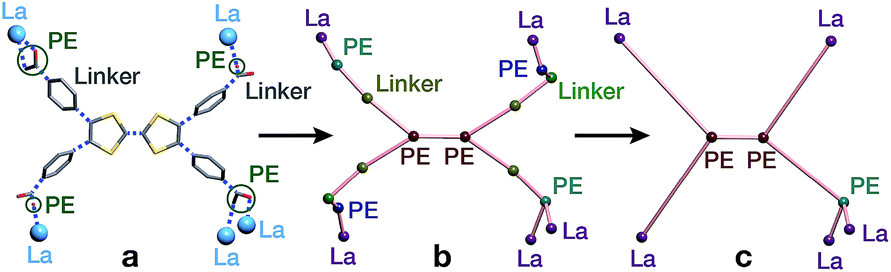 | ||
| Fig. 2 Construction of the underlying net using the points of extension and metals (PE&M) algorithm. (a) Points of extension (PEs) connecting linkers to the La centres are identified. (b) The structure is simplified by contracting all functional groups to single PEs. (c) 0-, 1-, and 2-connected nodes are removed to obtain the PE&M underlying net of the MOF. | ||
The second complementary view is the construction of the underlying net in a straight rod representation (STR). First, we look for the intersection points of the rod and ligand directions by adding dummy nodes (DNs) into the centres of metal dimers bridged by carboxylates (i.e. M–μ(OCO)–M) (Fig. 3a and b). Then, the DNs are connected with neighbouring PEs and metal atoms, while the bonds between the PEs and the metal centres are removed (Fig. 3c). The last step is the simplification of 2-c nodes (Fig. 3d). This view is particularly useful for rod MOFs built with bridging functional groups of ligands, and results in straight rods of the simple topology of a chain of 2-c nodes (2C1).
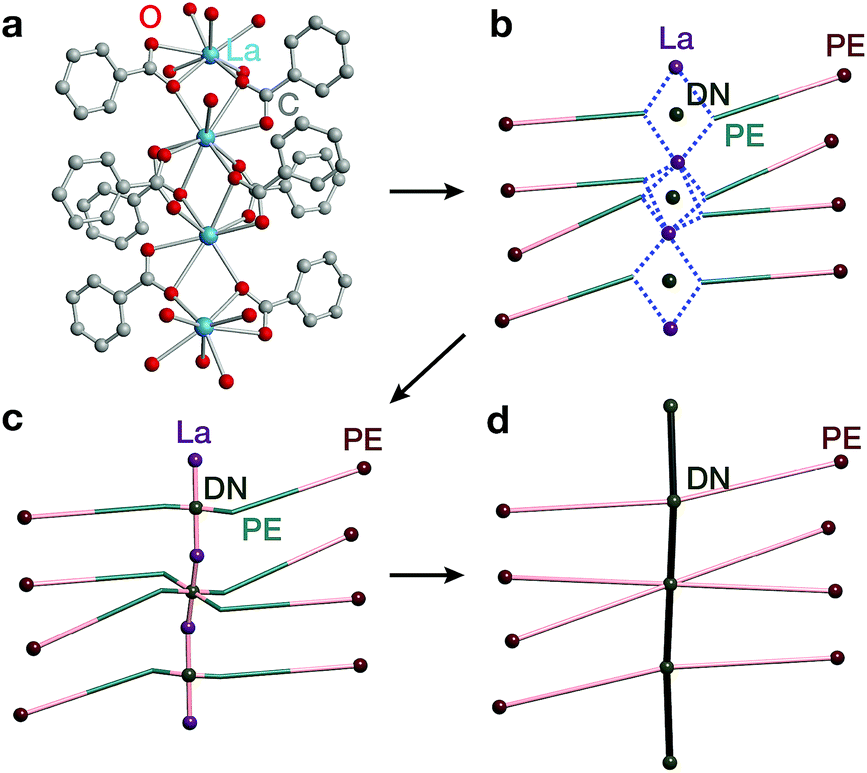 | ||
| Fig. 3 Construction of the underlying net using the straight rod representation (STR) algorithm. (a) Crystallographic representation of La atoms coordinated by ligand benzoates. (b) Dummy nodes (DNs) are inserted into the centre of La dimers bridged by carboxylates, which serve as points of extension (PEs). Dashed blue lines indicate bonds between metals and PEs. (c) The DNs are connected to neighbouring La atoms and PEs, and the bonds between PEs and La atoms are removed. (d) 2-Connected nodes are removed to obtain the STR underlying net of the MOF. | ||
The resulting underlying nets in PE&M and STR representations for compounds 1, 2 and 3 are presented in Fig. 4. All but one are new topological types:44 only the STR representation of compound 3 gives the known 3,4-c binodal topology tfo (observed in 15 other MOFs45). However, none of these known tfo nets are reported for rod MOFs. It should be noted that all nets are very complex with many different nodes (more than 10 in PE&M), and that the STR approach always gives a simpler description. Both representations are useful for database searches and correlation studies. Thus, for comparative analysis, we selected from the Cambridge Structural Database (CSD) all rod MOFs containing rare-earth metals with tetracarboxylate ligands of flat rectangular shape (44 entries in Spreadsheet S1), and 29 MOFs with the TTFTB ligand (Spreadsheet S2). The findings indicate that the aspect ratio, flexibility and propensity for S⋯S interactions of the TTFTB ligand lead to the crystallization of rod MOFs with new topologies (see the ESI† for further discussion).
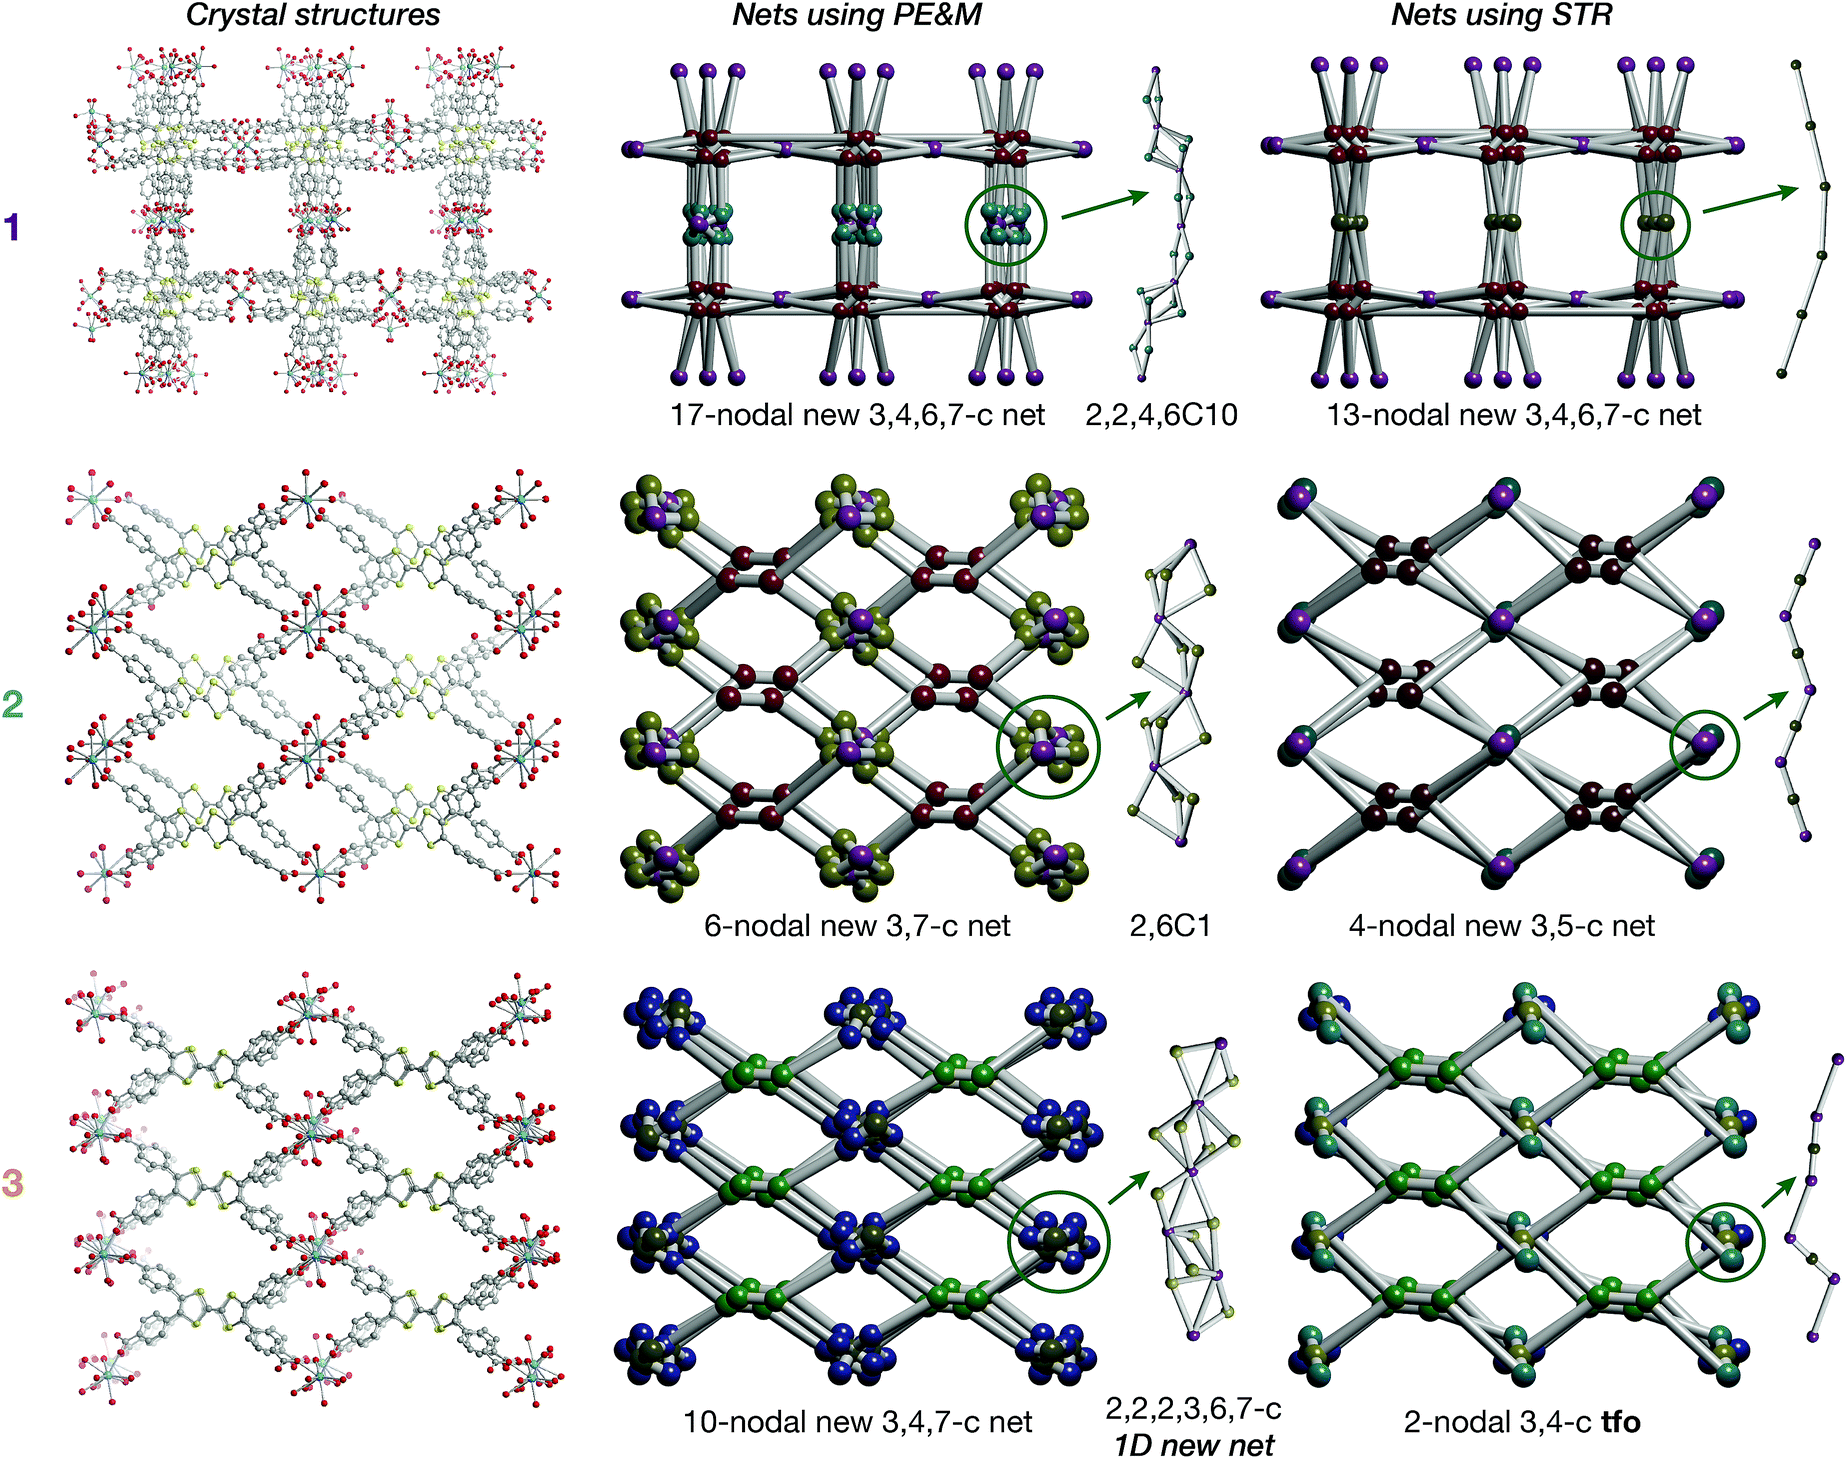 | ||
| Fig. 4 Crystal structures of 1, 2 and 3 and underlying nets derived using points of extension and metals (PE&M) and straight rod representation (STR) algorithms. | ||
Electrical conductivity
The range of different π–π stacking motifs in these structures motivated us to investigate their electrical conductivities. Using a home-built setup that was described previously,46 we measured two-contact probe pressed pellet devices from five separate batches each of 1, 2 and 3 at 296 K in ambient atmosphere (representative I–V curves are shown in Fig. S12†). Phase 1 exhibited the highest average conductivity value of 2.5(7) × 10−6 S cm−1, as well as the highest champion value of 5.4(3) × 10−6 S cm−1. The conductivity of 2 was slightly lower than 1, with average and champion values of 9(4) × 10−7 and 2.7(1) × 10−6 S cm−1, respectively. Finally, the conductivity of 3 was nearly two orders of magnitude lower than 1 and 2, with average and champion values of 1.0(5) × 10−9 and 3.1(2) × 10−9 S cm−1. This trend qualitatively agrees with the degree of π–π stacking present in their structures.To provide more quantitative parameters for describing this structure–property relationship, we hypothesized that the overall rate of charge transfer along an infinite stack of TTF cores should be limited by the largest energy barrier for charge transfer between nearest neighbours.47 Hence, the probability of charge hopping between each pair of adjacent TTF units should be inversely proportional to the closest S⋯S contact distance, henceforth denoted as (S⋯S)min. Therefore, the longest (S⋯S)min in the infinite TTF stacks of each phase should gate the overall charge transfer rate and, assuming similar charge carrier concentrations, modulate the bulk electrical conductivity.
Indeed, plotting the batch and average ambient conductivities of 1, 2 and 3vs. the longest (S⋯S)min in each phase indicates an inverse relationship between these parameters (Fig. 5). We extended this analysis to other TTFTB MOFs with 1D ligand stacking motifs, plotting the literature two-probe pressed pellet conductivities vs. the longest (S⋯S)min values from the published crystal structure data (Fig. S13†).17,27,46 The correlation of longer (S⋯S)min distances with lower conductivities across these MOFs with different structures and compositions suggests a general rule for this class of materials, regardless of the specific geometric orientation of the TTF cores. We acknowledge that a detailed analysis of the transport mechanisms in these MOFs would require single crystal conductivity measurements, as grain boundaries in these pressed pellet measurements contribute additional resistance.
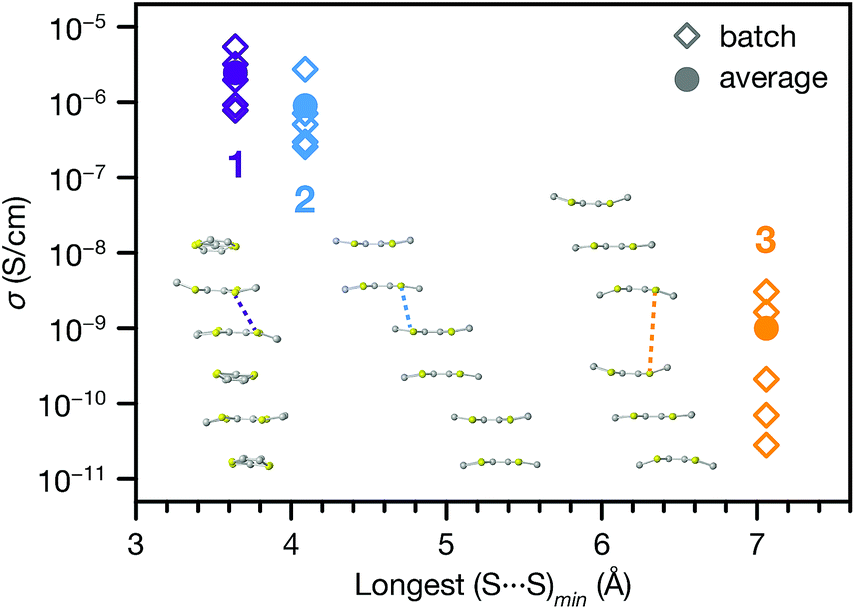 | ||
| Fig. 5 Pressed pellet conductivities (batch and average values) of 1, 2 and 3 plotted against the longest intermolecular (S⋯S)min contact distance from each crystal structure. Inset: representations of TTF stacking motifs, with longest (S⋯S)min contact distances indicated by the dashed lines. | ||
We also carried out variable temperature conductivity measurements in order to investigate the mechanisms for charge transport in these materials. Using a screw cell set-up described previously,48 two-contact probe pressed pellet devices were measured under vacuum between 250 and 350 K for 1 and 2, and between 295 and 350 K for 3 (Fig. S14;† due to the low conductance of 3, we were not able to obtain linear I–V curves at lower temperatures). All three phases exhibit semiconducting behaviour in these temperature ranges (Fig. 6). Fitting the conductivity vs. temperature data to the Arrhenius equation for thermally activated transport, σ = σ0e−Ea/kBT, yields activation energies (Ea) of 0.28, 0.20 and 0.44 eV for 1, 2 and 3 respectively. The significantly larger activation energy of 3 compared to 1 and 2 is consistent with the higher energy barrier for charge hopping in this phase.
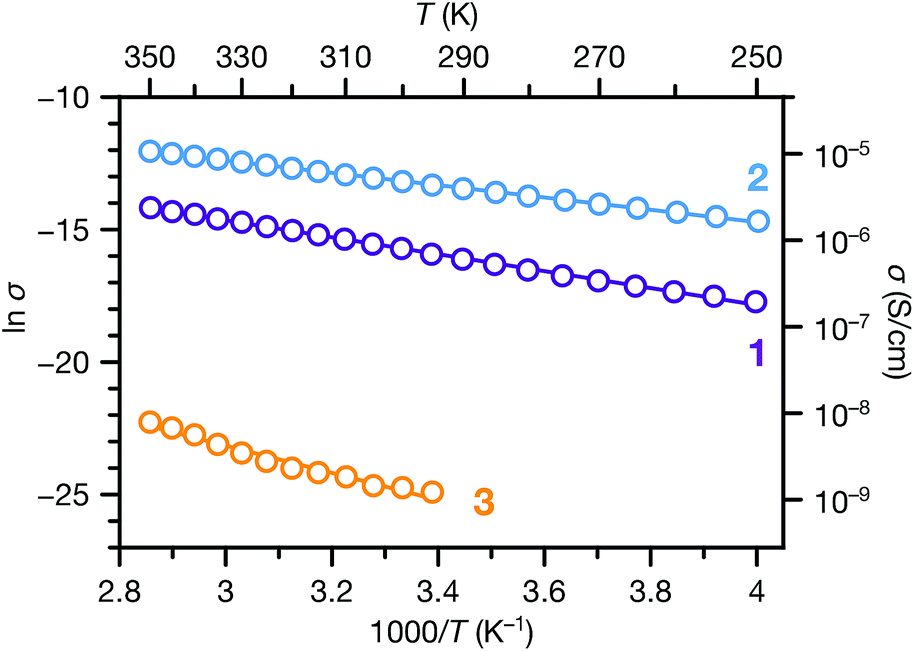 | ||
| Fig. 6 Variable temperature conductivities of 1, 2 and 3. Solid lines correspond to linear fits to the Arrhenius equation for thermally activated transport. | ||
The transport behaviours of these phases exhibited different responses to evacuation. Under vacuum, the conductivities of 1 and 3 decreased about 1 and 2 orders of magnitude, respectively, compared to their ambient conductivities, whereas the conductivity of 2 increased slightly under vacuum. As a result, the vacuum conductivity of 1 was lower compared to 2, in contrast with their relative conductivities under ambient conditions. The activation energy of 1 is also slightly larger than 2. These observations, along with the changes observed in the PXRD patterns of 1 and 3 upon desolvation (Fig. S7 and S9†), suggest that structural responses to atmospheric conditions (e.g. breathing behavior29,30) may cause concomitant changes in the physical properties of these materials. Such responses could be harnessed for stimuli-responsive materials for applications such as chemiresistive sensing.49–52
Diffuse reflectance spectroscopy
To interrogate the ligand oxidation states and intermolecular charge transfer events in these MOFs, we investigated their optical properties using diffuse reflectance UV-vis-NIR spectroscopy and diffuse reflectance infrared fourier spectroscopy (DRIFTS) (Fig. 7a). Absorption bands at 13500 to 14000 cm−1 and approximately 21000 cm−1 in the spectra of all three phases are characteristic of the ligand radical cation, TTFTB˙+.27,53 We assign the NIR band centred at approximately 4000 cm−1 observed in each spectra as the intervalence charge transfer (IVCT) band of the mixed-valence radical cation dimer, (TTFTB2)˙+.53,54
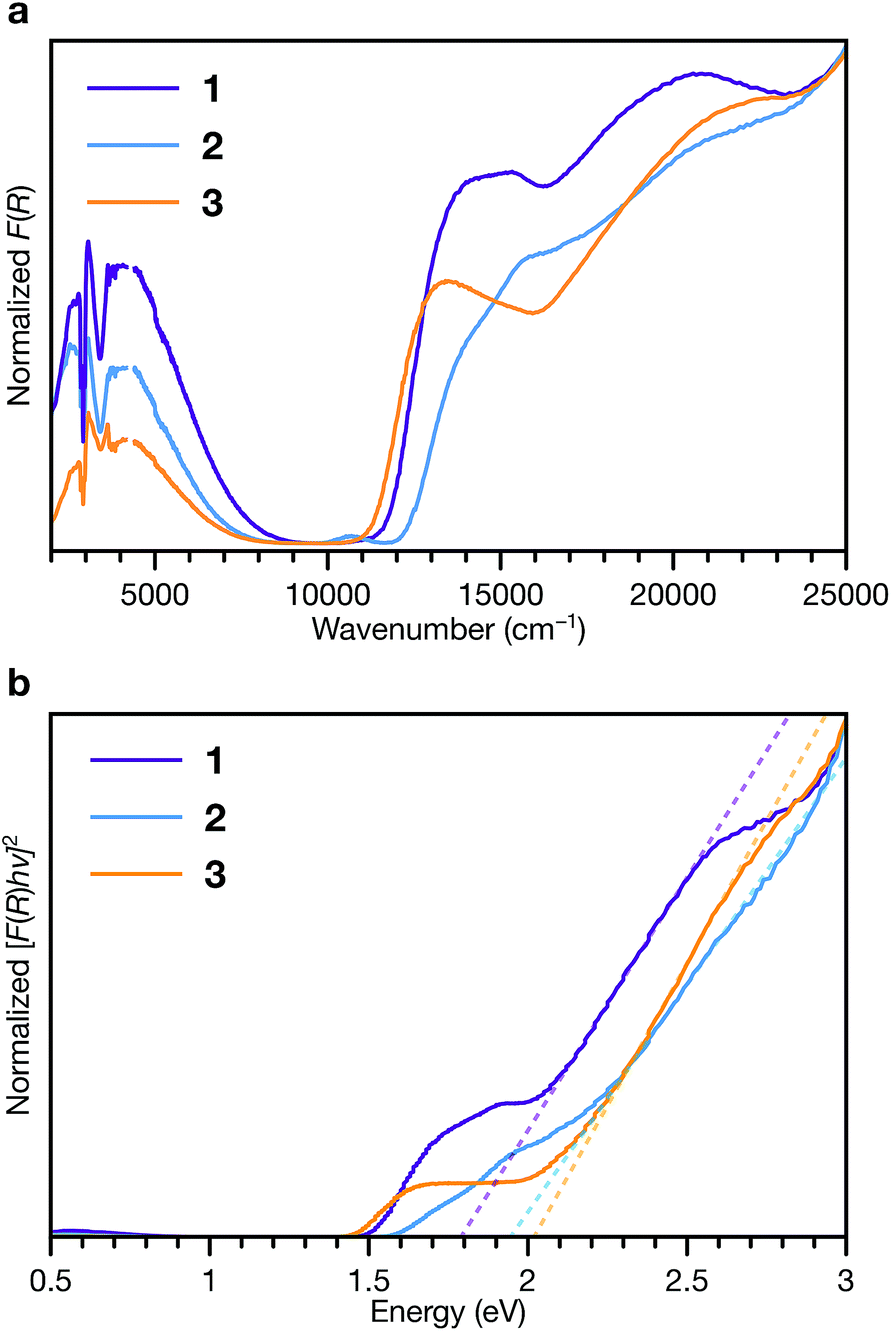 | ||
| Fig. 7 Diffuse reflectance UV-vis-NIR spectroscopy and DRIFTS of 1, 2 and 3. (a) Normalized Kubelka–Munk-transformed spectra. (b) Normalized Tauc plot of the Kubelka–Munk-transformed data. Dashed lines indicate linear fits to the absorption onsets. | ||
These features indicate that both neutral and radical cation ligands are present in these frameworks. Comparison of their central C–C and C–S bond lengths with literature values for TTF compounds55–57 suggests neutral to partially oxidized TTF cores (Tables S7–S9†), similar to other TTFTB-based MOFs for which ligand mixed valency has been invoked.17,27,31,53 Electronic paramagnetic resonance (EPR) spectroscopy also confirms the presence of TTFTB˙+ in each phase (Fig. S15†). Thus, the optical transitions, along with the crystallographic and EPR data, corroborate intermolecular charge transfer along the 1D ligand stacks as the mechanism for electrical conduction in these materials.
Fitting the linear absorption onsets in Tauc plots of the Kubelka–Munk-transformed data of 1, 2 and 3 revealed optical band gaps (Eg) of 1.79, 1.94 and 2.02 eV, respectively (Fig. 7b). The trend in these optical band gaps is consistent with the conductivities: larger optical band gaps are observed in phases with lower electrical conductivities. The optical band gaps are all larger than twice than the activation energies determined by VT conductivity measurements (for an intrinsic semiconductor, one would expect Eg = 2Ea). These differences are consistent with extrinsic doping of these MOFs by TTFTB˙+. In addition, the features at slightly lower energies relative to the absorption edges, between about 1.5 to 2 eV, correspond to electronic transitions of TTFTB˙+. Hence, the energy levels associated with the oxidized ligand species can be conceptualized as mid-gap states.48,58–60
Conclusions
In summary, three polymorphic MOFs containing La3+ with the TTFTB ligand crystallize with unique topologies and exhibit different intermolecular π–π stacking interactions of the TTF cores. Their electrical conductivities vary predictably with the degree of π–π stacking in their structures. In addition, solvothermal reactions with higher H2O:DMF ratios reliably produce phases with more π–π stacking. These rational correlations among reaction conditions, crystallographic motifs and bulk physical properties in these MOFs demonstrate how intermolecular interactions can be tuned to define their transport properties.
Specifically, the longest (S⋯S)min distance in the 1D TTF stack of each phase appears to limit the rate of charge hopping and hence determine the overall electrical conductivity of each phase. This relationship is supported by analysis of other TTFTB MOF structures and conductivities. We propose, therefore, that charge mobilities have a relatively dominant effect on the electrical properties of these materials. The activation energies, optical band gaps and EPR signatures of these phases are similar to those of other TTFTB MOFs and indicate the presence of TTFTB˙+ species, implying that they are hole-doped in their as-synthesized forms. More detailed studies on the carrier concentrations, doping levels and resultant transport properties of these and related MOFs can elucidate the influence of different parameters on their conductivities, and open up avenues for further modification.
The traditional reticular chemistry of MOFs has relied on the formation of conserved inorganic SBUs (with strong metal–ligand bonds) to obtain structures with predictable topologies and properties. In this work, we have shown that the π–π stacking among strongly interacting ligands, which can be energetically competitive with metal–ligand bond formation, can be modulated to obtain structures with new topologies and predictable properties. In general, developing strategies to control ligand–ligand interactions in MOFs will enable the design and crystal engineering of new phases with targeted electronic, optical and other physical properties of interest, expanding the scope of possibilities for these materials.
Conflicts of interest
There are no conflicts of interest to declare.Acknowledgements
This work was supported by the U.S. Department of Energy, Office of Science, Office of Basic Energy Sciences (DE-SC0018235). L. S. X. thanks the National Science Foundation for support through the Graduate Research Fellowship Program (1122374). E. V. A. thanks the Russian Science Foundation (grant No. 18-73-10116) for supporting the development of the methods of topological analysis. D. M. P. thanks the Università degli Studi di Milano for the transition grants PSR2015-1718 and FFABR2018. We thank Dr Peter Müller and Dr Jonathan Becker for assistance with crystallography, and Luming Yang for collecting the EPR data. We gratefully acknowledge Dr Sarah S. Park and Dr Ivo Stassen for helpful discussions.References
- S. Surblé, F. Millange, C. Serre, G. Férey and R. I. Walton, Chem. Commun., 2006, 1518–1520 RSC
.
- D. J. Tranchemontagne, J. L. Mendoza-Cortés, M. O'Keeffe and O. M. Yaghi, Chem. Soc. Rev., 2009, 38, 1257–1283 RSC
- J. J. Perry VI, J. A. Perman and M. J. Zaworotko, Chem. Soc. Rev., 2009, 38, 1400–1417 RSC
- T. R. Cook, Y.-R. Zheng and P. J. Stang, Chem. Rev., 2013, 113, 734–777 CrossRef CAS PubMed
- M. Eddaoudi, D. B. Moler, H. Li, B. Chen, T. M. Reineke, M. O'Keeffe and O. M. Yaghi, Acc. Chem. Res., 2001, 34, 319–330 CrossRef CAS PubMed
- O. M. Yaghi, M. O'Keeffe, N. W. Ockwig, H. K. Chae, M. Eddaoudi and J. Kim, Nature, 2003, 423, 705–714 CrossRef CAS PubMed
- N. W. Ockwig, O. Delgado-Friedrichs, M. O'Keeffe and O. M. Yaghi, Acc. Chem. Res., 2005, 38, 176–182 CrossRef CAS PubMed
- M. J. Kalmutzki, N. Hanikel and O. M. Yaghi, Sci. Adv., 2018, 4, eaat9180 CrossRef PubMed
- M. Eddaoudi, J. Kim, N. Rosi, D. Vodak, J. Wachter, M. O'Keeffe and O. M. Yaghi, Science, 2002, 295, 469–472 CrossRef CAS PubMed
- L. J. Murray, M. Dincă and J. R. Long, Chem. Soc. Rev., 2009, 38, 1294–1314 RSC
- P. Nugent, Y. Belmabkhout, S. D. Burd, A. J. Cairns, R. Luebke, K. Forrest, T. Pham, S. Ma, B. Space, L. Wojtas, M. Eddaoudi and M. J. Zaworotko, Nature, 2013, 495, 80–84 CrossRef CAS PubMed
- D. X. Xue, Y. Belmabkhout, O. Shekhah, H. Jiang, K. Adil, A. J. Cairns and M. Eddaoudi, J. Am. Chem. Soc., 2015, 137, 5034–5040 CrossRef CAS PubMed
- S. H. Cho, B. Ma, S. T. Nguyen, J. T. Hupp and T. E. Albrecht-Schmitt, Chem. Commun., 2006, 2563–2565 RSC
- C. Wang, Z. Xie, K. E. deKrafft and W. Lin, J. Am. Chem. Soc., 2011, 133, 13445–13454 CrossRef CAS PubMed
- D. Feng, Z.-Y. Gu, J.-R. Li, H.-L. Jiang, Z. Wei and H.-C. Zhou, Angew. Chem., Int. Ed., 2012, 51, 10307–10310 CrossRef CAS PubMed
- T. C. Narayan, T. Miyakai, S. Seki and M. Dincă, J. Am. Chem. Soc., 2012, 134, 12932–12935 CrossRef CAS PubMed
- S. S. Park, E. R. Hontz, L. Sun, C. H. Hendon, A. Walsh, T. Van Voorhis and M. Dincă, J. Am. Chem. Soc., 2015, 137, 1774–1777 CrossRef CAS PubMed
- D. Chen, H. Xing, Z. Su and C. Wang, Chem. Commun., 2016, 52, 2019–2022 RSC
- G. Skorupskii, B. A. Trump, T. W. Kasel, C. M. Brown, C. H. Hendon and M. Dincă, ChemRxiv, 2019 DOI:10.26434/chemrxiv.7253192.v1
- H.-J. Liu, X.-T. Tao, J.-X. Yang, Y.-X. Yan, Y. Ren, H.-P. Zhao, Q. Xin, W.-T. Yu and M.-H. Jiang, Cryst. Growth Des., 2008, 8, 259–264 CrossRef CAS
- X. Li, X.-W. Wang and Y.-H. Zhang, Inorg. Chem. Commun., 2008, 11, 832–834 CrossRef CAS
- K. C. Stylianou, R. Heck, S. Y. Chong, J. Bacsa, J. T. A. Jones, Y. Z. Khimyak, D. Bradshaw and M. J. Rosseinsky, J. Am. Chem. Soc., 2010, 132, 4119–4130 CrossRef CAS PubMed
- Y. Cui, Y. Yue, G. Qian and B. Chen, Chem. Rev., 2012, 112, 1126–1162 CrossRef CAS PubMed
- L. Sun, M. G. Campbell and M. Dincă, Angew. Chem., Int. Ed., 2016, 55, 2–16 CrossRef
- D. D. Medina, A. Mähringer and T. Bein, Isr. J. Chem., 2018, 58, 1089–1101 CrossRef CAS
- B. Chen, Z.-P. Lv, C. F. Leong, Y. Zhao, D. M. D'Alessandro and J.-L. Zuo, Cryst. Growth Des., 2015, 15, 1861–1870 CrossRef CAS
- J. Su, T.-H. Hu, R. Murase, H.-Y. Wang, D. M. D'Alessandro, M. Kurmoo and J.-L. Zuo, Inorg. Chem., 2019, 58, 3698–3706 CrossRef CAS PubMed
- S. S. Park, A. J. Rieth, C. H. Hendon and M. Dincă, J. Am. Chem. Soc., 2018, 140, 2016–2019 CrossRef CAS PubMed
- J. Su, S. Yuan, H.-Y. Wang, L. Huang, J.-Y. Ge, E. Joseph, J. Qin, T. Cagin, J.-L. Zuo and H.-C. Zhou, Nat. Commun., 2017, 8, 2008 CrossRef PubMed
- M. Souto, J. Romero, J. Calbo, I. J. Vitórica-Yrezábal, J. L. Zafra, J. Casado, E. Ortí, A. Walsh and G. Mínguez Espallargas, J. Am. Chem. Soc., 2018, 140, 10562–10569 CrossRef CAS PubMed
- S. S. Park, C. H. Hendon, A. J. Fielding, A. Walsh, M. O'Keeffe and M. Dincă, J. Am. Chem. Soc., 2017, 139, 3619–3622 CrossRef CAS PubMed
- L. S. Xie and M. Dincă, Isr. J. Chem., 2018, 58, 1119–1122 CrossRef CAS
- G. Mínguez Espallargas, J. Castells-Gil, S. Mañas-Valero, I. J. Vitórica-Yrezábal, D. Ananias, J. Rocha, R. Santiago, S. T. Bromley, J. J. Baldovi, E. Coronado and M. Souto, Chem.–Eur. J., 2019 DOI:10.1002/chem.201902855
- A. P. Nelson, O. K. Farha, K. L. Mulfort and J. T. Hupp, J. Am. Chem. Soc., 2009, 131, 458–460 CrossRef CAS PubMed
- P. M. Forster, A. R. Burbank, C. Livage, G. Férey and A. K. Cheetham, Chem. Commun., 2004, 368–369 RSC
- N. L. Rosi, J. Kim, M. Eddaoudi, B. Chen, M. O'Keeffe and O. M. Yaghi, J. Am. Chem. Soc., 2005, 127, 1504–1518 CrossRef CAS PubMed
- A. Schoedel, M. Li, D. Li, M. O'Keeffe and O. M. Yaghi, Chem. Rev., 2016, 116, 12466–12535 CrossRef CAS PubMed
- V. A. Blatov, A. P. Shevchenko and D. M. Proserpio, Cryst. Growth Des., 2014, 14, 3576–3586 CrossRef CAS
- C. Bonneau, M. O'Keeffe, D. M. Proserpio, V. A. Blatov, S. R. Batten, S. A. Bourne, M. S. Lah, J. G. Eon, S. T. Hyde, S. B. Wiggin and L. Öhrström, Cryst. Growth Des., 2018, 18, 3411–3418 CrossRef CAS
- M. O'Keeffe and O. M. Yaghi, Chem. Rev., 2012, 112, 675–702 CrossRef PubMed
- M. Li, D. Li, M. O'Keeffe and O. M. Yaghi, Chem. Rev., 2014, 114, 1343–1370 CrossRef CAS PubMed
- E. V. Alexandrov, V. A. Blatov, A. V. Kochetkov and D. M. Proserpio, CrystEngComm, 2011, 13, 3947–3958 RSC
- S. Barthel, E. V. Alexandrov, D. M. Proserpio and B. Smit, Cryst. Growth Des., 2018, 18, 1738–1747 CrossRef CAS PubMed
- M. O'Keeffe, M. A. Peskov, S. J. Ramsden and O. M. Yaghi, Acc. Chem. Res., 2008, 41, 1782–1789 CrossRef PubMed
- The Samara Topological Data Center, https://topcryst.com/, accessed 20 June 2019.
- L. Sun, S. S. Park, D. Sheberla and M. Dincă, J. Am. Chem. Soc., 2016, 138, 14772–14782 CrossRef CAS PubMed
- V. Coropceanu, J. Cornil, D. A. d. S. Filho, Y. Olivier, R. Silbey and J.-L. Brédas, Chem. Rev., 2007, 107, 926–952 CrossRef CAS PubMed
- L. Sun, C. H. Hendon, S. S. Park, Y. Tulchinsky, R. Wan, F. Wang, A. Walsh and M. Dincă, Chem. Sci., 2017, 8, 4450–4457 RSC
- M. G. Campbell, D. Sheberla, S. F. Liu, T. M. Swager and M. Dincă, Angew. Chem., Int. Ed., 2015, 54, 4349–4352 CrossRef CAS PubMed
- M. G. Campbell, S. F. Liu, T. M. Swager and M. Dincă, J. Am. Chem. Soc., 2015, 137, 13780–13783 CrossRef CAS PubMed
- M. G. Campbell and M. Dincă, Sensors, 2017, 17, 1108 CrossRef PubMed
- I. Stassen, N. Burtch, A. Talin, P. Falcaro, M. Allendorf and R. Ameloot, Chem. Soc. Rev., 2017, 46, 3185–3241 RSC
- C. F. Leong, C.-H. Wang, C. D. Ling and D. M. D'Alessandro, Polyhedron, 2018, 154, 334–342 CrossRef CAS
- M. Yoshizawa, K. Kumazawa and M. Fujita, J. Am. Chem. Soc., 2005, 127, 13456–13457 CrossRef CAS PubMed
- W. F. Cooper, N. C. Kenny, J. W. Edmonds, A. Nagel, F. Wudl and P. Coppens, J. Chem. Soc. D, 1971, 889–890 RSC
- T. J. Kistenmacher, T. E. Phillips and D. O. Cowan, Acta Crystallogr., 1974, B30, 763–768 CrossRef
- W. Reith, K. Polborn and E. Amberger, Angew. Chem., Int. Ed., 1988, 27, 699–700 CrossRef
- L. S. Xie, L. Sun, R. Wan, S. S. Park, J. A. DeGayner, C. H. Hendon and M. Dincǎ, J. Am. Chem. Soc., 2018, 140, 7411–7414 CrossRef CAS PubMed
- M. L. Aubrey, B. M. Wiers, S. C. Andrews, T. Sakurai, S. E. Reyes-Lillo, S. M. Hamed, C.-J. Yu, L. E. Darago, J. A. Mason, J.-O. Baeg, F. Grandjean, G. J. Long, S. Seki, J. B. Neaton, P. Yang and J. R. Long, Nat. Mater., 2018, 17, 625–632 CrossRef CAS PubMed
- J. G. Park, M. L. Aubrey, J. Oktawiec, K. Chakarawet, L. E. Darago, F. Grandjean, G. J. Long and J. R. Long, J. Am. Chem. Soc., 2018, 140, 8526–8534 CrossRef CAS PubMed
Footnote |
| † Electronic supplementary information (ESI) available. CCDC 1936715–1936717. For ESI and crystallographic data in CIF or other electronic format see DOI: 10.1039/c9sc03348c |
| This journal is © The Royal Society of Chemistry 2019 |