
 Open Access Article
 This Open Access Article is licensed under a
 Creative Commons Attribution 3.0 Unported Licence
Reversible nanocluster structure transformation between face-centered cubic and icosahedral isomers†
Xi
Kang
 a,
Li
Huang
b,
Wei
Liu
b,
Lin
Xiong
c,
Yong
Pei
c,
Zhihu
Sun
*b,
Shuxin
Wang
*a,
Shiqiang
Wei
b and
Manzhou
Zhu
*a
a,
Li
Huang
b,
Wei
Liu
b,
Lin
Xiong
c,
Yong
Pei
c,
Zhihu
Sun
*b,
Shuxin
Wang
*a,
Shiqiang
Wei
b and
Manzhou
Zhu
*a
aDepartment of Chemistry and Center for Atomic Engineering of Advanced Materials, Anhui Province Key Laboratory of Chemistry for Inorganic/Organic Hybrid Functionalized Materials, Anhui University, Hefei, Anhui 230601, China. E-mail: ixing@ahu.edu.cn; zmz@ahu.edu.cn
bNational Synchrotron Radiation Laboratory, University of Science and Technology of China, Hefei, Anhui 230029, China. E-mail: zhsun@ustc.edu.cn
cDepartment of Chemistry, Key Laboratory of Environmentally Friendly Chemistry and Applications of Ministry of Education, Xiangtan University, Xiangtan, Hunan 411105, China
First published on 5th August 2019
Abstract
Structural transformations between isomers of nanoclusters provide a platform to tune their properties and understand the fundamental science due to their intimate structure–property correlation. Herein, we demonstrate a reversible transformation between the face-centered cubic (FCC) and icosahedral isomers of Pt1Ag28 nanoclusters accomplished in the ligand-exchange processes. Ligand-exchange of 1-adamantanethiolate protected Pt1Ag28 by cyclohexanethiolate could transform the FCC kernel to the icosahedral isomer. Interestingly, the icosahedral Pt1Ag28 could be reversibly transformed to the FCC configuration when the cyclohexanethiolate ligand is replaced again by 1-adamantanethiolate. A combination of UV-vis absorption, mass spectrometry, photo-luminescence and X-ray absorption fine structure unambiguously identifies that the FCC-to-icosahedral structure transformation of Pt1Ag28 involves two distinct stages: (i) ligand-exchange induced outmost motif transformation and (ii) abrupt innermost kernel transformation. As a result of this structural transformation, the emission wavelength of Pt1Ag28 red-shifts from 672 to 720 nm, and the HOMO–LUMO energy gap reduces from 1.86 to 1.74 eV. This work presents the first example of nanocluster isomers with inter-switching configurations, and will provide new insights into manipulating the properties of nanoclusters through controllably tuning their structures.
1 Introduction
Nanoclusters, with the advantages of precise compositions and well-defined structures, provide an exciting opportunity to grasp the structure–property correlation at the atomic level.1,2 The quantum size effect of nanoclusters endows them with a plethora of properties, such as photo-luminescence (PL), catalysis, chirality, and magnetism, to name a few.1,2 The property manipulation at the atomic level has long been a hot topic, and has allowed a series of nanoclusters with controllable chemical–physical properties to be produced.1f–h,2g,i,k,lIsomerism is being intensely pursued in nanoscience, and has been exploited for tailoring the performances of nanoparticles.3 However, understanding the isomerism phenomenon at the atomic level has been largely impeded due to the poly-disperse sizes as well as the uncertain surface coordination modes of nanoparticles.1a,b,3b The precise structures of nanoclusters make it possible to fully grasp the isomerism phenomenon.4–6 Although stereoisomerism has been extensively studied in the nanocluster field (that is, obtaining chiral–optical nanoclusters via the separation of left- and right-handed isomers),4,5 structural isomerism remains rare. Up to now, only a few structural isomers in the nanocluster range have been observed (e.g., Au28(SR)20, Au38(SR)24, and Au52(SR)32).6a,c–f Different structure-dependent properties (e.g., optical absorption, catalytic activity, and thermal stability) have been investigated on the basis of these nanocluster isomers.5f,6 In addition, experimental and theoretical efforts in exploring the isomerism effect on atomic arrangement and properties of nanoclusters should be continued because such findings enable us to fully grasp the structure–property correlation, and thus help us to design new nanoclusters with unique functions.5f,6
Meanwhile, accompanied by the structure determination of nanoclusters resolved by single-crystal X-ray crystallography (SCXC), several efforts have been made for grasping the size-growth and structure-transformation modes from small complexes to nanoclusters, then to large nanoparticles.1l,n,7 Icosahedron and face-centered cubic (FCC) are the two most common configurations of nanocluster kernels. The structural transformation from an icosahedral to FCC configuration or its reverse process has been reported recently in the nanocluster field.6d,8 For instance, ligand-exchanging Au25(S-C2H4Ph)18 with excess tBuPh-SH changes the icosahedral configuration of the Au13 kernel into a FCC configuration.6d Besides, the existence of Me2PhSH can transform Au44(S-PhtBu)28 into Au44(S-PhMe2)26, where the kernel changes from the FCC to the icosahedral configuration.8a However, for nanocluster isomer systems, to the best of our knowledge, the structural transformation from the FCC to icosahedron or its reverse process, not to mention the reversible transformation between these two configurations, remains incomplete. Such a shortage impedes the full understanding of nanocluster isomerism in terms of structure-transformation modes and structure–property correlation.
In the current work, a reversible transformation has been accomplished between FCC and icosahedral isomers of Pt1Ag28 nanoclusters. The ligand-exchange method is herein exploited for fulfilling the reversible transformation between Pt1Ag28(S-Adm)18(PPh3)4 (Pt1Ag28-1, where S-Adm represents 1-adamantanethiol) with a FCC Pt1Ag12 kernel and Pt1Ag28(S-c-C6H11)18(PPh3)4 (Pt1Ag28-2, where S-c-C6H11 represents cyclohexanethiol) with an icosahedral Pt1Ag12 kernel. ESI-MS, PL and EXAFS results are combined to demonstrate that the configurational transformation between the FCC and the icosahedron contains two distinct stages: the motif transformation process and kernel transformation process, where the latter transformation is induced by the former one. Accompanied by the structural transformation (from Pt1Ag28-1 to Pt1Ag28-2), the emission wavelength red-shifts from 672 nm to 720 nm, and the HOMO–LUMO energy gap reduces from 1.86 eV to 1.74 eV.
2 Experimental methods
2.1 Materials
All chemicals including silver nitrate (AgNO3, 99.9%, metal basis), hexachloroplatinic(IV) acid (H2PtCl6·6H2O, 99.9% metal basis), triphenylphosphine (PPh3, 99%), 1-adamantanethiol (Adm-SH, C10H15SH, 99%), cyclohexanethiol (C6H11-c-SH, 99%), sodium borohydride (NaBH4, 99.9%), styrene (C6H5–C2H3, 99.5%), potassium carbonate (K2CO3, 99.5%), methylene chloride (CH2Cl2, HPLC grade), methanol (CH3OH, HPLC), acetic ether (CH3COOC2H5, HPLC), ether ((C2H5)2O, HPLC), and toluene (C6H5–CH3, HPLC) were purchased from Sigma-Aldrich and used without further purification. All glassware were thoroughly cleaned with aqua regia (HCl![[thin space (1/6-em)]](https://www.rsc.org/images/entities/char_2009.gif) :HNO3 = 3:1 v/v), rinsed with copious pure water, and then dried in an oven prior to use.
:HNO3 = 3:1 v/v), rinsed with copious pure water, and then dried in an oven prior to use.
2.2 Synthesis of Pt1Ag28-1 nanoclusters
The synthesis of Pt1Ag28-1 nanoclusters was carried out with reference to our previous work.8b2.3 Converting Pt1Ag28-1 into Pt1Ag28-2 nanoclusters
Specifically, 10 mg of Pt1Ag28-1 nanoclusters was dissolved in 30 mL of CH2Cl2. 300 μL of C6H11-c-SH was added and reacted for 2 hours at 40 °C. After the reaction was complete, the solution was rotavaporated, and then approximately 50 mL of methanol was added to wash the product. The precipitate was dissolved in CH2Cl2 giving rise to the solution of Pt1Ag28-2 nanoclusters. The yield was about 80% (i.e., 8 mg of Pt1Ag28-2 was obtained).2.4 Converting Pt1Ag28-2 into Pt1Ag28-1 nanoclusters
Specifically, 10 mg of Pt1Ag28-2 nanoclusters was dissolved in 30 mL of CH2Cl2. 0.1 g of Adm-SH was added and reacted for 3 minutes at room temperature. After the reaction was complete, the solution was rotavaporated, and then approximately 50 mL of methanol was added to wash the product. The precipitate was dissolved in CH2Cl2 giving rise to the solution of Pt1Ag28-1 nanoclusters. The yield was about 90% (i.e., 9 mg of Pt1Ag28-1 was obtained). Compared with the conversion from Pt1Ag28-1 to Pt1Ag28-2, the reverse process is quicker.2.5 Crystallization of the Pt1Ag28-2 nanoclusters
Single crystals of Pt1Ag28-2 were crystallized by vapor diffusion of ether into the CH2Cl2 solution of the nanoclusters over 7 days. For promoting the crystallization, Na+(BPh4)− counter-ions (molar ratio between clusters and counter-ions was 1:2) were added into the CH2Cl2 solution. Then black crystals were collected and the structure of the Pt1Ag28-2 nanocluster was determined. The CCDC number of the Pt1Ag28-2 nanocluster is 1840953.
2.6 Test of the temperature–PL correlation
10 mg of Pt1Ag28-1 (or Pt1Ag28-2) was dissolved in 10 mL of CH2Cl2/2-CH3-THF. Then the solutions were cooled to different temperatures and the PL spectra were measured.2.7 Catalytic performance
For the preparation of catalysts, Pt1Ag28-1 (or Pt1Ag28-2) clusters were supported on commercial carbon nanotubes (CNTs; Beijing Bo Yu high-tech new material technology Co., Ltd). The CNTs were first dispersed in toluene, and the nanoclusters were added to the suspension of CNTs under vigorous magnetic stirring. The adsorption of clusters was allowed to proceed overnight. Then the product was separated from the solution by centrifugation. The cluster@CNT composite was dried in a vacuum for 12 h; then, Pt1Ag28-1@CNT and Pt1Ag28-2@CNT catalysts (with a 2 wt% cluster loading) were obtained.For the catalytic activity test, a 10 mL Schlenk bottle was charged with 0.5 mmol of styrene, 1.5 mmol of TBHP (tert-butyl hydroperoxide), 20 mg of cluster@CNT catalyst, 10 mg of K2CO3, and 2 mL of toluene. Then the suspension was stirred at 50 °C for 24 hours. The suspension was then centrifuged to remove solids, and the catalytic product was analysed by gas chromatography with an internal standard.
2.8 XAFS (X-ray absorption fine structure spectroscopy) measurements
XAFS measurements at the Pt L3-edge (11564 eV) were performed at the beamline BL14W1 station of the Shanghai Synchrotron Radiation Facility (SSRF), China. The storage ring of the SSRF was working at an energy of 3.5 GeV with an average electron current of 300 mA. The hard X-ray was monochromatized with a Si (311) monochromator. EXAFS data were collected in the transmission mode in the energy range from −200 below to 1000 eV above the Pt L3-edge. The acquired EXAFS data were processed according to the standard procedures using the ARTEMIS module implemented in the IFEFFIT software packages.2.9 X-ray crystallography
The data collection for single crystal X-ray diffraction was carried out on a Bruker Smart APEX II CCD diffractometer under liquid nitrogen flow at 200 K, using graphite-monochromatized Mo Kα radiation (λ = 0.71073 Å). Data reductions and absorption corrections were performed using the SAINT and SADABS programs, respectively. The electron density was squeezed by Olex 2. The structure was solved by direct methods and refined with full-matrix least squares on F2 using the SHELXTL software package. All non-hydrogen atoms were refined anisotropically, and all the hydrogen atoms were set in geometrically calculated positions and refined isotropically using a riding model.3 Theoretical methods
Density functional theory (DFT) calculations were employed to optimize the geometric structures and calculate the Kohn–Sham orbitals of Pt1Ag28 nanoclusters using the Perdew–Burke–Ernzerhof (PBE) GGA functional.9 The triple-zeta polarized (TZP) basis set with inclusion of the scalar relativistic effect via a zeroth-order regular approximation (ZORA) implemented in the ADF package was adopted.10 In the electronic structure analysis, the Kohn–Sham orbitals were calculated to analyze contributions of different atomic orbital types to molecular orbitals.3.1 Characterization
UV-vis absorption spectra of nanoclusters dissolved in CH2Cl2 were recorded using an Agilent 8453 diode array spectrometer.Electrospray ionization time-of-flight mass spectrometry (ESI-TOF-MS) measurement was performed using a MicrOTOF-QIII high-resolution mass spectrometer.
PL spectra were measured on an FL-4500 spectrofluorometer with the same optical density (OD) of ∼0.05. Of note, the PL excitation spectrum of Pt1Ag28-1 or Pt1Ag28-2 was measured at 600 or 750 nm, respectively, for suppressing the interference from each other (e.g., Pt1Ag28-1 fluoresces at 600 nm, while Pt1Ag28-2 does not fluoresce at this wavelength).
Quantum yields (QYs) were measured with dilute solutions of nanoclusters on a HORIBA FluoroMax-4P.
Transmission electron microscopy (TEM) was conducted on a JEM-2100 microscope with an accelerating voltage of 200 kV.
Thermogravimetric analysis (TGA) was carried out on a thermogravimetric analyser (DTG-60H, Shimadzu Instruments, Inc.)
X-ray photoelectron spectroscopy (XPS) measurement was performed on a Thermo ESCALAB 250, configured with a monochromated Al Kα (1486.8 eV) 150 W X-ray source, 0.5 mm circular spot size, flood gun to counter charging effects, and analysis chamber base pressure lower than 1 × 10⁻⁹ mbar.
Inductively coupled plasma-atomic emission spectrometry (ICP-AES) measurements were performed on an Atomscan Advantage instrument made by Thermo Jarrell Ash Corporation.
Electrochemical measurements (differential pulse voltammetry, DPV) of clusters were performed with an electrochemical workstation (CHI 700E) using a Pt working electrode (0.4 mm diameter), a Pt wire counter electrode and an Ag wire quasi-reference electrode in 0.1 M Bu4NPF6–CH2Cl2. The electrolyte solution was deaerated with ultra-high purity nitrogen for 40 min and blanketed under a nitrogen atmosphere during the entire experimental procedure.
4 Results and discussion
4.1 Syntheses and crystallization
The Pt1Ag28-1 nanoclusters were prepared using our previously reported procedure.8b The Pt1Ag28-2 nanoclusters were synthesized by reacting pure Pt1Ag28-1 with excess HS-c-C6H11 at 40 °C (see Experimental Methods for more details). After ∼2 hours, all the Pt1Ag28-1 nanoclusters were completely converted into Pt1Ag28-2 in a high yield (>80%, Ag atom basis). The as-prepared Pt1Ag28-2 was crystallized by vapor diffusion of ether into a CH2Cl2 solution of the nanoclusters over 7 days. The Pt1Ag28-1 structure was reported by us in early work.8b The structure of Pt1Ag28-2 is newly determined in the current work. X-ray photoelectron spectroscopy (XPS) and inductively coupled plasma (ICP) measurements were performed to validate the ratio of Pt/Ag in the bi-metallic Pt1Ag28-2 nanoclusters (Fig. S1, S2 and Table S1†), and the results perfectly matched the theoretical value (1/28 of Pt/Ag). Furthermore, the purity of Pt1Ag28-2 was confirmed by thermogravimetric analysis (TGA). The experimental weight loss of 49.57% (Fig. S3†) is consistent with the calculated loss (49.26%) of the ligands (i.e., PPh3 and S-c-C6H11) in Pt1Ag28-2. Both Pt1Ag28 nanoclusters are highly stable at 50 °C (Fig. S4;† clusters are dissolved in CHCl3, and in contact with air). In the DPV analysis (Fig. S5†), Pt1Ag28-1 showed two oxidation peaks at 0.76 V (O1) and 1.28 V (O2) and a reduction peak at −1.32 V (R1); in comparison, Pt1Ag28-2 exhibited three oxidation peaks at 0.75 V (O1), 1.08 V (O2) and 1.45 V (O3) and a reduction peak at −0.92 V (R1). The catalytic performance of both Pt1Ag28 nanoclusters in the oxidation of styrene was evaluated (Fig. S6,† and see the catalysis conditions in Experimental methods). The catalysis was performed at 50 °C to ensure that both clusters were stable. Although the catalytic selectivity for epoxide or benzaldehyde is similar in both catalysis, the overall catalytic conversion by Pt1Ag28-2@CNTs is much higher than that by Pt1Ag28-1@CNTs (66.48% versus 43.43%; shown in Fig. S6†). Such a difference may result from the ligand effect between the two nanoclusters.The Pt1Ag28-2 nanoclusters crystallize in the P21/c space group. The structure of Pt1Ag28-2 is shown in Fig. 1A and the structural anatomy is shown in Fig. 1B–E (see Fig. S7† for the complete structure). Specifically, a single Pt atom is arranged in the innermost position of the overall structure (Fig. 1B), which is further capped by an Ag12 cage, forming a Pt1Ag12 kernel with an icosahedral configuration (Fig. 1C). Furthermore, this Pt1Ag12 kernel is surrounded by four Ag3(S-c-C6H11)6 motifs. Of note, each Ag3(S-c-C6H11)6 motif links with three other motifs via sharing the terminal thiolates, which constitutes a cage-like Ag12(S-c-C6H11)18 motif structure fully surrounding the Pt1Ag12 kernel (Fig. 1D). Moreover, four Ag-PPh3 architectures occupy the four vacancies of the aforementioned Pt1Ag12@Ag12(S-c-C6H11)18 structure, giving rise to the final Pt1Ag28-2 structure. It should be noted that the capped Ag12(SR)18@(Ag-PPh3)4 structure of Pt1Ag28-2 is similar to that of Pt1Ag28-1.8b The TEM images of Pt1Ag28-1 and Pt1Ag28-2 indicate that the clusters are uniform in size of about 1.6 nm (Fig. S8†), and this agrees with that determined by X-ray structural analysis.
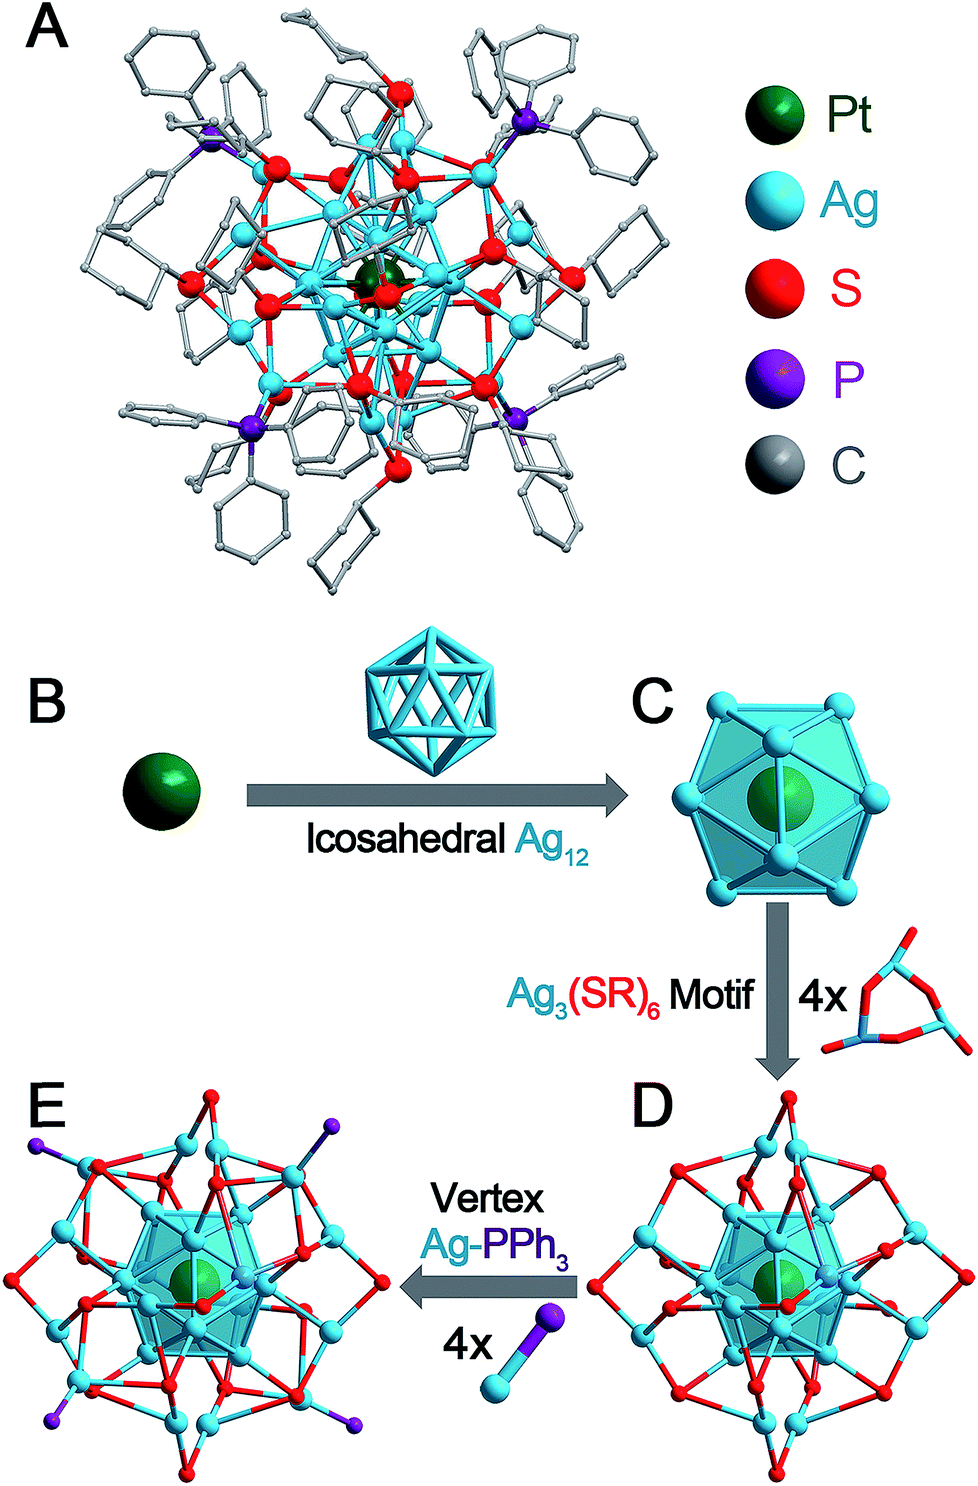 | ||
| Fig. 1 Pt1Ag28-2 nanocluster and its structural anatomy. (A) Total structure. (B) Innermost Pt atom. (C) Pt1Ag12 kernel with an icosahedral configuration. (D) Pt1Ag12 kernel protected by four Ag3(S-Adm)6 motifs. These four motifs make up a large Ag12(S-Adm)18 motif wrapping the icosahedral kernel. (E) Four Ag-PPh3 architectures occupy the vertex positions of the nanocluster. Color codes: green sphere, Pt; blue spheres, Ag; red spheres, S; purple spheres, P; and grey spheres, C. For clarity, the hydrogen atoms are not shown. | ||
4.2 Reversible structure transformation
In order to elucidate the structural differences induced by the ligand exchange (i.e., S-c-C6H11versus S-Adm), a comparison of the kernels of Pt1Ag28-1 and Pt1Ag28-2 is provided in Fig. 2. Both Pt1Ag28 nanoclusters comprise a Pt1Ag12 kernel; however, the FCC configuration of the Pt1Ag12 kernel in Pt1Ag28-1 turns into the icosahedral configuration when the nanocluster converts to Pt1Ag28-2. The opposite process is also confirmed by reacting Pt1Ag28-2 with excess HS-Adm. Previously, two nanoclusters following the isomerism phenomenon are almost arranged in the same molecular configuration, e.g., Au21(S-Adm)15 and Au21(S-tBu)15 isomers with a FCC configuration,11,12 Au28(S-PhtBu)20 and Au28(S-c-C6H11)20 isomers with a FCC configuration,6d,e Au52(S-PhtBu)32 and Au52(S-PhC2H4)32 isomers with a FCC configuration,6c Au9Ag12(S-Adm)4(dppm)6Cl6 and Au9Ag12(S-tBu)4(dppm)6Cl6 with an icosahedral configuration,6f and so on.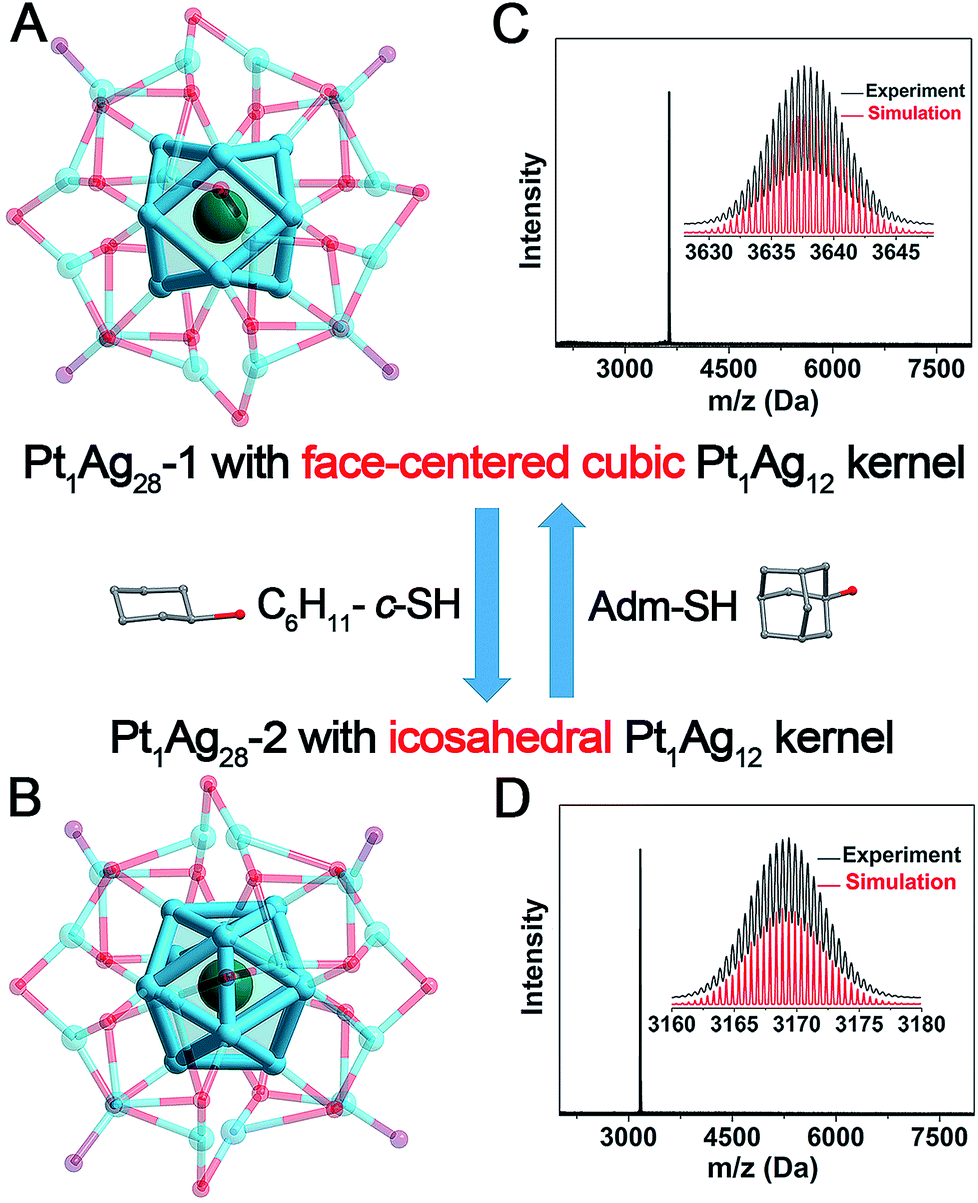 | ||
| Fig. 2 Illustration of the reversible transformation between (A) the Pt1Ag28-1 nanocluster with a FCC Pt1Ag12 kernel and (B) the Pt1Ag28-2 nanocluster with an icosahedral Pt1Ag12 kernel induced by the addition of the HS-c-C6H11 or HS-Adm ligand. ESI-MS spectra of (C) Pt1Ag28-1 and (D) Pt1Ag28-2 nanoclusters. Insets: experimental and simulated isotope patterns of each nanocluster. Color codes: green sphere, Pt; blue spheres, Ag; red spheres, S; and purple spheres, P. For clarity, the carbon and hydrogen atoms are not shown. | ||
Significantly, these two Pt1Ag28 isomers exhibit reversibility in terms of the kernel configuration between the FCC and icosahedron, which is observed for the first time in the nanocluster range (Fig. 2). Table 1 lists the comparison of bond lengths of Pt(core)–Ag(edge), Ag(edge)–Ag(edge), Ag(edge)–S(motif) and Ag(vertex)–P(vertex) between these two Pt1Ag28 isomers (see Fig. S9–S12† for the highlights of these types of bonds). Specifically, in Pt1Ag28-1, the bond lengths between the central Pt atom and the Ag atoms on the Pt1Ag12 shell range from 2.768 to 2.797 Å (average: 2.783 Å), whereas the Pt(core)–Ag(edge) distances in Pt1Ag28-2 shorten to 2.744–2.791 Å (average: 2.763 Å). In contrast, the average Ag(edge)–Ag(edge) bond length of 2.801 Å in Pt1Ag28-1 significantly increases to 2.915 Å (with a 4.07% difference) in Pt1Ag28-2. Furthermore, the average Ag(edge)–S bond length displays a 0.92% elongation in Pt1Ag28-2 compared with that of the Pt1Ag28-1 nanocluster. Moreover, the average Ag(vertex)–P bond length (2.400 Å) in Pt1Ag28-2 is also slightly longer than that in Pt1Ag28-1 (2.356 Å).
| Bond length (Å) | Pt1Ag28-1 | Pt1Ag28-2 | Diff. |
|---|---|---|---|
| Pt(core)–Ag(edge) | 2.768–2.797 | 2.744–2.791 | 0.72% |
| Avg. 2.783 | Avg. 2.763 | ||
| Ag(edge)–Ag(edge) | 2.761–2.843 | 2.819–3.309 | 4.07% |
| Avg. 2.801 | Avg. 2.915 | ||
| Ag(edge)–S | 2.438–2.498 | 2.480–2.517 | 0.92% |
| Avg. 2.472 | Avg. 2.495 | ||
| Ag(vertex)–P | 2.292–2.384 | 2.395–2.409 | 1.87% |
| Avg. 2.356 | Avg. 2.400 |
Electrospray ionization mass spectrometry (ESI-MS) was performed to verify the purity of each Pt1Ag28 isomer. As shown in Fig. 2C and D, the reaction between Pt1Ag28-1 and HS-c-C6H11 decreases the mass value from 3637.64 Da to 3169.36 Da, which is assigned to Pt1Ag28-2. The magnification of the peak suggests a +2 charge state of Pt1Ag28-2, since this peak evidences a characteristic isotopic pattern with peaks separated by an m/z of 0.5 Da (in the positive mode). In this context, the overall charge state of these two Pt1Ag28 isomers is the same +2. Of note, the +2 charge state of Pt1Ag28-2 matches the crystal data, because two negative (BPh4)− counterions were observed in the crystal structure of Pt1Ag28-2. In addition, the gap between the mass peaks of two Pt1Ag28 isomers is calculated as 936.56 Da (i.e., (3637.64 − 3169.36) × 2), which is in accordance with 18-fold the molecular weight gap between HS-Adm and HS-c-C6H11 ligands.
It is accepted that the structures of nanoclusters play a decisive role in their chemical/physical properties.1a,b,1f–h The optical properties of Pt1Ag28 isomers are compared here to investigate the precise structure–property correlation. First of all, the time-dependent variation of UV-vis absorption from Pt1Ag28-1 to Pt1Ag28-2 was recorded. As shown in Fig. 3A, the absorptions at 545 and 443 nm in Pt1Ag28-1 red-shift to 575 and 455 nm, respectively, in Pt1Ag28-2. Furthermore, the 333 and 305 nm absorption peaks in Pt1Ag28-1 become more pronounced and red-shift to 350 and 315 nm, respectively. A total of four iso-absorption points are observed, centering at 307, 338, 427 and 454 nm. These iso-absorption points illustrate the high level of conversion from Pt1Ag28-1 to Pt1Ag28-2. The solution of Pt1Ag28-2 appears green to the naked eye, while the Pt1Ag28-1 solution is orange (Fig. 3A, insets). The photon energy plots of the two Pt1Ag28 isomers were recorded (Fig. 3B), which demonstrate that the energy gap (between the highest occupied molecular orbital (HOMO) and the lowest unoccupied molecular orbital (LUMO)) of Pt1Ag28-2 (1.74 eV) is much smaller than that of Pt1Ag28-1 (1.86 eV); this is possibly due to the configuration transformation from the FCC to the icosahedron. In addition, accompanied by the ligand-exchange process from Pt1Ag28-1 to Pt1Ag28-2, gradual reduction was detected in the HOMO–LUMO gap (Fig. 3B).
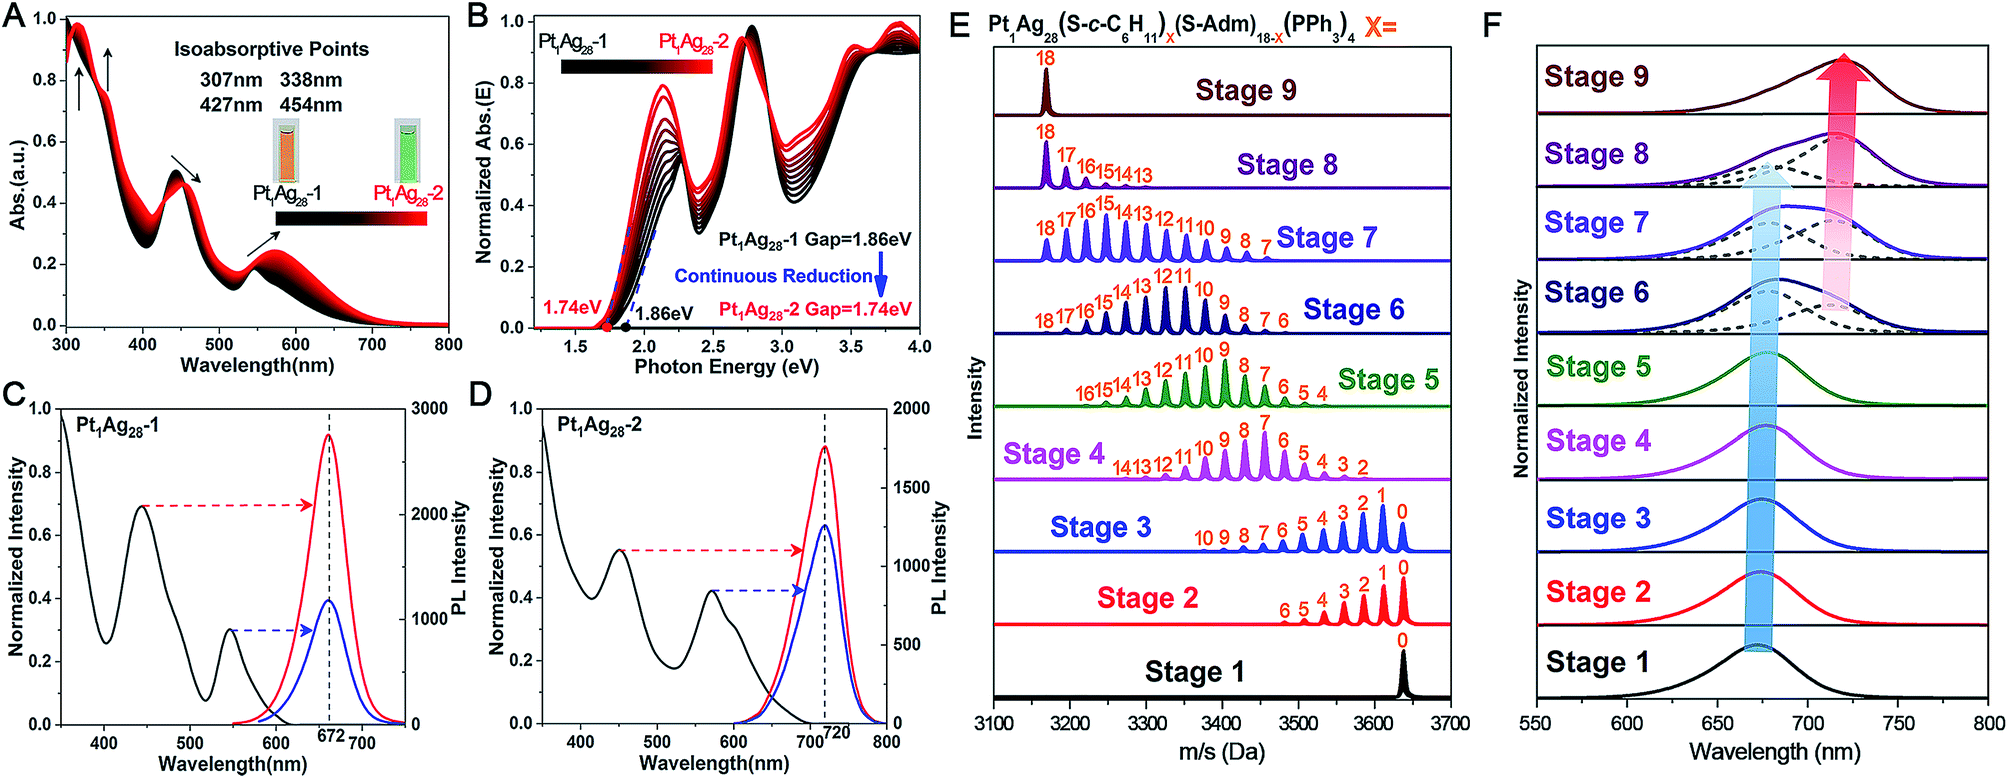 | ||
| Fig. 3 Real-time alternation of the (A) UV-vis absorption and (B) photon-energy plot from Pt1Ag28-1 (in black) to Pt1Ag28-2 (in red). Four isoabsorption points are observed at 307, 338, 427 and 454 nm, as depicted in (A). Insets of (A): photographs of the nanocluster solutions. Excitation spectrum (left) and emission spectra (right) of (C) Pt1Ag28-1 and (D) Pt1Ag28-2 at different excitation wavelengths, as indicated by the arrows. Time-dependent (E) ESI-MS spectra and (F) PL emission spectra from Pt1Ag28-1 to Pt1Ag28-2. Insets of (F): dotted curves represent the separated overlapped curves. The blue arrow indicates the red-shift and reduction of the emission at ∼672 nm. The red arrow indicates the red-shift and enhancement of the emission at ∼720 nm. | ||
Fig. 3C and D show the PL performances of the Pt1Ag28 isomers. First of all, the PL excitation spectra are almost identical to the absorption spectra, which is reminiscent of the behavior of quantum-dots and some nanoclusters.8b,13 In addition, the emission peak wavelength is not dependent on the excitation wavelength but remains at 672 nm for Pt1Ag28-1 and at 720 nm for Pt1Ag28-2. Furthermore, the emission of each isomer (i.e., 1.84 eV of Pt1Ag28-1 and 1.72 eV of Pt1Ag28-2) is very close to the HOMO–LUMO gap energy derived from the optical absorption spectrum. The extremely small difference in energy illustrates that the fluorescence corresponds to the HOMO–LUMO transition of each Pt1Ag28 isomer.
The structures of nanoclusters are determinant of their physical and chemical properties.1a,b,f–h In this context, the significant red-shift of the emission wavelength from Pt1Ag28-1 to Pt1Ag28-2 (∼50 nm) is traceable to the kernel transformation from the FCC to icosahedron. Considering that the kernel transformation is induced by the ligand exchange, we were motivated to track this configuration variation by matching the ESI-MS changes and the corresponding emission variations. Here, the ESI-MS and fluorescence variations from Pt1Ag28-1 to Pt1Ag28-2 are detected since the corresponding transformation is much slower than the reverse process, and thus is easier to monitor (see Fig. S13–S15† for the UV-vis, ESI-MS and PL variations from Pt1Ag28-2 to Pt1Ag28-1). First of all, ESI-MS measurements were performed to monitor the ligand-exchange degree of each stage from Pt1Ag28-1 to Pt1Ag28-2 (Fig. 3E), and the time-dependent ligand-exchange process in mild and stepwise modes was deduced. Furthermore, the fluorescence variation can be divided into two periods (Fig. 3F, see the lateral comparison in Fig. S16†): (Period 1) from stage 1 to stage 5: each fluorescence curve only exhibits a single characteristic peak, although the emission red-shifts from 672 nm of stage 1 to 674, 675, 677, and 678 nm of stages 2–5, respectively; (Period 2) from stage 6 to stage 9: each emission curve contains two overlapping peaks, where the front peak decreases accompanying the ligand-exchange process, but the rear one increases gradually. Finally, the fluorescence curve just exhibits a single peak at 720 nm, which is the emission of pure Pt1Ag28-2 (stage 9). Combining the variations of ESI-MS and fluorescence, the emission just displays a slight red-shift when the number of ligands exchanged on Pt1Ag28-1 is less than 9–10 (stages 1–5, depicted by the blue arrow in Fig. 3F). When exchanging more ligands onto the nanocluster, a new peak emerges at 712 nm (stage 6). This new peak gradually red-shifts and increases to the final emission at 720 nm (stages 6–9, depicted by the red arrow in Fig. 3F), in which process the peak at ∼672 nm fades away. According to these phenomena, we propose that the transformation from Pt1Ag28-1 to Pt1Ag28-2 is a two-step process (Fig. 4): (i) the motif transformation process: the outmost motif structures alter gradually when inadequate S-c-C6H11 ligands are exchanged on the surface of the Pt1Ag28 nanocluster. In this process the FCC configuration of the Pt1Ag12 kernel remains (corresponding to stages 1–5); (ii) the kernel transformation process: sharp transformation of the kernel configuration from the FCC to icosahedron occurs as long as enough foreign ligands have been exchanged on the nanocluster surface, and finally all Pt1Ag28 nanoclusters contain the icosahedral Pt1Ag12 kernel (corresponding to stages 6–9). In addition, considering that the exchanged ligands do not come into contact with the innermost Pt1Ag12 kernel directly, we speculate that the kernel transformation occurs as a result of the motif transformation.
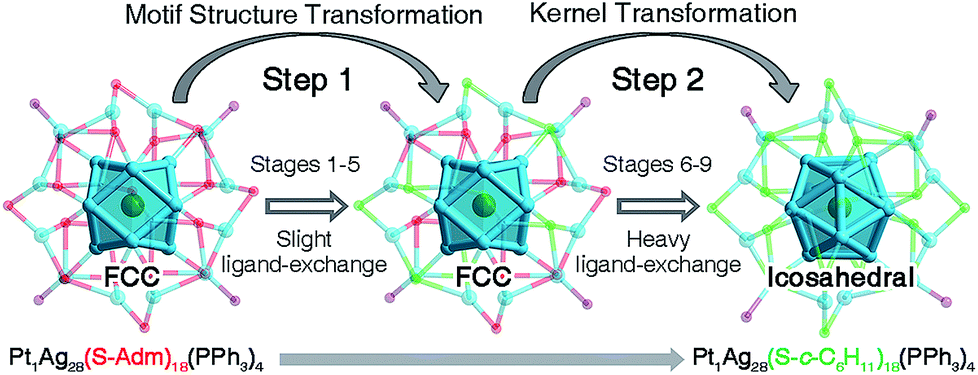 | ||
| Fig. 4 Proposed two-step transformation from Pt1Ag28-1 to Pt1Ag28-2. | ||
4.3 XAFS measurements
Our repeated attempts to crystallize the samples from stages 2–8 were unsuccessful, which might be because such Pt1Ag28 samples are protected by different proportions of S-Adm and S-c-C6H11 ligands (Fig. 3E, stages 2–8). XAFS measurements were performed for grasping the structural variation of Pt1Ag28 nanoclusters in different stages. XAFS results of stages 1, 3, 5, 7, and 9 are recorded since such results are capable of revealing the structural variations that correspond to the initial PL red-shift (672 nm → 678 nm) and the further abrupt changes (678 nm → 712 nm). As shown in Fig. 5 and Table 2 (see Fig. S17–S21† for more information), the fitted number of Pt–Ag bonds in each Pt1Ag28 sample is 12, which is in accordance with the Pt1Ag12 kernel in both FCC-Pt1Ag28 and icosahedral-Pt1Ag28 nanoclusters. Furthermore, the invariable bond lengths of Pt–Ag (remaining as 2.75 ± 0.01 Å, Table 2) in these samples validate the extremely small difference (cal. 0.72%, Table 1) in average Pt(core)–Ag(edge) bond lengths in Pt1Ag28-1 and Pt1Ag28-2.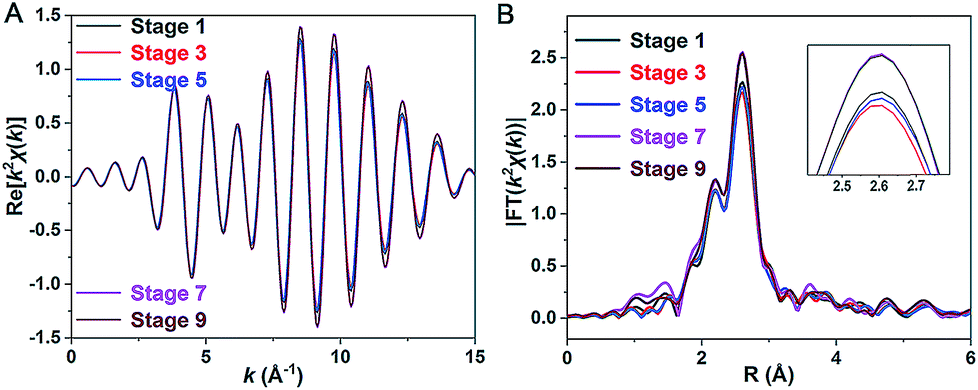 | ||
| Fig. 5 (A) k2χ(k) oscillations of Pt L3 and (B) corresponding Fourier transforms for Pt1Ag28 samples at different stages. | ||
| Stage | Path | N | R (Å) | σ 2 (10−3 Å2) | ΔE0 (eV) |
|---|---|---|---|---|---|
| 1 | Pt–Ag | 12 | 2.75 ± 0.01 | 6.9 ± 0.2 | 5.5 ± 0.6 |
| 3 | Pt–Ag | 12 | 2.75 ± 0.01 | 7.1 ± 0.2 | 5.3 ± 0.4 |
| 5 | Pt–Ag | 12 | 2.75 ± 0.01 | 7.0 ± 0.1 | 5.5 ± 0.4 |
| 7 | Pt–Ag | 12 | 2.75 ± 0.01 | 6.3 ± 0.3 | 5.7 ± 0.9 |
| 9 | Pt–Ag | 12 | 2.75 ± 0.01 | 6.3 ± 0.2 | 5.7 ± 0.7 |
Importantly, both the k2χ(k) oscillation and Fourier transform curves of stages 1–5 demonstrate that the Pt–Ag bonds are almost invariable in these stages (Fig. 5 and Table 2); however, the lower intensity of the Fourier transformed EXAFS k2χ(k) oscillations in stages 1–5 than in stages 7–9 indeed shows the higher disorder degree of Pt–Ag bonds in the former, i.e., the larger Debye–Waller factor σ2 listed in Table 2. Generally, the Debye–Waller factor σ2 is a sum of two components, thermal disorder (σT2) and structural disorder (σS2), i.e., σ2 = σT2 + σS2. From the single crystal XRD analysis (Table 1), the Pt–Ag bond lengths in Pt1Ag28-1 span a narrower range of 0.029 Å (from 2.768 to 2.797 Å, average 2.783 Å) than that (0.047 Å, varying from 2.744 to 2.791 Å, average 2.763 Å) in Pt1Ag28-2, indicating a smaller structural disorder σS2 in the FCC isomer. The larger σ2 but smaller σS2 of the Pt–Ag bonds in Pt1Ag28-1 than in icosahedral Pt1Ag28-2 suggests that the thermal disorder σT2 is larger in Pt1Ag28-1. It is known that when the measurement temperature T is close to or higher than the Einstein temperature of a bond, the thermal disorder σT2 could be approximated by the correlated Einstein model: σT2 = kBT/keff, where kB is the Einstein temperature and keff is the effective spring constant of the bond.14 Therefore, the larger thermal disorder σT2 in Pt1Ag28-1 indicates that the Pt–Ag interaction (reflected by the effective spring constant) is weaker in Pt1Ag28-1 than in Pt1Ag28-2, or the Pt–Ag bond is strengthened in Pt1Ag28-2. This deduction is supported by the fact that, from the XRD analysis, the average Pt–Ag bond length (2.783 Å) in Pt1Ag28-1 is longer by 0.02 Å than that (2.763 Å) in Pt1Ag28-2. More support could also be afforded by the Kohn–Sham molecular orbitals (MO) of both clusters yielded by DFT calculations (Fig. S22†). The bonding HOMO orbitals of Pt1Ag28-1 are composed of 2.16% Pt 6sp, 2.29% Pt 5d, 26.03% Ag 5sp, 20.3% Ag 4d, and 41.67% S 3p orbitals, while the HOMO orbitals of Pt1Ag28-2 are composed of 4.08% Pt 6sp, 1.24% Pt 5d, 39.79% Ag 5sp, 21.46% Ag 4d, and 26.97% S 3p orbitals. The smaller amount of Pt orbital components in Pt1Ag28-1 than in Pt1Ag28-2 (4.45% versus 5.22%) suggests the weaker Pt–Ag bonding in the former. This is also consistent with the consideration based on antibonding LUMO orbitals, where Pt1Ag28-1 has a larger amount of Pt orbital components than Pt1Ag28-2 (8.04% versus 7.33%).
EXAFS results indeed illustrate that the kernel transformation occurs within the ligand-exchange process from stage 5 to stage 7. Such a process (stage 5 → stage 7) is also regarded as the break point where significant PL variation occurs (Fig. 3F). In this context, by combining the ESI-MS, PL and EXAFS variation results, it has been unambiguously demonstrated that the nanocluster configuration transformation (from FCC to icosahedron) contains two discrete steps: the motif transformation and the kernel transformation. Specifically, in the early stage of the ligand-exchange process (stages 1–5), only the motif transformation occurs, which hardly affects the inner Pt–Ag bonds; when enough foreign ligands are exchanged on the Pt1Ag28 nanocluster (stages 5–9), remarkable transformation in the kernel occurs and the FCC configuration turns into the icosahedral configuration.
4.4 Temperature-dependent PL
The PL QY of Pt1Ag28-2 is only 2.7% at room temperature, which is much lower than that of Pt1Ag28-1 (QY ∼ 4.9%). However, Pt1Ag28-2 can emit bright-red light at low temperature (QY ∼ 100% at 98 K or lower temperature). Accordingly, the fluorescence intensity increased significantly (a 63-fold increase by comparing the 98 K data with the 293 K data) when the temperature is reduced to 98 K (Fig. 6A–C), and the UV-vis absorption presents a 1.8-fold enhancement (Fig. 6D). In this context, the PL QY of Pt1Ag28-2 increases to almost 100%. In detail, when the temperature is higher than 250 K, the PL intensity is so weak that it cannot be observed by the naked eye (Fig. 6B, inset 275 K). When the temperature is continually reduced, the PL intensity enhances rapidly, and an obvious emission can be observed at 173 K (Fig. 6B, inset 173 K). Furthermore, the emission of Pt1Ag28-2 nanoclusters is considerably bright when the temperature is reduced to 98 K or lower (Fig. 6B, inset 98 K). The enhanced PL intensity of Pt1Ag28-2 is induced by the restrained thermal vibration (non-radiative transition) of the nanoclusters at low temperature, and thus the energy loss is just fluorescence (radiative transition).15 For comparison, the PL variation of Pt1Ag28-1 accompanying the reduction of the temperature is exhibited in Fig. S23.†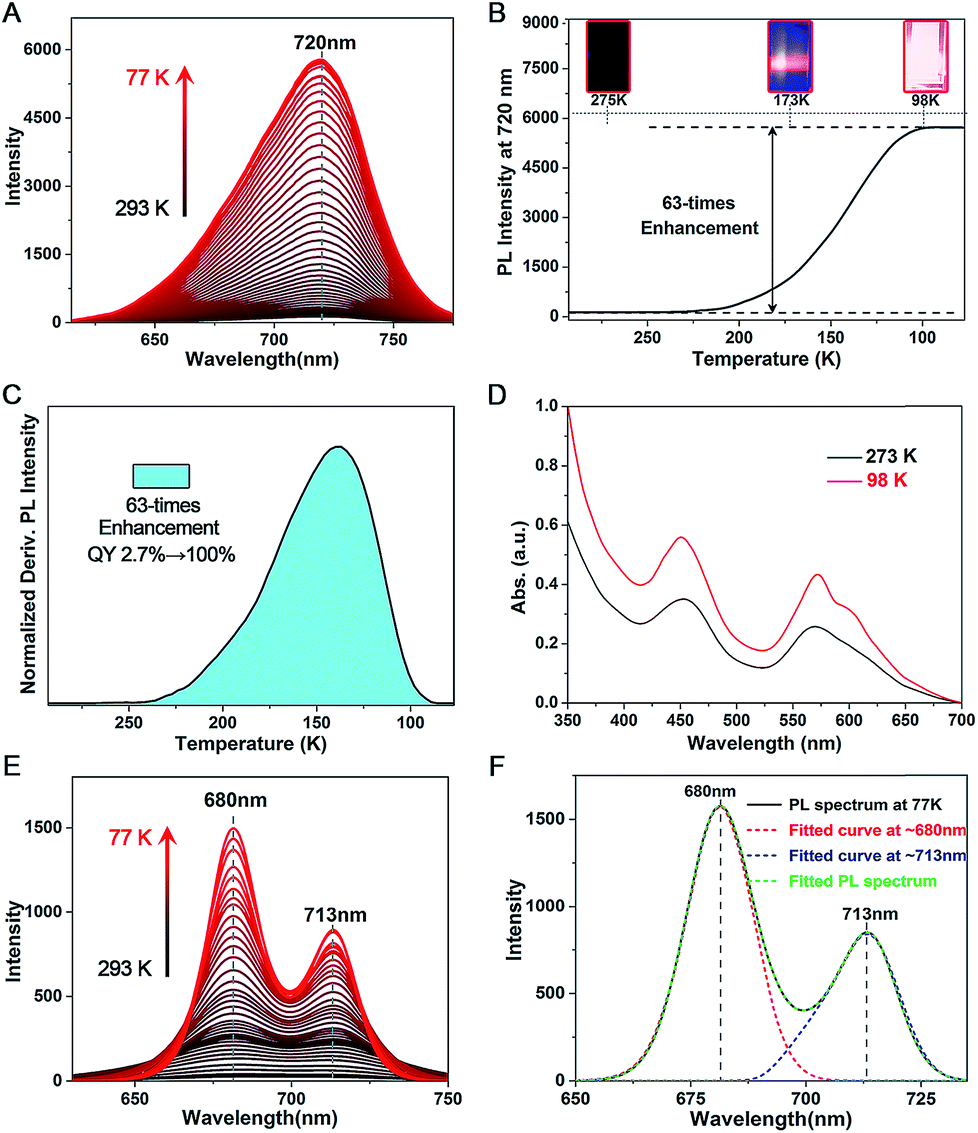 | ||
| Fig. 6 (A) PL variation of Pt1Ag28-2 accompanying the reduction of temperature (from 293 K to 77 K, monitored per 3 K). (B) PL intensity at a fixed wavelength of 720 nm of Pt1Ag28-2 at different temperatures. Insets: the digital photographs of Pt1Ag28-2 solution under UV light. (C) Derivative result on the PL intensity of Pt1Ag28-2. (D) Temperature-dependent UV-vis absorption of Pt1Ag28-2. (E) PL variation of the intermediate ligand-exchange product (stage 7) accompanying the reduction of temperature. (F) Fitted curves of the PL spectrum of the intermediate ligand-exchange product (stage 7) measured at 77 K. | ||
Temperature-dependent PL spectra were also measured on the intermediate ligand-exchange Pt1Ag28 product. Specifically, we chose the product of stage 7 (see Fig. 3E and F) because the PL spectrum of this product displays the most obvious overlapping peaks. As shown in Fig. 6E, accompanying the reduction of temperature from 293 K to 77 K, the overlapped peaks become sharper and more separated. Meanwhile, the emission intensity appears to be significantly enhanced in the temperature reduction process. In this context, the peak-fitting becomes more easy and precise. Fig. 6F exhibits the overlapped curves from the PL spectrum of the intermediate ligand-exchange product (stage 7) measured at 77 K. Two independent curves were separated from the multi-peak PL spectrum, and they center at 680 and 713 nm, respectively. Of note, the fitting-peak positions are retained for these two separated curves; however, following the temperature reduction, the relative intensity of the fitted curve at ∼680 nm becomes stronger relative to the other one, which demonstrates the different emission performance of the FCC-Pt1Ag28 and icosahedral-Pt1Ag28 nanoclusters with the temperature reduction.
5 Conclusions
In summary, a ligand-exchange method was exploited to reversibly transform the Pt1Ag28-1 nanoclusters with a FCC configuration and the Pt1Ag28-2 nanoclusters with an icosahedral configuration. This is the first time that the isomerism phenomenon with reversible configurations has been observed. ESI-MS, PL and EXAFS results were combined to illustrate that the configuration transformation (between FCC and icosahedron) is a two-step process, including the outmost motif transformation process and the innermost kernel transformation process, where the latter transformation is induced by the former one. Based on these Pt1Ag28 isomers, the corresponding structure–optical property correlation was evaluated. UV-vis absorption, together with PL emission, demonstrates a reduced HOMO–LUMO gap of Pt1Ag28-2 compared with that of Pt1Ag28-1. Overall, this work presents a nanocluster isomer system with a reversibly transforming configuration, which hopefully draws great attention of structural and theoretical chemists to fully understand the structural transformations as well as the structure–property correlation of metal nanoclusters.Conflicts of interest
There are no conflicts to declare.Acknowledgements
We acknowledge the financial support by the NSFC (U1532141, 21631001, 21871001, 21803001, U1632263), the Ministry of Education, the Education Department of Anhui Province (KJ2017A010), and the 211 Project of Anhui University.Notes and references
- (a) R. Jin, C. Zeng, M. Zhou and Y. Chen, Chem. Rev., 2016, 116, 10346 CrossRef CAS PubMed; (b) I. Chakraborty and T. Pradeep, Chem. Rev., 2017, 117, 8208 CrossRef CAS PubMed; (c) Q. Yao, X. Yuan, T. Chen, D. T. Leong and J. Xie, Adv. Mater., 2018, 30, 1802751 CrossRef; (d) B. Bhattarai, Y. Zaker, A. Atnagulov, B. Yoon, U. Landman and T. P. Bigioni, Acc. Chem. Res., 2018, 51, 3104 CrossRef CAS PubMed; (e) P. Liu, R. Qin, G. Fu and N. Zheng, J. Am. Chem. Soc., 2017, 139, 2122 CrossRef CAS PubMed; (f) M. Agrachev, M. Ruzzi, A. Venzo and F. Maran, Acc. Chem. Res., 2019, 52, 44 CrossRef CAS PubMed; (g) K. Kwak and D. Lee, Acc. Chem. Res., 2019, 52, 12 CrossRef CAS PubMed; (h) B. Nieto-Ortega and T. Bürgi, Acc. Chem. Res., 2018, 51, 2811 CrossRef CAS PubMed; (i) K. L. D. M. Weerawardene, H. Häkkinen and C. M. Aikens, Annu. Rev. Phys. Chem., 2018, 69, 205 CrossRef CAS PubMed; (j) W. W. Xu, X. C. Zeng and Y. Gao, Acc. Chem. Res., 2018, 51, 2739 CrossRef CAS PubMed; (k) Q. Tang, G. Hu, V. Fung and D.-e. Jiang, Acc. Chem. Res., 2018, 51, 2793 CrossRef CAS PubMed; (l) N. A. Sakthivel and A. Dass, Acc. Chem. Res., 2018, 51, 1774 CrossRef CAS; (m) Z. Lei, X.-K. Wan, S.-F. Yuan, Z.-J. Guan and Q.-M. Wang, Acc. Chem. Res., 2018, 51, 2465 CrossRef CAS PubMed; (n) J. Yan, B. K. Teo and N. Zheng, Acc. Chem. Res., 2018, 51, 3084 CrossRef CAS PubMed; (o) T. Zhao, P. J. Herbert, H. Zheng and K. L. Knappenberger, Acc. Chem. Res., 2018, 51, 1433 CrossRef CAS PubMed; (p) X. Kang and M. Zhu, Chem. Soc. Rev., 2019, 48, 2422 RSC.
- (a) P. D. Jadzinsky, G. Calero, C. J. Ackerson, D. A. Bushnell and R. D. Kornberg, Science, 2007, 318, 430 CrossRef CAS PubMed; (b) A. Desireddy, B. E. Conn, J. Guo, B. Yoon, R. N. Barnett, B. M. Monahan, K. Kirschbaum, W. P. Griffith, R. L. Whetten, U. Landman and T. P. Bigioni, Nature, 2013, 501, 399 CrossRef CAS PubMed; (c) S. Takano, H. Hirai, S. Muramatsu and T. Tsukuda, J. Am. Chem. Soc., 2018, 140, 12314 CrossRef CAS; (d) T.-A. D. Nguyen, Z. R. Jones, B. R. Goldsmith, W. R. Buratto, G. Wu, S. L. Scott and T. W. Hayton, J. Am. Chem. Soc., 2015, 137, 13319 CrossRef CAS PubMed; (e) S. Sharma, K. K. Chakrahari, J.-Y. Saillard and C. W. Liu, Acc. Chem. Res., 2018, 51, 2475 CrossRef CAS PubMed; (f) S. Hossain, Y. Niihori, L. V. Nair, B. Kumar, W. Kurashige and Y. Negishi, Acc. Chem. Res., 2018, 51, 3114 CrossRef CAS PubMed; (g) R.-W. Huang, Y.-S. Wei, X.-Y. Dong, X.-H. Wu, C.-X. Du, S.-Q. Zang and T. C. W. Mak, Nat. Chem., 2017, 9, 689 CrossRef CAS PubMed; (h) B. Du, X. Jiang, A. Das, Q. Zhou, M. Yu, R. Jin and J. Zheng, Nat. Nanotechnol., 2017, 12, 1096 CrossRef CAS PubMed; (i) M. Sugiuchi, Y. Shichibu and K. Konishi, Angew. Chem., Int. Ed., 2018, 57, 7855 CrossRef CAS PubMed; (j) C. A. Hosier and C. J. Ackerson, J. Am. Chem. Soc., 2019, 141, 309 CrossRef CAS PubMed; (k) Y. Lin, P. Charchar, A. J. Christofferson, M. R. Thomas, N. Todorova, M. M. Mazo, Q. Chen, J. Doutch, R. Richardson, I. Yarovsky and M. M. Stevens, J. Am. Chem. Soc., 2018, 140, 18217 CrossRef CAS PubMed; (l) G. Panapitiya, G. Avendaño-Franco, P. Ren, X. Wen, Y. Li and J. P. Lewis, J. Am. Chem. Soc., 2018, 140, 17508 CrossRef CAS PubMed.
- (a) H.-E. Lee, H.-Y. Ahn, J. Mun, Y. Y. Lee, M. Kim, N. H. Cho, K. Chang, W. S. Kim, J. Rho and K. T. Nam, Nature, 2018, 556, 360 CrossRef CAS PubMed; (b) W. Ma, L. Xu, A. F. de Moura, X. Wu, H. Kuang, C. Xu and N. A. Kotov, Chem. Rev., 2017, 117, 8041 CrossRef CAS PubMed; (c) H. Kanai, S. B. Choe and K. J. Klabunde, J. Am. Chem. Soc., 1986, 108, 2019 CrossRef CAS; (d) S. B. Choe, H. Kanai and K. J. Klabunde, J. Am. Chem. Soc., 1989, 111, 2875 CrossRef CAS; (e) K. J. Klabunde, T. Groshens, H. F. Efner and M. J. Kramer, J. Organomet. Chem., 1978, 157, 91 CrossRef CAS.
- (a) J. Yan, H. Su, H. Yang, C. Hu, S. Malola, S. Lin, B. K. Teo, H. Häkkinen and N. Zheng, J. Am. Chem. Soc., 2016, 138, 12751 CrossRef CAS PubMed; (b) Y. Zhu, H. Wang, K. Wan, J. Guo, C. He, Y. Yu, L. Zhao, Y. Zhang, J. Lv, L. Shi, R. Jin, X. Zhang, X. Shi and Z. Tang, Angew. Chem., Int. Ed., 2018, 57, 9059 CrossRef CAS PubMed; (c) G. Deng, S. Malola, J. Yan, Y. Han, P. Yuan, C. Zhao, X. Yuan, X. S. Lin, Z. Tang, B. K. Teo, H. Häkkinen and N. Zheng, Angew. Chem., Int. Ed., 2018, 57, 3421 CrossRef CAS PubMed; (d) H. Yang, J. Yan, Y. Wang, G. Deng, H. Su, X. Zhao, C. Xu, B. K. Teo and N. Zheng, J. Am. Chem. Soc., 2017, 139, 16113 CrossRef CAS PubMed; (e) S. Li, X.-S. Du, B. Li, J.-Y. Wang, G.-P. Li, G.-G. Gao and S.-Q. Zang, J. Am. Chem. Soc., 2018, 140, 594 CrossRef CAS PubMed.
- (a) I. Dolamic, B. Varnholt and T. Bürgi, Nat. Commun., 2015, 6, 7117 CrossRef CAS PubMed; (b) I. Dolamic, S. Knoppe, A. Dass and T. Bürgi, Nat. Commun., 2012, 3, 798 CrossRef PubMed; (c) S. Takano and T. Tsukuda, J. Phys. Chem. Lett., 2016, 7, 4509 CrossRef CAS PubMed; (d) N. V. Karimova and C. M. Aikens, J. Phys. Chem. C, 2018, 122, 11051 CrossRef CAS; (e) M. Zhu, H. Qian, X. Meng, S. Jin, Z. Wu and R. Jin, Nano Lett., 2011, 11, 3963 CrossRef CAS; (f) Q. Tang, R. Ouyang, Z. Tian and D.-e. Jiang, Nanoscale, 2015, 7, 2225 RSC.
- (a) S. Tian, Y.-Z. Li, M.-B. Li, J. Yuan, J. Yang, Z. Wu and R. Jin, Nat. Commun., 2015, 6, 8667 CrossRef CAS PubMed; (b) J. Chen, L. Liu, X. Liu, L. Liao, S. Zhuang, S. Zhou, J. Yang and Z. Wu, Chem.–Eur. J., 2017, 23, 18187 CrossRef CAS PubMed; (c) S. Zhuang, L. Liao, M.-B. Li, C. Yao, Y. Zhao, H. Dong, J. Li, H. Deng, L. Lie and Z. Wu, Nanoscale, 2017, 9, 14809 RSC; (d) C. Zeng, T. Li, A. Das, N. L. Rosi and R. Jin, J. Am. Chem. Soc., 2013, 135, 10011 CrossRef CAS PubMed; (e) Y. Chen, C. Liu, Q. Tang, C. Zeng, T. Higaki, A. Das, D.-e. Jiang, N. L. Rosi and R. Jin, J. Am. Chem. Soc., 2016, 138, 1482 CrossRef CAS PubMed; (f) S. Jin, F. Xu, W. Du, X. Kang, S. Chen, J. Zhang, X. Li, D. Hu, S. Wang and M. Zhu, Inorg. Chem., 2018, 57, 5114 CrossRef CAS PubMed; (g) S. Zhuang, L. Liao, J. Yuan, N. Xia, Y. Zhao, C. Wang, Z. Gan, N. Yan, L. He, J. Li, H. Deng, Z. Guan, J. Yang and Z. Wu, Angew. Chem., Int. Ed., 2019, 58, 4510 CrossRef CAS PubMed.
- (a) N. A. Sakthivel, M. Stener, L. Sementa, A. Fortunelli, G. Ramakrishna and A. Dass, J. Phys. Chem. Lett., 2018, 9, 1295 CrossRef CAS PubMed; (b) T. Higaki, M. Zhou, K. J. Lambright, K. Kirschbaum, M. Y. Sfeir and R. Jin, J. Am. Chem. Soc., 2018, 140, 5691 CrossRef CAS; (c) Q. Yao, X. Yuan, V. Fung, Y. Yu, D. T. Leong, D.-e. Jiang and J. Xie, Nat. Commun., 2017, 8, 927 CrossRef.
- (a) L. Liao, S. Zhuang, C. Yao, N. Yan, J. Chen, C. Wang, N. Xia, X. Liu, M.-B. Li, L. Li, X. Bao and Z. Wu, J. Am. Chem. Soc., 2016, 138, 10425 CrossRef CAS PubMed; (b) X. Kang, M. Zhou, S. Wang, S. Jin, G. Sun, M. Zhu and R. Jin, Chem. Sci., 2017, 8, 2581 RSC; (c) H. Dong, L. Liao and Z. Wu, J. Phys. Chem. Lett., 2017, 8, 5338 CrossRef CAS PubMed; (d) C. Zeng, H. Qian, T. Li, G. Li, N. L. Rosi, B. Yoon, R. N. Barnett, R. L. Whetten, U. Landman and R. Jin, Angew. Chem., Int. Ed., 2012, 51, 13114 CrossRef CAS PubMed.
- J. P. Perdew, K. Burke and M. Ernzerhof, Phys. Rev. Lett., 1996, 77, 3865 CrossRef CAS PubMed.
- E. J. Baerends, T. Ziegler, J. Autschbach, D. Bashford, A. Bérces, F. M. Bickelhaupt, C. Bo, P. M. Boerrigter, L. Cavallo, D. P. Chong, L. Deng, R. M. Dickson, D. E. Ellis, M. van Faassen, L. Fan, T. H. Fischer, C. Fonseca Guerra, M. Franchini, A. Ghysels, A. Giammona, S. J. A. van Gisbergen, A. W. Götz, J. A. Groeneveld, O. V. Gritsenko, M. Grüning, S. Gusarov, F. E. Harris, P. van den Hoek, C. R. Jacob, H. Jacobsen, L. Jensen, J. W. Kaminski, G. van Kessel, F. Kootstra, A. Kovalenko, M. V. Krykunov, E. van Lenthe, D. A. McCormack, A. Michalak, M. Mitoraj, S. M. Morton, J. Neugebauer, V. P. Nicu, L. Noodleman, V. P. Osinga, S. Patchkovskii, M. Pavanello, P. H. T. Philipsen, D. Post, C. C. Pye, W. Ravenek, J. I. Rodríguez, P. Ros, P. R. T. Schipper, G. Schreckenbach, J. S. Seldenthuis, M. Seth, J. G. Snijders, M. Solà, M. Swart, D. Swerhone, G. te Velde, P. Vernooijs, L. Versluis, L. Visscher, O. Visser, F. Wang, T. A. Wesolowski, E. M. van Wezenbeek, G. Wiesenekker, S. K. Wolff, T. K. Woo and A. L. Yakovlev. ADF2013, SCM, Theoretical Chemistry, Vrije Universiteit, Amsterdam, The Netherlands, http://www.scm.com.
- S. Chen, L. Xiong, S. Wang, Z. Ma, S. Jin, H. Sheng, Y. Pei and M. Zhu, J. Am. Chem. Soc., 2016, 138, 10754 CrossRef CAS PubMed.
- S. Yang, J. Chai, Y. Song, J. Fan, T. Chen, S. Wang, H. Yu, X. Li and M. Zhu, J. Am. Chem. Soc., 2017, 139, 5668 CrossRef CAS PubMed.
- (a) H. Wu, H. Zhu, J. Zhuang, S. Yang, C. Liu and Y. C. Cao, Angew. Chem., Int. Ed., 2008, 47, 3730 CrossRef CAS PubMed; (b) S. Wang, X. Meng, A. Das, T. Li, Y. Song, T. Cao, X. Zhu, M. Zhu and R. Jin, Angew. Chem., Int. Ed., 2014, 53, 2376 CrossRef CAS PubMed.
- A. I. Frenkel and J. J. Rehr, Phys. Rev. B: Condens. Matter Mater. Phys., 1993, 48, 585 CrossRef CAS PubMed.
- (a) X. Kang, S. Wang and M. Zhu, Chem. Sci., 2018, 9, 3062 RSC; (b) X. Wei, X. Kang, Q. Yuan, C. Qin, S. Jin, S. Wang and M. Zhu, Chem. Mater., 2019, 31, 4945 CrossRef CAS.
Footnote |
| † Electronic supplementary information (ESI) available: Fig. S1–S23 showing the total structure, TGA and XPS results of Pt1Ag28-2; the stability test; DPV results; catalytic activity results; TEM images; structural comparison between Pt1Ag28-1 and Pt1Ag28-2; time-dependent UV-vis spectra, PL spectra and ESI-MS results from Pt1Ag28-2 to Pt1Ag28-1; detailed XAFS results; TDDFT results; temperature-dependent PL and UV-vis spectra of Pt1Ag28-2; the crystal data and structure refinement for Pt1Ag28-2. CCDC 1840953. For ESI and crystallographic data in CIF or other electronic format see DOI: 10.1039/c9sc02667c |
| This journal is © The Royal Society of Chemistry 2019 |