
 Open Access Article
 This Open Access Article is licensed under a Creative Commons Attribution-Non Commercial 3.0 Unported Licence
Rational synthesis of three-dimensional core–double shell upconversion nanodendrites with ultrabright luminescence for bioimaging application†
Murad M. A.
Abualrejal
ab,
Kamel
Eid
 c,
Rongrong
Tian
ab,
Lin
Liu
ad,
Hongda
Chen
a,
Aboubakr M.
Abdullah
c and
Zhenxin
Wang
*ab
c,
Rongrong
Tian
ab,
Lin
Liu
ad,
Hongda
Chen
a,
Aboubakr M.
Abdullah
c and
Zhenxin
Wang
*ab
aState Key Laboratory of Electroanalytical Chemistry, Changchun Institute of Applied Chemistry, Chinese Academy of Sciences, Changchun, 130022, P. R. China. E-mail: wangzx@ciac.ac.cn
bUniversity of Science and Technology of China, Road Baohe District, Hefei, Anhui 230026, P. R. China
cCentre for Advanced Materials, Qatar University, Doha 2713, Qatar
dCollege of Chemistry, Jilin University, Changchun 130012, P. R. China
First published on 19th June 2019
Abstract
Engineering the morphology of rare-earth doped NaYF4-based upconversion nanoparticles (UCNPs) can effectively tune their upconversion luminescence emission (UCLE) properties. Herein, we rationally synthesized a new class of three-dimensional upconversion core–double-shell nanodendrites (UCNDs) including an active core (NaYF4:Yb,Er,Ca) capped by a transition layer (NaYF4:Yb,Ca) and an active outer shell (NaNdF4:Yb,Ca). The high concentration of the Nd3+ sensitizer in the outer dendritic shell enhances the luminescence intensity, while the transition layer enriched with Yb3+ acts as an efficient energy migration network between the outer shell and inner core along with preventing the undesired quenching effects resulting from Nd3+. These unique structural and compositional merits enhanced the UCLE of UCNDs by 5 and 15 times relative to NaYF4:Yb,Er,Ca@NaYF4:Yb,Ca truncated core–shell UCNPs and NaYF4:Yb,Er,Ca spherical core UCNPs, respectively, under excitation at 980 nm. The SiO2–COOH layer coated UCNDs (UCND@SiO2–COOH) were successfully used as efficient long-term luminescent probes for in vitro and in vivo bioimaging without any significant toxicity. The uptake and retention of UCND@SiO2–COOH were mostly found in the liver and spleen. This study may open the way towards the preparation of three-dimensional UCND nanostructures for biomedical applications.
Introduction
Rare-earth Yb3+ and Er3+ doped NaYF4-based UCNPs are highly promising in bioimaging applications owing to their low phonon energies, inferior autofluorescence background, deep penetration lengths, high brightness, excellent stabilities, and nonblinking emissions.1–10 These merits depend on the size, morphology, and composition of NaYF4:Yb3+/Er3+ UCNPs.11,12 For example, the UCLE intensity of NaYF4:Yb3+/Er3+/Tm3+ nanoplates was significantly superior to that of its counterparts such as nanospheres, nanoellipses and nanoprisms.13,14 Y2O3:1% Er3+,4% Yb3+ UCNPs exhibit blue, red, and green UCLE with different intensities via decreasing their particle size.15 β-NaYF4:Yb,Tm@β-NaYF4:Yb,Er core–shell UCNPs emitted multicolor UCLE ranging from visible-light to near infra-red (NIR).16 Similarly, BaGdF5:Yb3+/Er3+ core–shell UCNPs enhanced the UCLE by 4 times compared to β-NaYF4:Yb3+/Er3+ UCNPs.17Unlike other morphologies, core–multiple shell nanostructures offer higher UCLE, lower radiative decay loss, and multicolor emissions along with tailoring the energy transfer from the activators to the sensitizers and eliminating energy back-transfer.18–20 For instance, NaYF4:Nd/Yb/Tm@NaYF4:Nd core–double shell UCNPs increased the UCLE by 7 times relative to NaYF4:Nd/Yb/Tm@NaYF4 core–shell UCNPs.21
Despite the significant progress in the fabrication of core–multiple shell NPs their photon harvesting efficiency is still limited.18,22,23 Also, previous reports on the core–shell and/or core–double shell UCNPs focused mainly on zero-dimensional nanostructures and rarely on three-dimensional branched nanostructures such as dendritic and flower shaped ones.24–27 Nanodendrites are among the most attractive nanoarchitectures, owing to their high surface area to volume ratio, low density, and multiple surface corners and cavities, which can enhance the absorption and emission process along with no radiation.24,25 Additionally, nanodendrites are not vulnerable to aggregation relative to other nanostructures. It is noteworthy that the cytotoxicity and bioimaging application of UCNDs are not yet reported to the best of our knowledge.
Herein, we present a new class of three-dimensional core–double shell UCNDs composed of a core (NaYF4:Yb,Er,Ca), a transition layer (NaYF4:Yb,Ca), and an outer shell (NaNdF4:Yb,Ca) by the thermal decomposition approach. The as-designed UCNDs are formed in a distinct three-dimensional nanoarchitecture shape self-assembled with multiple arms surrounding a truncated middle core and spherical inner core. The newly designed UCNDs possess various benefits over traditional UCNPs. Particularly, UCNDs combine the unique properties of core–double shell structures (e.g., high UCLE, lower radiative decay loss, multicolor emissions and low phonon energies) and the inimitable merits of nanodendrites (e.g., high accessible surface area, low density, great stability and multiple surface corners). The transition layer enriched with Yb3+ allows efficient excitation energy transfer between Nd3+ and Er3+ along with precluding the undesired quenching effects that originate from Nd3+ confined in the outer shell in high content. Inspired by these outstanding properties, the UCLE of UCNDs and UCND@SiO2–COOH was benchmarked relative to core UCNPs and core–shell UCNPs. Additionally, the in vitro and in vivo UCL bioimaging properties of UCND@SiO2–COOH were deeply investigated for demonstrating the capability of UCNDs in biological analysis.
Results and discussion
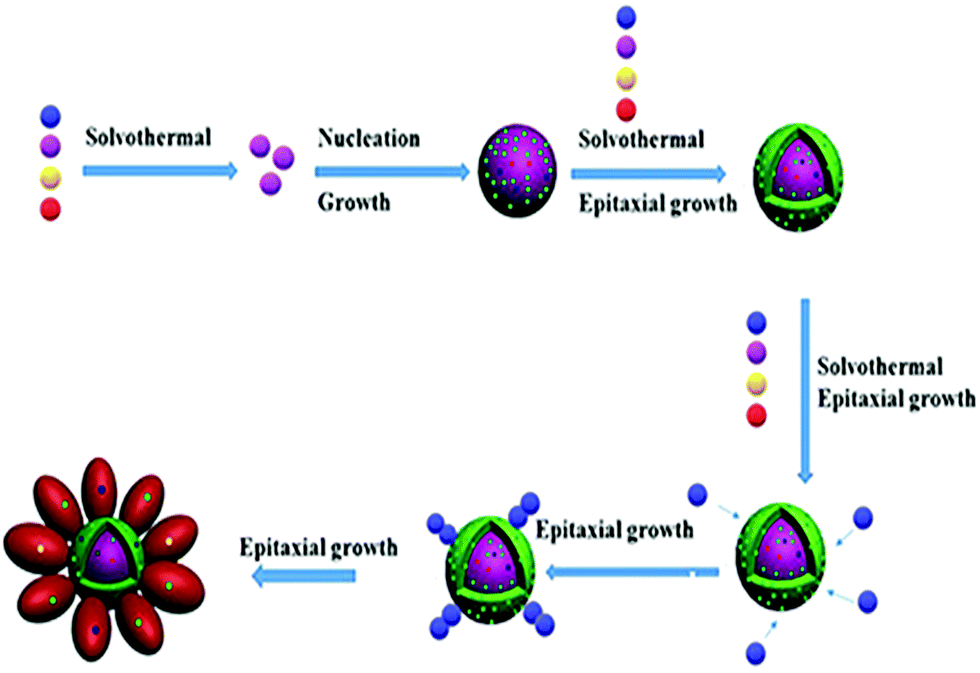
Three-dimensional core–double shell UCNDs were successfully prepared by the modified thermal decomposition method (Scheme 1). This includes the initial formation of the UCNP core that acts as the starting seed for the epitaxial growth of an intermediate shell followed by subsequent epitaxial growth of a dendritic shell. The UCNDs with a high content of the Nd3+ sensitizer in the outer dendritic shell harvest the energy, while the middle layer not only transfers the energy efficiently from the outer shell to the inner core but also acts as a protective shield for suppressing the unwanted quenching effects resulting from Nd3+ (Fig. 1a). Fig. 1b shows the TEM image of typically prepared core UCNPs formed in a high yield as spherical-like nanocrystals without any kind of undesired byproducts, which indicates their high purity. The UCNP core is uniformly monodispersed and has an average diameter of 12 ± 2 nm. The TEM image warrants that the core–shell UCNPs are produced in a truncated nanocrystal shape and have an average size of 24 ± 3 nm in diameter (Fig. 1c). The slight change in the shape and increment in the particle size are attributed to the shell growth. Finally, the second shell grows in a dendritic shape with multiple arms (Fig. 1d). The typically prepared UCNDs are monodispersed with an average size of 65 ± 4 nm (Fig. 2a and 1d).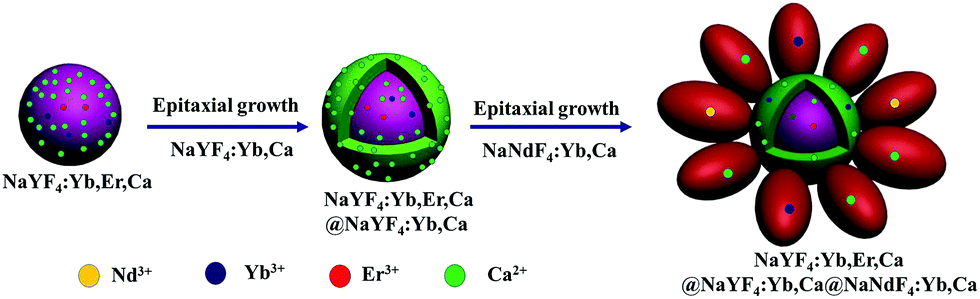 | ||
| Scheme 1 The fabrication process of UCNDs. | ||
 | ||
| Fig. 1 (a) Schematic diagram of UCNDs composed of a core–double shell with their ability to absorb and transfer energy along with their ability to suppress luminescence quenching. TEM images of (b) UCNP core, (c) UCNP core–shell and (d) UCND core–double shell. | ||
 | ||
| Fig. 2 (a) TEM image and (b) HRTEM image of UCNDs. (c) TEM image and (d) HRTEM image of UCND@SiO2–COOH. (e–h) HRTEM images recorded from the numbered areas in (d). | ||
The high-resolution TEM (HRTEM) image of an individual UCND clearly shows its three-dimensional morphology with overgrowth of multiple branches (Fig. 2b). These branches grow at multiple sites on the entire surface of the core–shell UCNPs, which provide various nucleation sites for uniform distribution of the branches without overlapping. The as-formed hydrophobic UCNDs were coated with a SiO2–COOH layer to make them hydrophilic and viable for biomedical applications through a water-in-oil reverse microemulsion method (see the ESI† for details).28 The UCND@SiO2–COOH retained its nanodendritic morphology without any changes after the coating process (Fig. 2c). The HRTEM of a single UCND@SiO2–COOH shows an obvious diffuse shell with an average thickness of 3 ± 1.5 nm surrounding the branched shell, arising from the SiO2–COOH coating (Fig. 2d).
The HRTEM image of the numbered area in the core (Fig. 2d) shows its uniform and continuous lattice fringes extended coherently from the core towards the shell area (Fig. 2e). This demonstrates the epitaxial growth of the core–shell, owing to the inferior lattice mismatch between the core–shell elements (Fig. 2e). The interplanar d-spacing was measured to be 0.341 nm assigned to the {311} facet of the NaYF4-based material. The HRTEM images of the branches reveal their single crystalline structure with uniform and continuous lattice fringes (Fig. 2f–h). This indicates that the UCNDs were formed through direct nucleation rather than random agglomeration. The determined d-spacings in the arms are about 0.284, 0.094, and 0.163 nm associated with the {300}, {100}, and {110} crystal planes of NaNdF4-based materials, respectively (Fig. 2f–h). This implies the formation of the NaNdF4 shell with high index facets that are important for the enhancement of the optical characteristics and energy absorption during UCLE.29,30
Fig. 3a shows the HAADF-STEM image of UCND@SiO2–COOH which reveals their nanodendritic structures with multiple branches and a truncated core as well. The obvious intense contrast between the core and branched shell implies the formation of the three-dimensional core–double shell nanodendertic morphology. The SiO2–COOH coating is also evidenced as reflected in the clear shell capping the surface of UCND@SiO2–COOH (Fig. 3a).
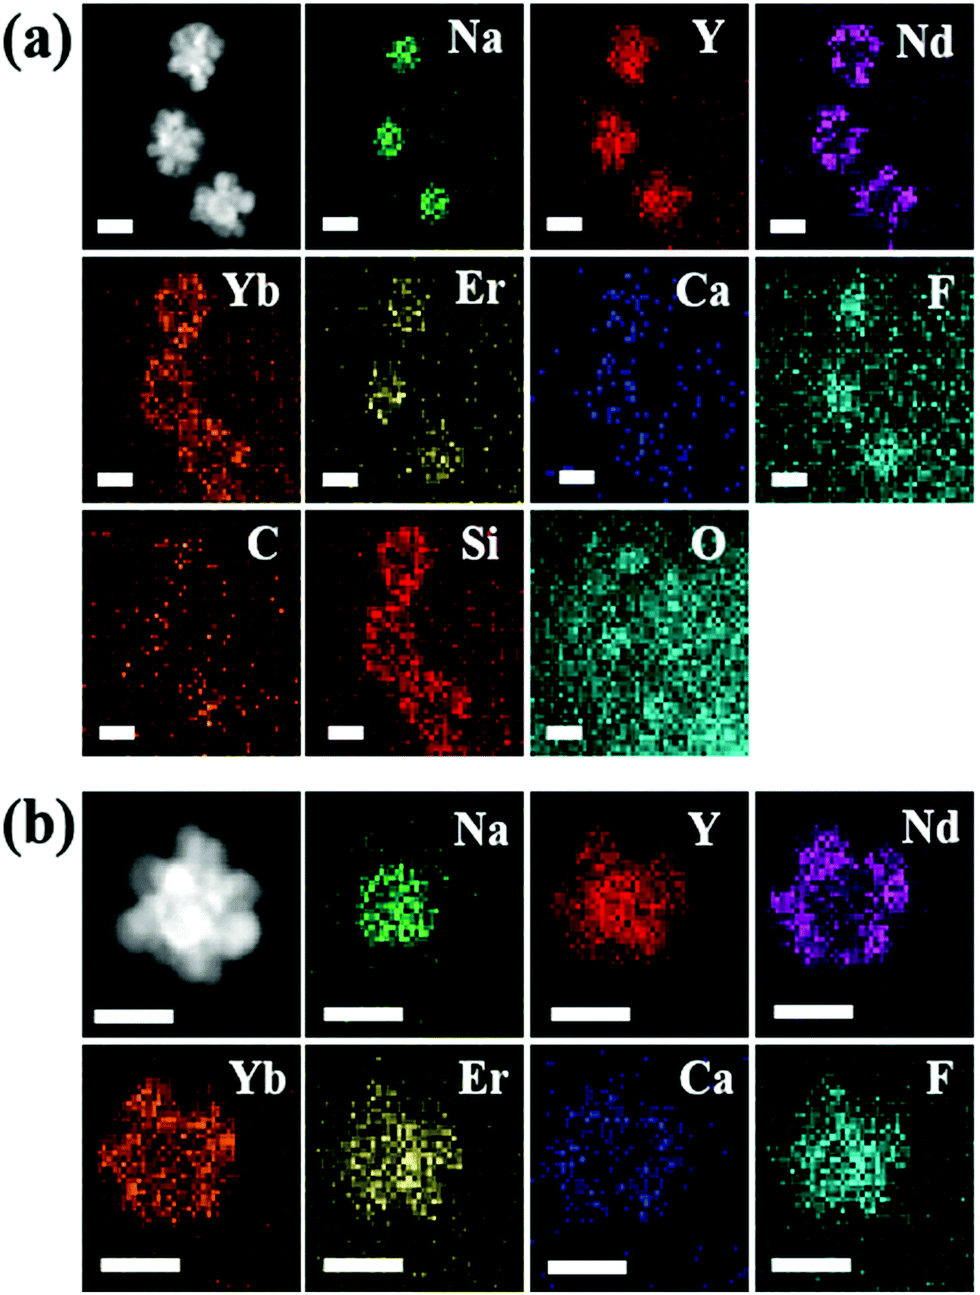 | ||
| Fig. 3 HAADF-STEM images and elemental mapping analysis of (a) UCND@SiO2–COOH and (b) UCNDs. The indicated scale bars in (a) and (b) are 50 nm. | ||
The elemental mapping analysis of UCND@SiO2–COOH shows the homogeneous distribution of Na, Y, Nd, Yb, Er, Ca, F, C, Si, and O (Fig. 3a). These elemental compositions were further proved by ICP-MS (Table S1†). The results display the presence of Nd in high content (nearly 82.29 ppm), which is important for enhancing the energy absorption during UCLE.19,21,31 The HAADF-STEM image of the UCNDs also revealed their dendritic structure but without the SiO2–COOH shell (Fig. 3b). The elemental mapping analysis of UCNDs exhibits the coherent distribution of Na, Y, Nd, Yb, Er, Ca, and F (Fig. 3b). The zeta potential of UCND@SiO2–COOH reveals its high surface negative charges (−50.1 mV), owing to the presence of the negatively charged SiO2–COOH on its surface.
Fig. 4a shows the XRD analysis of UCND@SiO2–COOH relative to UCNDs (Fig. 4a). Both materials show the diffraction patterns assigned to the typical facets of the NaNdF4 phase with predominate facets of {100}, {110}, and {311} (in line with JCPDS: 27-0756) (Fig. 4a), meanwhile UCND@SiO2–COOH shows an additional peak for SiO2 centred at 22°. Some additional diffraction patterns for NaYF4:Yb,Er,Ca were also detected in UCNDs and UCND@SiO2–COOH, which originated from the core–shell area, in agreement with the resolved peaks for core and core–shell UCNPs (Fig. S1†).14,32
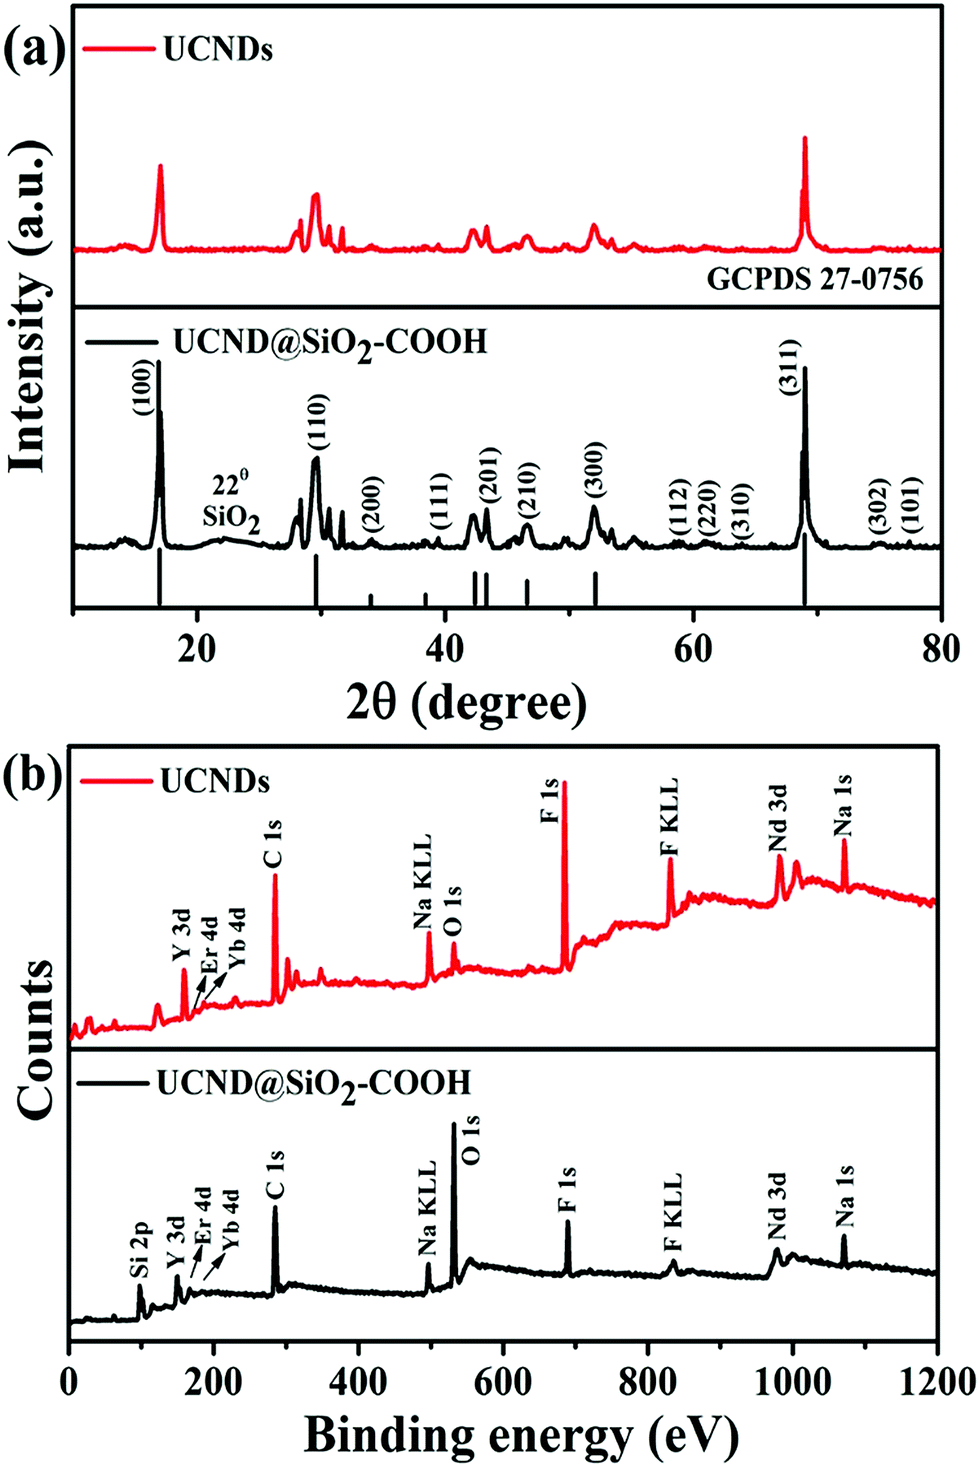 | ||
| Fig. 4 (a) XRD peaks and (b) XPS survey spectra of UCND@SiO2–COOH compared to UCNDs. The positions of the lines at the bottom in (a) were taken from JCPDS: 27-0756. | ||
There are no resolved metal oxide peaks, which implies the purity of the thus-obtained material. Additionally, the recorded XRD peaks of UCND@SiO2–COOH and UCNDs shifted slightly towards lower angles relative to the pure NaNdF4 peaks, which originate from the presence of Yb and Ca dopants that enrich the dendritic shell.
XPS was employed to investigate the electronic structure and the surface composition of UCNDs and UCND@SiO2–COOH (Fig. 4b). Both materials reveal the presence of Y 3d, Er 4d, Yb 4d, C 1s, Na KLL, O 1s, F 1s, F KLL, Nd 3d, and Na 1s peaks, while UCND@SiO2–COOH displays additional peaks for Si 2p at 98.8 eV and a substantial increment in the intensity of O 1s and C 1s peaks. The XPS peaks of UCND@SiO2–COOH were slightly shifted towards lower binding energies relative to UCNDs and/or pure NaNdF4 that emanated from the SiO2–COOH shell. The combination of Nd, Ca, Er, and Yb is essential for enhancement of the NIR absorption and maximizing the UCLE efficiency along with reducing the quenching of energy.33–35
The FTIR spectra of UCNDs exhibit the main stretching vibration bands attributed to methylene (CH2–) at 2920 and 2850 cm−1, C![[double bond, length as m-dash]](https://www.rsc.org/images/entities/char_e001.gif) O at 1712 cm−1, and carboxylic group (–COOH) at 1550 and 1460 cm−1, indicating that the UCNDs were coated by oleic acid (Fig. S2†).36,37 UCND@SiO2–COOH displays stretching vibration bands attributed to O–H at 1403–1562 cm−1, Si–O–Si at 1023 cm−1, and Si–O group at 720 cm−1 as well as a weak band for –OH at 3368 cm−1, demonstrating the successful SiO2–COOH coating.38–40
O at 1712 cm−1, and carboxylic group (–COOH) at 1550 and 1460 cm−1, indicating that the UCNDs were coated by oleic acid (Fig. S2†).36,37 UCND@SiO2–COOH displays stretching vibration bands attributed to O–H at 1403–1562 cm−1, Si–O–Si at 1023 cm−1, and Si–O group at 720 cm−1 as well as a weak band for –OH at 3368 cm−1, demonstrating the successful SiO2–COOH coating.38–40
To decipher the formation mechanism of UCNDs we carried out various reaction experiments. Three samples were collected and characterized by TEM at different reaction times after the addition of the precursors of the outer shell. After 10 min, small protrusions grew over the surface of truncated core–shell UCNPs (Fig. 5a) and then with time the length and number of branches increased (Fig. 5b). The growth of the nanodendrite shell was complete after 1 h, which indicates that Nd3+ is an indispensable key for the formation of a dendritic shell (Fig. 5c). This is further proved through changing the concentrations of NdCl3 and fixing all other reaction parameters and conditions. Non-uniform UCNDs with truncated-like NPs are obtained using NdCl3 0.5 mol L−1, 0.5 mL (Fig. 5d); slightly uniform UCNDs with less number of truncated-like NPs were formed using NdCl3 1 mol L−1, 0.5 mL (Fig. 5e). Uniform UCNDs with longer branches are formed using NdCl3 2 mol L−1, 0.5 mL (Fig. 5f). This reveals that a higher concentration of NdCl3 is essential for the production of uniform UCNDs without undesired NPs.
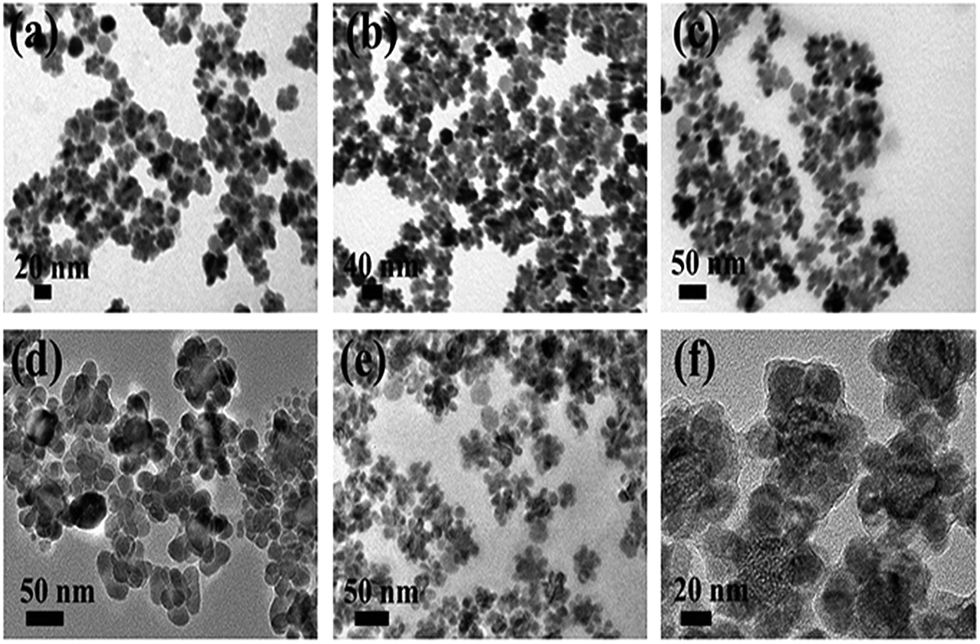 | ||
| Fig. 5 TEM images of UCNDs collected at different reaction times (a–c). UCNDs prepared using different concentrations of NdCl3 (d) 0.5 mol L−1, 0.5 mL, (e) 1 mol L−1, 0.5 mL, and (f) 2 mol L−1, 0.5 mL. | ||
Considering these results, the formation of UCNDs could be attributed to the homogeneous nucleation, followed by the epitaxial growth (Scheme 2). Particularly Na, Y, F, Yb, Er and Ca precursors with closer reduction kinetics are thermally decomposed with the assistance of OA and 1-octadecene to form a monodispersed UCNP core, which acts as the starting seed and provides various nucleation sites for supporting the growth of the first shell that grows in the form of a truncated shape (Scheme 2). Eventually, the core–shell UCNPs provide numerous nucleation sites for deposition and growth of the second shell. The second shell grows in the form of a three-dimensional nanodendritic morphology owing to the presence of Nd with a lower thermal conductivity relative to its counterparts Yb, Ca, and F. This plausibly led to a breakdown of the crystal structure of Nd resulting in the growth of three-dimensional branched structures instead of a zero-dimensional shape. Despite the great achievements in the fabrication of UCNPs with different morphologies, their synthesis with a three-dimensional core–double shell nanodendritic morphology has not yet been reported to the best of our knowledge. This is owing to the challenges related to the reduction of various metals with dissimilar reduction kinetics and thermal conductivities along with their dissimilar interactions with organic solvents and/or surfactants.
 | ||
| Scheme 2 The proposed production mechanism of the typically synthesized UCNDs. | ||
The UCLE of UCND@SiO2–COOH was benchmarked relative to UCNDs, UCNP core–shell, and UCNP core under 980 nm excitation. The observed total emission intensities of UCNDs and UCND@SiO2–COOH were significantly higher than that of the UCNP core and UCNP core–shell (Fig. 6a).
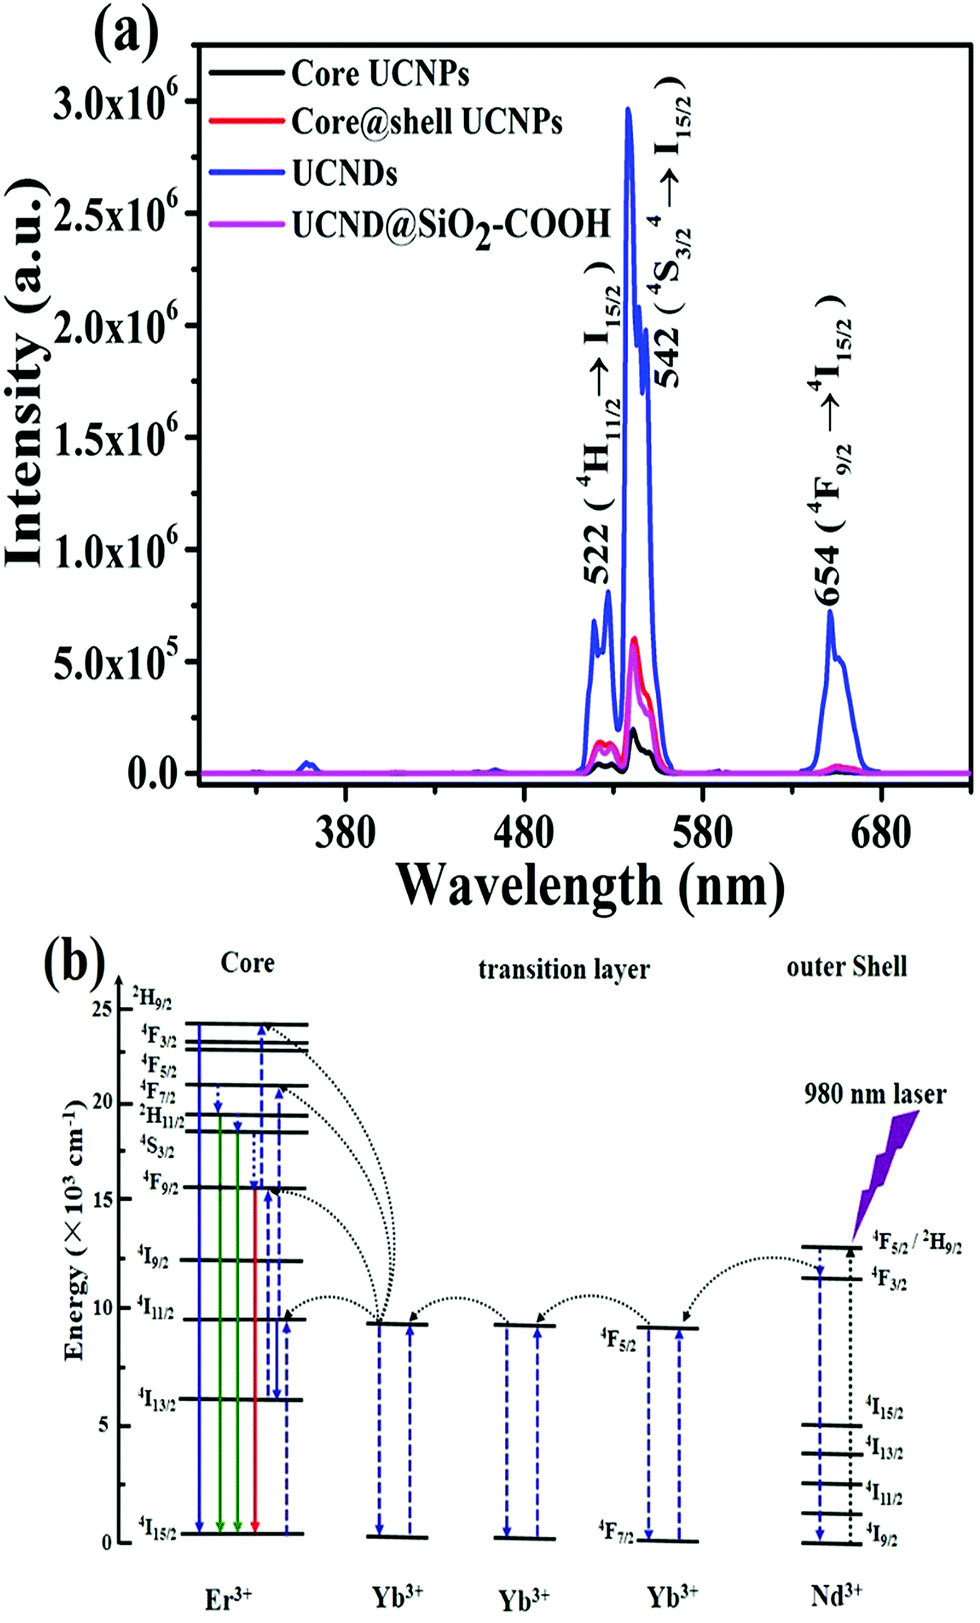 | ||
| Fig. 6 (a) The UCLE spectra of 6 mg mL−1 UCNP core, UCNP core–shell, UCNDs and UCND@SiO2–COOH. (b) Proposed energy-transfer mechanisms on UCNDs under 980 nm excitation. | ||
All materials exhibit three main visible emission bands centred at 522, 542, and 654 nm, ascribed to the radiative transitions from 4H11/2 → 4I15/2 (green), 4S3/2 → 4I15/2 (green), and 4F9/2 → 4I15/2 (red), respectively. The maximum emission intensity on all materials is observed at 542 nm, which is substantially higher than those at 522, and 654 nm (Fig. 6a).32,38,41 The UCLE intensities of UCNDs at 542 are 5 and 15 times higher than those of the UCNP core–shell and UCNP core, respectively. The ratios of green to red emissions of UCNDs and UCND@SiO2–COOH were also superior to those of the UCNP core and UCNP core–shell (Table S2†).
In addition, the maximum UCLE intensity of UCNDs is more than 3 times higher than that of standard NaYF4:Yb3+,Er3+@NaGdF4 UCNPs (Fig. S3†). This result implies the significant effect of UCNDs enriched with a high concentration of the Nd3+ sensitizer on the enhancement of UCLE, resulting from their ability to broaden the absorption cross-section. The decrease in the UCLE of UCND@SiO2–COOH relative to UCNDs is reasonable since the SiO2-layer scatters both incident NIR light and emissive visible light. This implies that less excitation light can reach the inner cores and less emission light can pass out as reported elsewhere.8,42–45 However, the maximum UCLE of UCND@SiO2–COOH silica is comparable with that of the hydrophobic UCNP core–shell in cyclohexane (Fig. 6a) and hydrophobic NaYF4:Yb3+,Er3+@NaGdF4 UCNPs in cyclohexane (Fig. S3†).
The severe quenching effect caused by energy back-transfer from the activators to 4IJ manifolds of Nd3+ is the grand challenge of using Nd3+ with a high concentration as a sensitizer in bioimaging applications. Herein, we overcame this challenge using UCNDs. In particular, Nd3+ in the outer dendritic shell acts as a sensitizer to harvest 980 nm photons which leads to population of the 4F5/2 state of Nd3+, whereas Yb3+ extracts the excitation energy from Nd3+via interionic cross-relaxation [(4F3/2)Nd, (2F7/2)Yb] → [(4I9/2)Nd, (2F5/2)Yb] (Fig. 6b). Following that, the excitation-energy moves over the Yb3+ sub-lattice and is eventually entrapped by activator ions (Er3+) confined in the inner core. Concurrently, the middle layer acts as a protective shield for precluding the quenching interaction between the activator Er3+ and sensitizer Nd3+, meanwhile Yb3+ in the middle layer ensures the efficient excitation energy transfer between Nd3+ and Er3+. Hence, UCNDs with a core–double shell structure can enhance the UCLE and prevent the undesired quenching effects originating from Nd3+ ions in the outer shell.18–20,32,46
To validate the feasilbility of using UCND@SiO2–COOH for biomedical applications, its in vitro cytotoxicity was investigated towards HeLa cells by the traditional MTT assay (Fig. S4†).47
The cell viability is over 96% even when using a high concentration of UCND@SiO2–COOH (200 μg mL−1), indicating the low cytotoxicity of UCND@SiO2–COOH (Fig. S4†). The interactions of UCND@SiO2–COOH with HeLa cells were also studied by fluorescence microscopy (Fig. 7a). The bright field images show that the HeLa cells display their typical fried egg shape with a random extension of their filopodia at the edges and high cell densities. This indicates that the morphology and proliferation of HeLa cells are not affected by UCND@SiO2–COOH. The UCLE intensities of HeLa cells increased by increasing the concentrations of UCND@SiO2–COOH (Fig. 7a) and incubation times (Fig. 7b). Fig. S5† shows the high-resolution confocal microscopy images of HeLa cells treated with UCND@SiO2–COOH and UCNP core–shell@SiO2–COOH to get more insights on their cellular uptake efficiencies and the intracellular location. There was no significant difference in the distributions of internalized UCND@SiO2–COOH and internalized UCNP core–shell@SiO2–COOH in cells, i.e., both UCND@SiO2–COOH and UCNP core–shell@SiO2–COOH are distributed outside the nucleus. Under 980 nm excitation, UCND@SiO2–COOH stained cells are much brighter than UCNP core–shell@SiO2–COOH stained cells. This indicates that UCND@SiO2–COOH can be used as an efficient probe for fluorescence bioimaging.
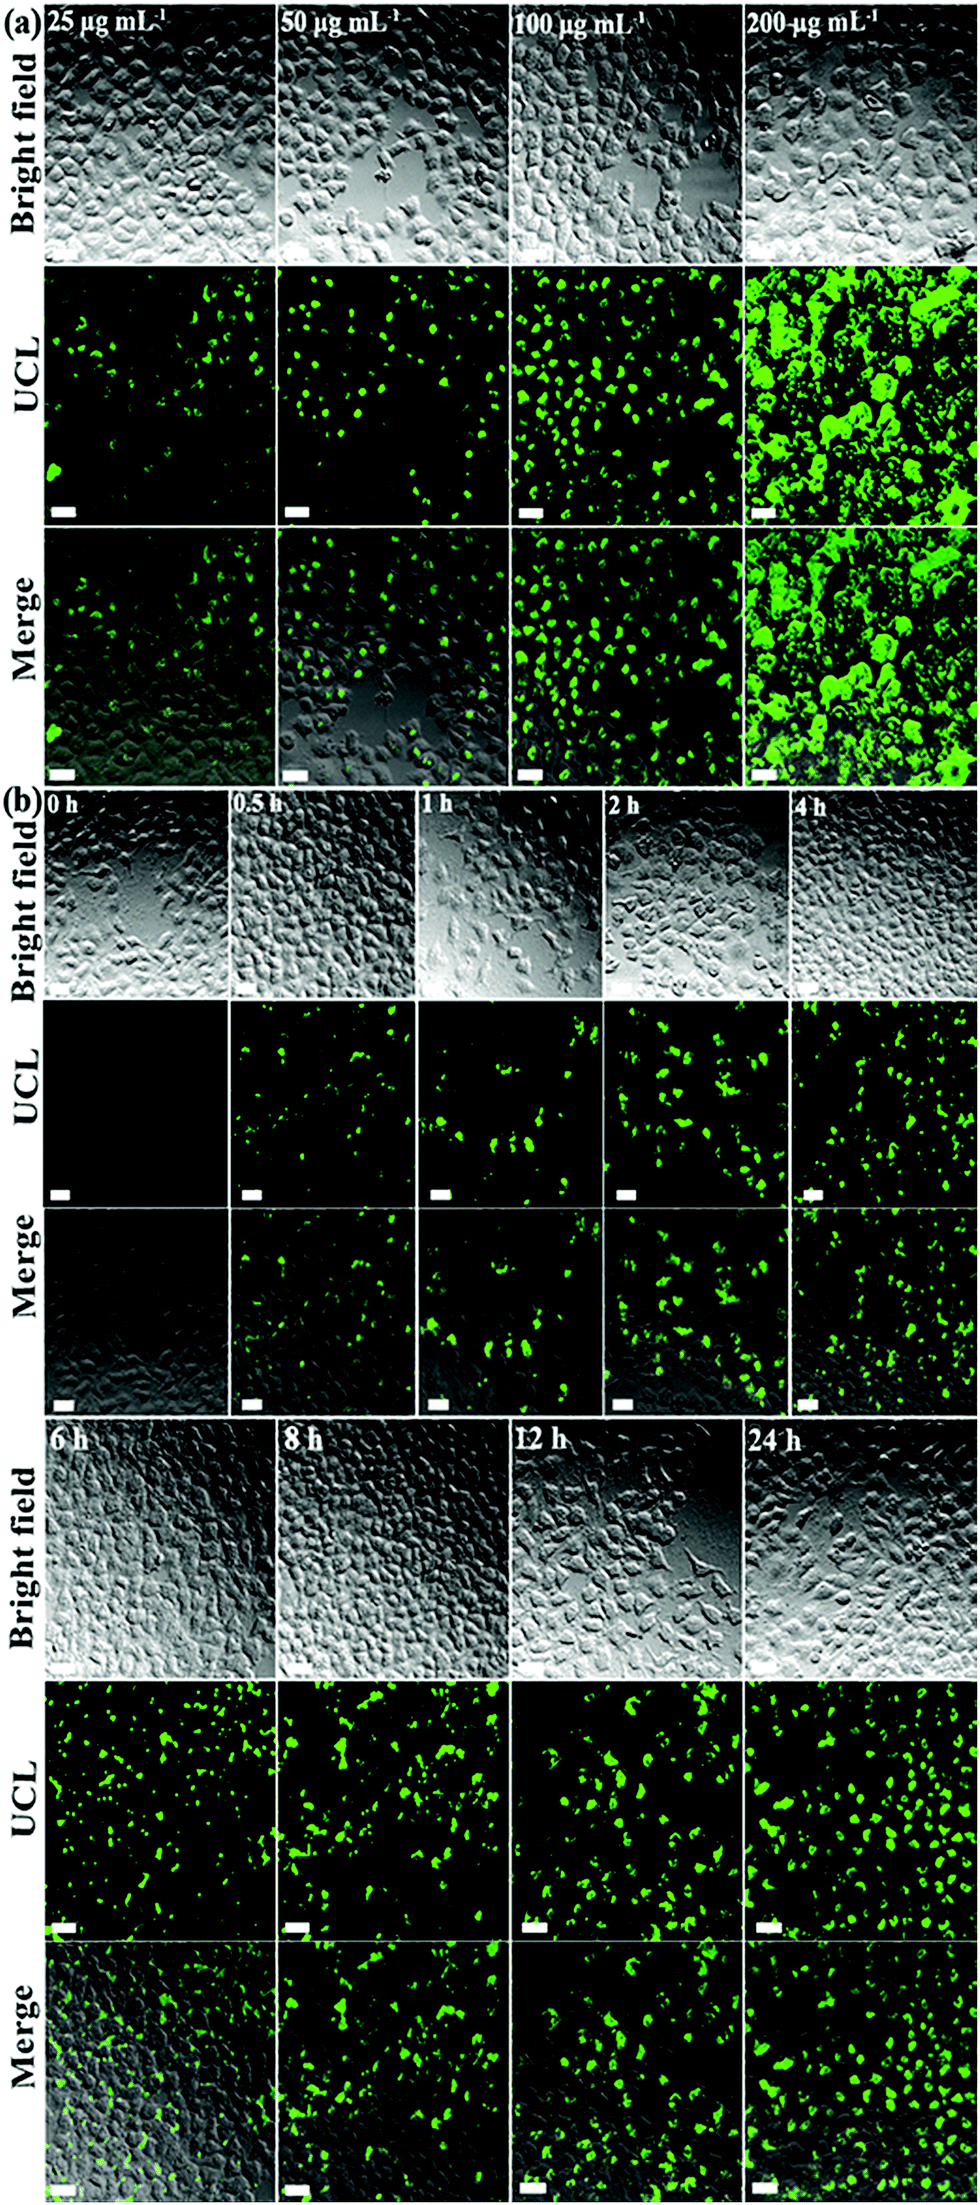 | ||
| Fig. 7 Fluorescence microscopic images of UCND@SiO2–COOH stained HeLa cells: bright field, upconversion-luminescence (UCL), and the merging of the two images for (a) cells incubated with 25, 50, 100 and 200 μg mL−1 of UCND@SiO2–COOH after 24 h and (b) with 100 μg mL−1 of UCND@SiO2–COOH over 24 h. Scale bars are 20 μm. | ||
For in vivo bioimaging 10 mg per kg bodyweight UCND@SiO2–COOH in 0.9 wt% NaCl solution was injected into mice through the tail vein. Intense green UCL signals were successfully emitted from the liver site at 0.5 h post-injection under 980 nm laser excitation (Fig. 8). Then, the maximum UCLE signal enhancement was achieved at 8 h, followed by a slight decrease at 24 h (Fig. S6†). These results reveal that the strong UCLE of UCND@SiO2–COOH could easily penetrate deep tissue, and have a great potential for in vivo optical imaging. For evaluating the biodistribution of UCND@SiO2–COOH, the mice were sacrificed at 8 h post-injection. The main organs including liver, lung, heart, kidney, and spleen were collected and imaged under 980 nm laser excitation.
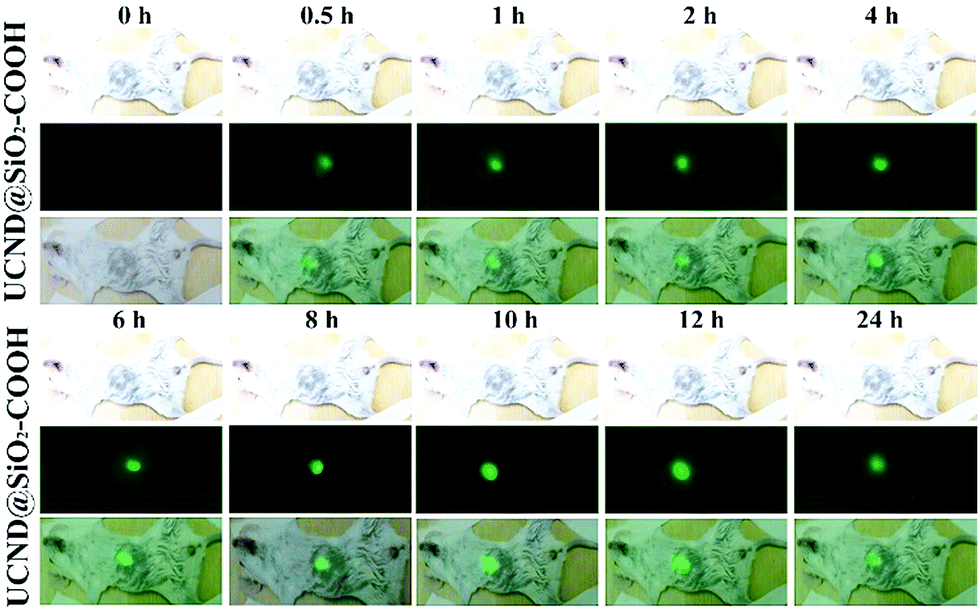 | ||
| Fig. 8 In vivo upconversion luminescence (UCL) imaging of the UCND@SiO2–COOH treated mice at different time points under 980 nm excitation. | ||
The UCL images of these organs display apparent green emission with different intensities (Fig. 9a). The UCL signal intensity of the liver and spleen are much higher than those of other organs. The distributions of UCND@SiO2–COOH in different organs were also quantitatively determined by inductively coupled plasma mass spectrometry (ICP-MS). The amounts of UCND@SiO2–COOH in the liver and spleen were significantly higher (ca., 6 times) than those in other organs (Fig. S7 and Tables S3 and S4†). This result demonstrates that UCND@SiO2–COOH is mainly accumulated in the liver and spleen. The phenomenon is concurrent with previous reports.48–50
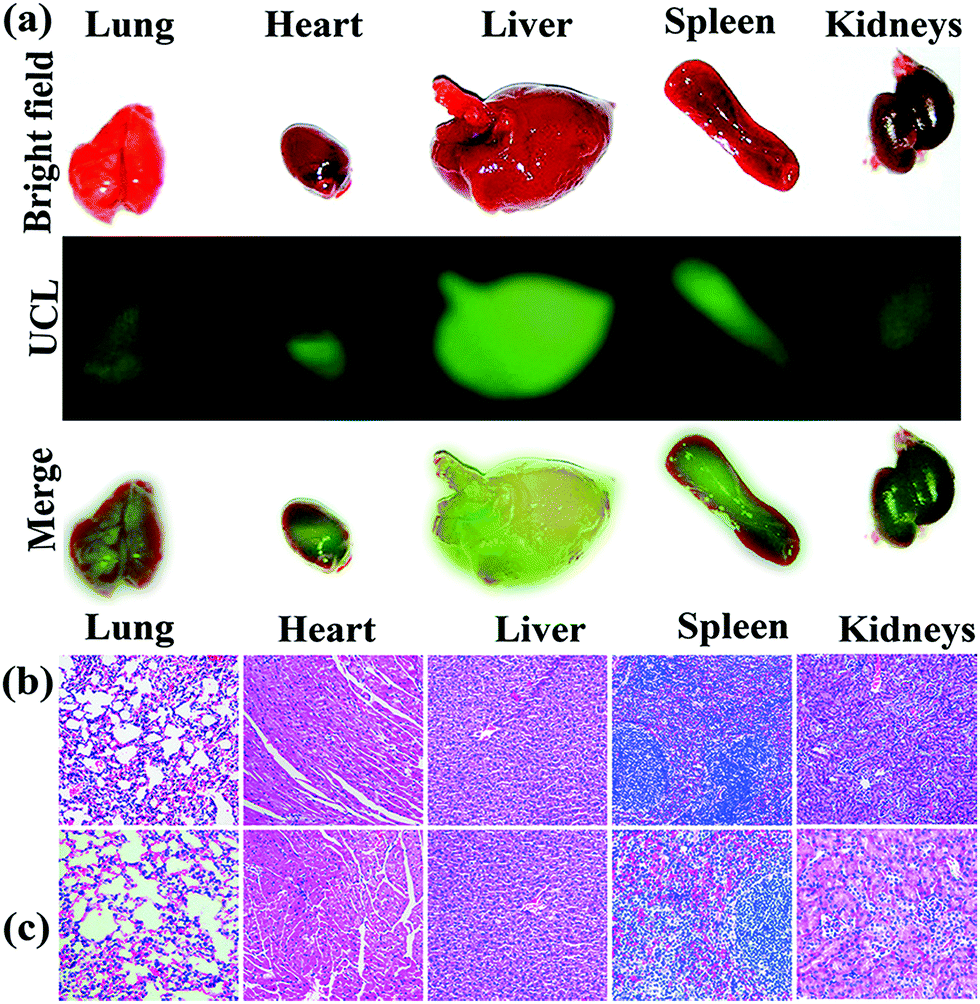 | ||
| Fig. 9 (a) Ex vivo UCL imaging of different organs collected from a BALB/c mouse injected with 10 mg per kg bodyweight of UCND@SiO2–COOH. Histological analysis of tissues collected from the organs of (b) an untreated mouse and (c) treated mouse. | ||
The long-term in vivo toxicity of UCND@SiO2–COOH was assessed by the histology analysis of the major organs, body weights of mice, and blood biochemical assays. On comparing with the control group, the histological analysis of the tissues of main organs (heart, liver, spleen, lung, and kidneys) at 30 days post-injection shows the absence of any destructive cell necrosis or inflammation lesions (Fig. 9b and c). The bodyweights of mice in the control group and UCND@SiO2–COOH treated group increased steadily as the time prolonged (Fig. S8†). For blood biochemical assays, there is negligible difference between the UCND@SiO2–COOH treated group and control group (Table S5†). The results confirm the excellent biocompatibility of UCND@SiO2–COOH.
Conclusion
In summary, we rationally designed a three-dimensional UCND core–double shell with multiple branched arms. Nd3+ in high content enriches the outer shell and enhances the absorption energy, while the middle layer acts as a protective shield for preventing the quenching interaction between Er3+ and Nd3+. Meanwhile, Yb3+ in the middle layer ensures the efficient excitation energy transfer between Nd3+ and Er3+. These unique structural and compositional merits enhance the UCLE of UCNDs by 5 and 15 times compared to core–shell UCNPs and core UCNPs, respectively at 980 nm. The carboxy-terminated silica shell coated UCNDs (UCND@SiO2–COOH) were utilized successfully as luminescent probes for in vitro and in vivo bioimaging without any significant toxicity. This study may open the way for the tailored synthesis of efficient and safe luminescent markers for bioimaging applications.Experimental
Synthesis of UCNDs
The UCNP core was initially synthesized by our previous method with slight modifications.51 Generally, YCl3 (1.6 mol L−1, 0.5 mL), YbCl3 (0.6 mol L−1, 0.3 mL) Ca(CH3COOH)2 (0.1 mol L−1, 0.1 mL) and ErCl3 (0.1 mol L−1, 0.1 mL) aqueous solutions were mixed well in a 100 mL flask, and dried by heating. Then, oleic acid (15 mL) and 1-octadecene (16 mL) were added into the flask. The mixture was heated to 150 °C in an Ar atmosphere to yield a homogeneous solution. After cooling to 50 °C, a methanol solution (10 mL) containing NH4F (4 mmol) and NaOH (2.5 mmol) was then added into the solution and reacted for 30 min. The methanol was evaporated, and the solution was degassed for 10 min. Subsequently, the temperature of the mixture was increased to 300 °C at a rate of 10 °C min−1 and incubated at 300 °C for 90 min. After cooling to room temperature under ambient conditions, the as-prepared UCNPs (named as NaYF4:Yb,Er,Ca UCNPs) were collected by centrifugation (10![[thin space (1/6-em)]](https://www.rsc.org/images/entities/char_2009.gif) 000 rpm for 10 min) and washed with ethanol (10 mL, three times). Finally, the NaYF4:Yb,Er,Ca UCNPs were redispersed in cyclohexane (10 mL) for further experiments.
000 rpm for 10 min) and washed with ethanol (10 mL, three times). Finally, the NaYF4:Yb,Er,Ca UCNPs were redispersed in cyclohexane (10 mL) for further experiments.
For the synthesis of core–shell UCNPs, YCl3 (1.6 mol L−1, 0.5 mL), YbCl3 (0.6 mol L−1, 0.3 mL) and Ca(CH3COOH)2 (0.1 mol L−1, 0.1 mL) were added in a 100 mL flask, and dried by heating. The mixture was heated to 150 °C in an Ar atmosphere to yield a homogeneous solution. After cooling to 80 °C, NaYF4:Yb,Er,Ca UCNPs (1 mmol) in cyclohexane (10 mL) were added to the above mixture. After removal of cyclohexane by evaporation, a methanol solution (10 mL) containing NH4F (4 mmol) and NaOH (2.5 mmol) was added and stirred at 50 °C for 30 min. The methanol was evaporated off, and the solution was degassed for 10 min. Subsequently, the temperature of the mixture was increased to 300 °C at a rate of 10 °C min−1 and incubated at 300 °C for 90 min. The following procedures for the NaYF4:Yb,Er,Ca@NaYF4:Yb,Ca UCNPs were the same as those for the core nanoparticles.
For the synthesis of NaYF4:Yb,Er,Ca@NaYF4:Yb,Ca@NaNdF4:Yb,Ca UCNDs, the procedure for NaNdF4:Yb,Ca outer shell growth was the same as that for NaYF4:Yb,Ca UCNPs, except that NdCl3 (1.6 mol L−1, 0.5 mL) was used. The as-prepared UCNDs were also redispersed in cyclohexane for further experiments. The synthesis details of SiO2–COOH layer coated UCNDs (UCND@SiO2–COOH) and the biological studies of UCND@SiO2–COOH are shown in the ESI.†
Materials characterization
The morphology and composition of the as-made materials were investigated using a transmission electron microscope (TEM, Tecnai G220, FEI, Hillsboro, OR, USA), equipped with an energy dispersive spectrometer (EDS) and high-angle annular dark-field scanning transmission electron microscope (HAADF-STEM). X-ray photoelectron spectroscopy (XPS) was performed on a VG ESCALAB MKII (VG XPS Scientific Ltd, UK). The powder X-ray diffraction analysis (XRD) was carried out on a D8 ADVANCE diffractometer (Bruker Co., Germany) using Cu Kα X-ray source (λ = 0.15406 nm) radiation. Fourier transform infrared (FTIR) spectra were recorded using a Bruker Vertex 70 (Bruker Co., Germany). Upconversion luminescence (UCL) spectra were recorded with a 980 nm laser from an optical parametric oscillator (OPO) (Continuum Sunlite) as the excitation source. The UCL imaging of the cells was performed with a reconstructive Ti–S fluorescence microscope (Nikon Co., Tokyo, Japan) equipped with a continuous wave (CW) NIR laser at 980 nm. All dynamic light scattering (DLS) and zeta potential distribution measurements were carried out on a Zetasizer Nano ZS (Malvern Instruments Ltd, UK). The elemental analysis was performed by inductively coupled plasma mass spectrometry (ICP-MS, ICAP 6000, Thermo Scientific, USA). The in vivo UCL imaging and UCL imaging of tissues were recorded using an M2590 (Genie™ Nano Cameras, Teledyne DALSA, Waterloo, Canada) with a 700 nm short pass filter (SP675, FWHM 150 nm, Gengxu Photonics, Shenzhen, China). All UCL images were analysed quantitatively using Image-Pro Plus 6.0 and Image J software. The cellular uptake and the intracellular location were investigated by high-resolution confocal laser scanning microscopy (Nikon Co., Tokyo, Japan) with a continuous laser excitation at 980 nm.In vivo experiments
Balb/c mice (six weeks old, 20 ± 0.2 g, male) were purchased from Beijing HFK Biotechnology Ltd (Beijing, China). All animal procedures were performed in accordance with the Regulations for the Administration of Affairs Concerning Experimental Animals of the People's Republic of China and approved by the Animal Ethics Committee of Jilin University. The mice had free access to food and water and were raised on a 12 h light/12 h dark cycle at 20 °C. The details of in vivo UCL imaging and in vivo toxicology analysis are shown in the ESI.†Conflicts of interest
There are no conflicts to declare.Acknowledgements
This work was financially supported by the CAS-TWAS president's fellowship award for Ph.D. Students (series No. 2017-166). We also acknowledge the financial support from the National Natural Science Foundation of China (grant no. 21775145).Notes and references
- G. Chen, H. Qiu, P. N. Prasad and X. Chen, Chem. Rev., 2014, 114, 5161–5214 CrossRef CAS PubMed.
- C. Duan, L. Liang, L. Li, R. Zhang and Z. P. Xu, J. Mater. Chem. B, 2018, 6, 192–209 RSC.
- W. Feng, X. Zhu and F. Li, NPG Asia Mater., 2013, 5, e75 CrossRef CAS.
- X. Huang and X. Liu, ChemPhysChem, 2012, 13, 4095–4097 CrossRef CAS PubMed.
- T. Sun, F. Ai, G. Zhu and F. Wang, Chem.–Asian J., 2018, 13, 373–385 CrossRef CAS PubMed.
- K. Du, X. Xu, S. Yao, P. Lei, L. Dong, M. Zhang, H. Zhang and H. Zhang, CrystEngComm, 2018, 20, 1945 RSC.
- S. Dong, J. Xu, T. Jia, M. Xu, C. Zhong, G.-X. Yang, J. Li, D. Yang, F. He, S. Gai, P. Yang and J. Lin, Chem. Sci., 2019, 10, 4259–4271 RSC.
- Y. Liu, Q. Jia, X. Zhai, F. Mao, A. Jiang and J. Zhou, Chem. Sci., 2019, 10, 1193–1200 RSC.
- N. Nishimura, J. R. Allardice, J. Xiao, Q. Gu, V. Gray and A. Rao, Chem. Sci., 2019, 10, 4750–4760 RSC.
- B. L. Ma, X. Zhai, G. Du and J. Zhou, Chem. Sci., 2019, 10, 3281–3288 RSC.
- J. Zhou, Z. Liu and F. Li, Chem. Soc. Rev., 2012, 41, 1323–1349 RSC.
- H. Dong, S.-R. Du, X.-Y. Zheng, G.-M. Lyu, L.-D. Sun, L.-D. Li, P.-Z. Zhang, C. Zhang and C.-H. Yan, Chem. Rev., 2015, 115, 10725–10815 CrossRef CAS PubMed.
- Z. Li and Y. Zhang, Nanotechnology, 2008, 19, 345606 CrossRef PubMed.
- X. Ye, J. E. Collins, Y. Kang, J. Chen, D. T. Chen, A. G. Yodh and C. B. Murray, Proc. Natl. Acad. Sci. U. S. A., 2010, 107, 22430–22435 CrossRef CAS PubMed.
- X. Bai, H. Song, G. Pan, Y. Lei, T. Wang, X. Ren, S. Lu, B. Dong, Q. Dai and L. Fan, J. Phys. Chem. C, 2007, 111, 13611–13617 CrossRef CAS.
- S. A. Maier, P. G. Kik, H. A. Atwater, S. Meltzer, E. Harel, B. E. Koel and A. A. Requicha, Nat. Mater., 2003, 2, 229 CrossRef CAS PubMed.
- H.-S. Qian and Y. Zhang, Langmuir, 2008, 24, 12123–12125 CrossRef CAS PubMed.
- X. Xie, Z. Li, Y. Zhang, S. Guo, A. I. Pendharkar, M. Lu, L. Huang, W. Huang and G. Han, Small, 2017, 13, 1602843 CrossRef PubMed.
- Y. Zhong, G. Tian, Z. Gu, Y. Yang, L. Gu, Y. Zhao, Y. Ma and J. Yao, Adv. Mater., 2014, 26, 2831–2837 CrossRef CAS PubMed.
- Y. Zhang, Z. Yu, J. Li, Y. Ao, J. Xue, Z. Zeng, X. Yang and T. T. Y. Tan, ACS Nano, 2017, 11, 2846–2857 CrossRef CAS PubMed.
- X. Xie, N. Gao, R. Deng, Q. Sun, Q.-H. Xu and X. Liu, J. Am. Chem. Soc., 2013, 135, 12608–12611 CrossRef CAS PubMed.
- Q. Zhan, J. Qian, H. Liang, G. Somesfalean, D. Wang, S. He, Z. Zhang and S. Andersson-Engels, ACS Nano, 2011, 5, 3744–3757 CrossRef CAS PubMed.
- L. Yuan, W. Lin, K. Zheng, L. He and W. Huang, Chem. Soc. Rev., 2013, 42, 622–661 RSC.
- X. Zhao, H. Suo, Z. Zhang, L. Zhang and C. Guo, Dyes Pigm., 2017, 146, 119–126 CrossRef CAS.
- A. Li, J.-L. Wu, X.-S. Xu, Y. Liu, Y.-N. Bao and B. Dong, Chin. Phys. B, 2018, 27, 097301 CrossRef.
- S. Wu, X. Sun, Z. Meng and S. Zhang, CrystEngComm, 2017, 19, 3600–3606 RSC.
- S. Wu, Z. Meng, X. Sun and S. Zhang, CrystEngComm, 2017, 19, 5022–5027 RSC.
- R. Tian, H. Zhang, H. Chen, G. Liu and Z. Wang, Adv. Sci., 2018, 1800214 CrossRef PubMed.
- S. Han, R. Deng, X. Xie and X. Liu, Angew. Chem., Int. Ed., 2014, 53, 11702–11715 CrossRef CAS PubMed.
- Y.-F. Wang, G.-Y. Liu, L.-D. Sun, J.-W. Xiao, J.-C. Zhou and C.-H. Yan, ACS Nano, 2013, 7, 7200–7206 CrossRef CAS PubMed.
- B. Liu, Y. Chen, C. Li, F. He, Z. Hou, S. Huang, H. Zhu, X. Chen and J. Lin, Adv. Funct. Mater., 2015, 25, 4717–4729 CrossRef CAS.
- F. Lu, L. Yang, Y. Ding and J. J. Zhu, Adv. Funct. Mater., 2016, 26, 4778–4785 CrossRef CAS.
- B. Del Rosal, A. Pérez-Delgado, M. Misiak, A. Bednarkiewicz, A. S. Vanetsev, Y. Orlovskii, D. J. Jovanović, M. D. Dramićanin, U. Rocha and K. Upendra Kumar, J. Appl. Phys., 2015, 118, 143104 CrossRef.
- W. Xu, H. Song, X. Chen, H. Wang, S. Cui, D. Zhou, P. Zhou and S. Xu, Chem. Commun., 2015, 51, 1502–1505 RSC.
- J. Shen, G. Chen, A. M. Vu, W. Fan, O. S. Bilsel, C. C. Chang and G. Han, Adv. Opt. Mater., 2013, 1, 644–650 CrossRef.
- Z. Quan, D. Yang, P. Yang, X. Zhang, H. Lian, X. Liu and J. Lin, Inorg. Chem., 2008, 47, 9509–9517 CrossRef CAS PubMed.
- L. Wang and Y. Li, Nano Lett., 2006, 6, 1645–1649 CrossRef CAS PubMed.
- B. Liu, C. Li, D. Yang, Z. Hou, P. a. Ma, Z. Cheng, H. Lian, S. Huang and J. Lin, Eur. J. Inorg. Chem., 2014, 2014, 1906–1913 CrossRef CAS.
- S. K. Mah and I. J. Chung, J. Non-Cryst. Solids, 1995, 183, 252–259 CrossRef CAS.
- J. Lin, M. Yu, C. Lin and X. Liu, J. Phys. Chem. C, 2007, 111, 5835–5845 CrossRef CAS.
- Z. Li, Y. Zhang, B. Shuter and N. Muhammad Idris, Langmuir, 2009, 25, 12015–12018 CrossRef CAS PubMed.
- J. Shan and Y. Ju, Appl. Phys. Lett., 2007, 91, 123103 CrossRef.
- Z. Li, Y. Zhang and S. Jiang, Adv. Mater., 2008, 20, 4765–4769 CrossRef CAS.
- D. Chen, L. Lei, A. Yang, Z. Wang and Y. Wang, Chem. Commun., 2012, 48, 5898–5900 RSC.
- T. Soukka, T. Rantanen and K. Kuningas, Ann. N. Y. Acad. Sci., 2008, 1130, 188–200 CrossRef CAS PubMed.
- L. Liang, X. Qin, K. Zheng and X. Liu, Acc. Chem. Res., 2018, 52, 228–236 CrossRef PubMed.
- R. Rahbari, T. Sheahan, V. Modes, P. Collier, C. Macfarlane and R. M. Badge, BioTechniques, 2009, 46, 277–284 CrossRef CAS PubMed.
- X. Ge, L. Sun, B. Ma, D. Jin, L. Dong, L. Shi, N. Li, H. Chen and W. Huang, Nanoscale, 2015, 7, 13877–13887 RSC.
- Q. Li, Z. Wang, Y. Chen and G. Zhang, Metallomics, 2017, 9, 1150–1156 RSC.
- K. M. Tsoi, S. A. MacParland, X.-Z. Ma, V. N. Spetzler, J. Echeverri, B. Ouyang, S. M. Fadel, E. A. Sykes, N. Goldaracena and J. M. Kaths, Nat. Mater., 2016, 15, 1212 CrossRef CAS PubMed.
- F. Liu, X. He, L. Liu, H. You, H. Zhang and Z. Wang, Biomaterials, 2013, 34, 5218–5225 CrossRef CAS PubMed.
Footnote |
| † Electronic supplementary information (ESI) available. See DOI: 10.1039/c9sc01586h |
| This journal is © The Royal Society of Chemistry 2019 |