 Open Access Article
Creative Commons Attribution 3.0 Unported Licence
Boosting the circularly polarized luminescence of small organic molecules via multi-dimensional morphology control†
Kai
Ma
ab,
Wenjie
Chen
bcd,
Tifeng
Jiao
 *a,
Xue
Jin
b,
Yutao
Sang
 bd,
Dong
Yang
b,
Jin
Zhou
b,
Minghua
Liu
 *bcd and
Pengfei
Duan
 *bd
*bd
aState Key Laboratory of Metastable Materials Science and Technology, Yanshan University, Qinhuangdao 066004, P. R. China. E-mail: tfjiao@ysu.edu.cn
bCAS Center for Excellence in Nanoscience, CAS Key Laboratory of Nanosystem and Hierarchical Fabrication, National Center for Nanoscience and Technology (NCNST), No. 11 ZhongGuanCun BeiYiTiao, Beijing 100190, P. R. China. E-mail: duanpf@nanoctr.cn; liumh@iccas.ac.cn
cBeijing National Laboratory for Molecular Science, CAS Key Laboratory of Colloid Interface and Chemical Thermodynamics, Institute of Chemistry, Chinese Academy of Sciences, No. 2 ZhongGuanCun BeiYiJie, Beijing 100190, P. R. China
dUniversity of Chinese Academy of Sciences, Beijing 100049, P. R. China
First published on 4th June 2019
Abstract
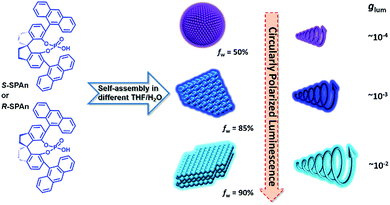
Achieving a higher dissymmetry factor is a crucial issue in developing circularly polarized luminescence (CPL) materials. Here, by tailoring the solvent composition and the morphology of the same chiral emissive small molecules (R- or S-SPAn), circularly polarized emission with a boosted dissymmetry factor (two orders) was realized. It was found that by regulating the water fraction in the mixed THF/H2O, we were able to achieve kinetic control over association of chiral emissive R- or S-SPAn into various nanostructures with 0D nanospheres, 2D nanoflakes and 3D stacked nanoflakes. These nanostructures are all CPL active. Remarkably, the dissymmetry factors of the nanostructures were significantly enhanced compared to those of the molecules and further boosted in different morphologies, from ∼10−4 (0D nanospheres) to 10−3 (2D flake) to ∼10−2 (3D nanoflakes). The enlarged glum value could be assigned to a good packing induced strong luminescence of an excimer. This strategy provides an efficient way to fabricate higher dissymmetry factor CPL organic nanomaterials by only changing the supramolecular architectures while using the same chiral small molecules.
Introduction
Chirality is a basic characteristic of nature which can be incisively and vividly exemplified by molecular, macromolecular or supramolecular levels of bioorganic systems, such as amino acids, enzymes, proteins, sugars, RNA and DNA.1–8 In recent years, excited state chirality, namely circularly polarized luminescence (CPL), has aroused much attention due to its potential for application in many fields.9–20 CPL originates from giving priority to one handed circularly polarized emission and the level of polarization is usually characterized by the luminescence dissymmetry factor (glum). The value of glum ranges from −2 to +2 and the maximum value of |glum| represents completely left or right-handed circularly polarized light.21–23 To broaden the application of CPL-active materials, it is necessary to pursue large glum of chiral luminescent systems. To date, the largest glum value with about 1.3 was obtained in lanthanide complexes, that is cesium tetrakis(3-heptafluoro-butylryl-(+)-camphorato) Eu(III) complexes.24 On the other hand, in contrast to lanthanide complexes, research on simple organic molecules with CPL activity has become popular due to the inherent advantages of organic luminescent molecules.25,26 Compared with lanthanide complexes, the emission of pure organic CPL-active materials could be tuned more flexibly by regulating the electronic levels of the excited state. For instance, many strategies have been realized to modulate the electronic state of organic molecules, such as by chemical transformations of substituents, self-assembly and by changing the environment through external stimuli, e.g. temperature, pH, concentration, light, magnetism and solvents.27–38 Unfortunately, the glum value of organic systems is relatively low and generally falls in the range of 10−5 to 10−3, which precludes them from being the best candidates for CPL research. To amplify the luminescence dissymmetry factors, different approaches have been adopted, which include the formation of receptor–ion complexes, configurational changes upon binding with guest ions or molecules and self-assembly of chiral molecules.39–46 For example, Tang and co-workers, by introducing the concept of aggregation-induced emission, realized the amplification of glum, which could be regarded as an excellent approach for fabricating efficient CPL-active organic solid materials.25,47,48 Very recently, we have demonstrated that energy transfer, including Förster resonance energy transfer and the photon upconversion process, could remarkably amplify the glum value.49–51 Kawai and co-workers have found that self-assembly could be used as an approach for amplifying the glum value.52 In addition, they have demonstrated that one-dimensional self-assembled nanostructures exhibited larger glum values than zero-dimensional aggregates. However, detailed demonstrations of morphology-dependent circularly polarized emission with regulated large glum values in pure organic molecule-based systems have rarely been reported.Herein, we report an interesting CPL-active organic system, which shows morphologically dependent CPL activity with controllable glum values, as shown in Scheme 1. This category of molecules was originally synthesized as a privilege catalyst for asymmetric reactions.53,54 Different morphological features of the nanostructures from the same chiral small molecule could be flexibly tuned by changing the mixing ratio of THF and water. Upon increasing the volume fraction of water, the nanostructures changed from 0D nanospheres to 2D and 3D nanoflakes. By trapping the chiral molecule association into different supramolecular architectures, the glum value of the specific nanostructures showed a remarkable amplification from 10−4 to 10−2. Particularly, compared with the monomeric state of the chiral emissive molecule, the glum value showed an amplification factor of two orders of magnitude. Thus, avoiding tedious organic synthesis, by simply regulating the composition of solvents, there still is great potential for enhancing the CPL activity.
Results and discussion
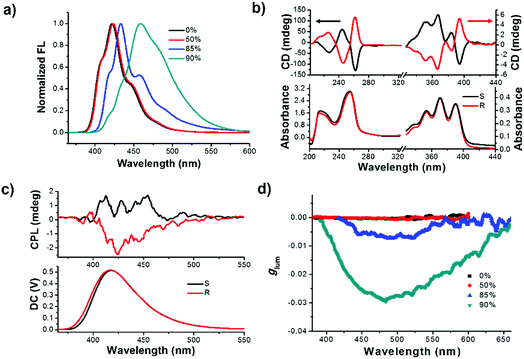
Initially, the primary photophysical investigations of monomeric and aggregated R- or S-SPAn were carried out by employing a series of optical testing methods. As shown in Fig. S1a,† upon increasing the volume fraction of water, the emission colour varied from deep blue to cyan under a UV lamp. The emission spectra also showed an obvious red shift. The maximum emission peak of R-SPAn in pure THF solution was located at 422 nm, which was identical to the one in the aggregate state in the mixed solvent (THF/H2O = 1/1) (Fig. 1a). Upon increasing the volume fraction of water (fw) to 85%, the emission spectrum showed a bathochromic shift to 432 nm with the emergence of a shoulder peak at 460 nm. When the water fraction reached 90%, the vibronic peaks tended to disappear and the maximum emission peak was located at 460 nm. Interestingly, the emission quantum yield (Φem) showed an increasing trend from 0.44 (pure THF solution) to 0.6 (fw 50%). However, after increasing the water fraction to 85%, the emission dramatically quenched (Φem = 0.04), which should be due to the aggregation-caused quenching of luminescence. Finally, upon increasing the water fraction to 90%, the quantum yield reached 0.13 (Fig. S1b and S2a†). As shown in Fig. S2b,† upon addition of water, the absorption spectra of R-SPAn showed a slight bathochromic shift and broadening, which indicated the formation of aggregates. The nature of different emitters of aggregates was investigated by emission lifetime measurement (Table S1†). The emission lifetime for fw 0% and 50% exhibited a monoexponential decay with a lifetime of 8 ns for emission monitored at 422 nm, which could be attributed to the luminescence of monomeric molecules. Upon increasing the water fraction to 85%, the aggregates exhibited a fast biexponential decay and triple-exponential decay lifetime monitored at 432 nm and 460 nm, respectively. The emergence of new emissive species with a lifetime of about 2.3 ns and a longer lifetime of about 6.8 ns may be attributed to the luminescence of the aggregates and excimer, respectively. The lifetime for fw 90% monitored at 460 nm exhibited a triple-exponential decay and the emergence of a long-lived lifetime of about 10 ns could further confirm the formation of an excimer.55–57 It could be concluded that the formation of the aggregates and excimer was responsible for the characteristic spectral features observed at higher water fractions.58To test the chirality of the monomeric and self-assembled states, circular dichroism (CD) and CPL measurements were carried out under different conditions. In pure THF solution, the CD spectra of the monomeric molecule showed an obvious Cotton effect corresponding to the absorption bands (Fig. 1b). The CD signals from 200 to 300 nm could be assigned to the electronic transitions of the spiral chromophore with axial chirality,59 while the signals in the range of 350–400 nm were assigned to the anthracene units, respectively. Mirror-image CD spectra were observed for the R and S-enantiomers. Since the anthracene chromophores were achiral, the CD signals located at 350 nm to 400 nm could be assigned to the intramolecular chirality transfer from spiral chromophore to anthracene. The CD spectra of R- or S-SPAn under various conditions are shown in Fig. S3.† The CD intensity corresponding to the anthracene chromophore exhibited amplification accompanying the increasing water fraction. We used the absorption dissymmetry factor (gCD) to evaluate the change of chirality. The absorption of an asymmetric factor (gCD) is defined as gCD = Δε/ε = 2(εL − εR)/(εL + εR), where εL and εR denote molar absorption coefficients of left and right circularly polarized light, respectively. The gCD of the anthracene was amplified from 1.5 × 10⁻⁴ (390 nm) to 3.1 × 10⁻³ (412 nm) (Fig. S4†). These results indicated that the stronger exciton coupling in well-ordered structures could significantly amplify the gCD by controlling the solvents. Thus, by controlling the morphology of nanostructures aggregated at various water fractions, amplified supramolecular chirality was obtained. The amplified gCD laid the foundation for enhanced CPL as discussed below. The CPL spectra could provide more direct evidence for chiral dissymmetry in the fluorescence of the monomer and aggregates (Fig. 1c and S5†). Upon increasing the volume fraction of water, the intensity of the CPL was obviously enhanced. The extent of chiral dissymmetry in fluorescence is quantified using the anisotropy factor, glum, of CPL, which is given by the equation glum = 2(IL − IR)/(IL + IR), where IL and IR are the intensities of the left- and right-handed circularly polarized emissions, respectively.60,61 As shown in Fig. 1d, in pure THF solution and fw 50%, the glum values were about 2.1 × 10⁻⁴ and 2.4 × 10⁻⁴, respectively. Upon increasing the volume fraction of water, the glum value increased by an order of magnitude. The maximum glum values for fw 85% and 90% were 7.2 × 10⁻³ and 2.9 × 10⁻², respectively. The obtained glum value for fw 90% in the pure organic systems was a relatively high value. The glum values of S-SPAn aggregated at various water fractions are shown in Fig. S6.† The order of magnitude of glum values of S-SPAn nanostructures at different water fractions was the same as that of R-SPAn. The obvious amplified glum values may have resulted from the strong intermolecular coupling in the nanostructures.
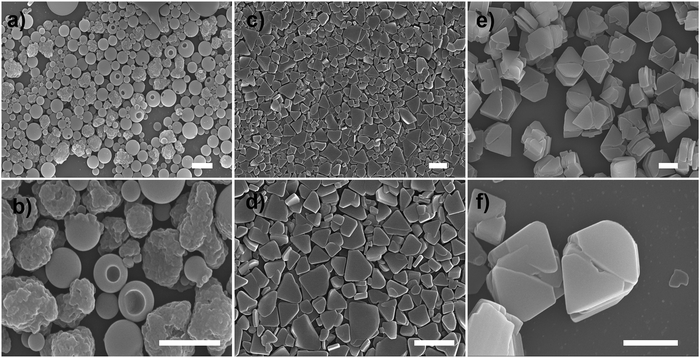
Scanning electron microscopy (SEM) measurement was employed to investigate the morphological transformation of aggregates under different conditions. As shown in Fig. S7a,† the R-SPAn molecule formed amorphous structures upon evaporation of THF. When the water fraction reached 50%, two kinds of nanoparticles with a rough surface and with a hole could be observed (Fig. 2a and b). Upon increasing the fraction of water to 85%, two-dimensional nanoflakes were observed (Fig. 2c and d). Finally, when the water fraction reached 90%, three-dimensionally stacked flakes, which exhibit the largest glum value (Fig. 2e and f), could be obtained. The morphological transformation of S-SPAn nanostructures at various water fractions is shown in Fig. S6.† Thus, by varying the composition of the solvent, a dramatically changed CPL dependent on the morphological transformation could be obtained. We also tried higher volume fractions of water, such as 96% and 98%. Unlike the sample with a water fraction of 90%, the one with fw 96% exhibited the structure of nanobelts, while hollow microspheres were observed in fw 98% (Fig. S7b and c†). However, it is hard to get a plausible CPL signal under these conditions. This was due to the weak luminescence at a higher volume fraction of water.62
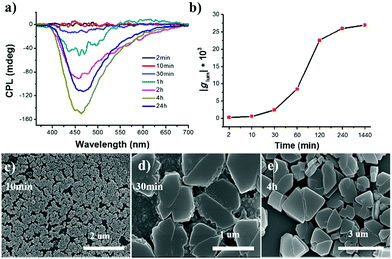
The ripening process of R-SPAn in the water fraction of 90% was monitored by CPL measurement, as shown in Fig. 3a. The time-dependent CPL investigations in the water fraction of 90% showed that the CPL intensity dramatically increased. The time-dependent emission was also investigated, and it showed a similar tendency to CPL, as shown in Fig. S8.†
The glum value at different ripening times is shown in Fig. 3b. In the first two minutes, the glum value of the obtained sample was 2.2 × 10⁻⁴. After 4 hour ripening, the glum value reached 2.6 × 10⁻², and remained at an almost constant value, confirmed by testing the sample after 24 hours (2.7 × 10⁻²). SEM was carried out to carefully investigate the morphological transformation at different ripening times. In the first 10 minutes, mono-disperse nanoparticles with a size distribution of about 140 nm were obtained, as shown in Fig. 3c. When the ripening time reached 30 minutes, the nanoparticles stacked together and fused to form a laminated flake structure with rough edges (Fig. 3d). After 4 hours, stacked 3D nanoflakes with a smooth surface were observed (Fig. 3e). Accompanying the morphology transformation from 0D nanospheres to 3D nanoflakes, the CPL activity also showed amplification. The glum value was amplified by two orders of magnitude to 0.027. The enhanced CPL activity of time-dependent morphology transformation in fw 90% suggested that the CPL activity exhibited morphological dependence.
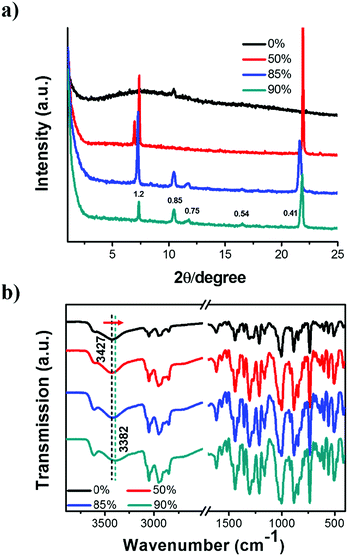
To further clarify the formation of nanostructures with gradually enhanced CPL, X-ray diffraction (XRD) was carried out, as shown in Fig. 4a. The diffraction pattern of the R-SPAn cast film exhibited only one broad peak which indicated the formation of amorphous structures. For the fw 50% sample, three diffraction peaks were observed at 2θ values of 7.01°, 7.37° and 21.94° with d spacings of 1.26 nm, 1.19 nm, and 0.41 nm, respectively. Clearly, upon increasing the volume fraction of water to 85% and 90%, three new diffraction peaks were observed at 2θ values of 10.46°, 11.71° and 16.55°. The whole diffraction peaks of fw 90% gave d spacings of 1.20, 0.85, 0.75 and 0.54 nm with a d spacing ratio of about  , indicating a body-centred cubic packing of the molecules.63 The first order diffraction peak of 3D nanoflakes was located at a 2θ value of 7.34° while the peak of 2D nanoflakes was located at a 2θ value of 7.24°, which indicated a closer molecular packing of the 3D nanoflakes than the 2D ones. In addition, the selected area electron diffraction (SAED) of the nanostructures obtained at fw 85% and 90% showed ordered diffraction patterns (Fig. S9 and Table S2†). The obtained interlattice spacing was about 0.53–0.54 nm, which could be estimated from the result of XRD. These results suggested that the obtained 2D and 3D nanoflakes had ordered molecular packing and a crystalline nature to some extent.
To gain further insight into the non-covalent interactions, Fourier transform infrared (FT-IR) spectra of the nanostructures were obtained and are shown in Fig. 4b. The peaks located at 885 and 846 cm−1 could be attributed to the P–O stretching vibration (aromatic ring). The spectra with sharp peaks at around 1214 cm−1 could be ascribed to the P![[double bond, length as m-dash]](https://www.rsc.org/images/entities/char_e001.gif) O stretching vibration. In addition, the peak appearing at 1442 cm−1 could be ascribed to the stretching vibration of –CH2. The band appearing at 3052 cm−1 could be ascribed to the stretching vibration of unsaturated C–H single bonds.64 Upon increasing the fraction of water, the stretching vibration of the hydroxyl group of the phosphate moiety shifted toward lower wavenumbers, from 3427 cm−1 (fw 0%) to 3382 cm−1 (fw 90%). This was indicative of the existence of hydrogen bonding between intermolecular hydroxyl groups. Simultaneously, the peak became broader, which suggested the existence of an enhanced hydrogen bonding. These results indicated that the enhanced intermolecular hydrogen bond might be the main reason for enhancing the molecular stacking of 2D and 3D nanoflakes with relatively higher glum values.65
O stretching vibration. In addition, the peak appearing at 1442 cm−1 could be ascribed to the stretching vibration of –CH2. The band appearing at 3052 cm−1 could be ascribed to the stretching vibration of unsaturated C–H single bonds.64 Upon increasing the fraction of water, the stretching vibration of the hydroxyl group of the phosphate moiety shifted toward lower wavenumbers, from 3427 cm−1 (fw 0%) to 3382 cm−1 (fw 90%). This was indicative of the existence of hydrogen bonding between intermolecular hydroxyl groups. Simultaneously, the peak became broader, which suggested the existence of an enhanced hydrogen bonding. These results indicated that the enhanced intermolecular hydrogen bond might be the main reason for enhancing the molecular stacking of 2D and 3D nanoflakes with relatively higher glum values.65
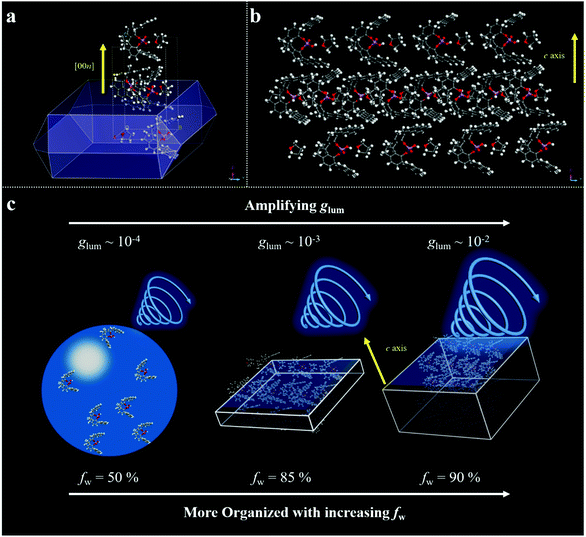
To gain a deep insight into the CPL amplification upon increasing the fraction of water, molecular packing analyses were carried out. We applied Materials Studio as a simulation tool for theoretically predicting the growth morphology of the S-SPAn single crystal. The simulation was performed using MS's morphology component based on the attachment energies. Firstly, the single-crystal of S-SPAn was incubated with THF/water mixed solvent. As shown in Fig. 5a, the crystal morphology of SPAn was plate-like, which was in agreement with the SEM results. The detailed crystallographic data are shown in Table S3.† Based on the XRD patterns, the growth in the thickness of the microplates was along the [001] direction, which could be attributed to the molecular packing based on π–π interaction of anthracene groups and hydrogen bonding between intermolecular hydroxyl groups as shown in Fig. 5b. With all of this in mind, we could speculate on a plausible mechanism for the amplification of CPL dissymmetry factor (glum). When the water fraction was relatively low, the SPAn molecules aggregated in the form of microspheres, which was an amorphous packing mode and showed a relatively low glum (∼10−4). Upon increasing the water content, SPAn molecules could aggregate in the form of microplates in crystalline packing mode, and the organized packing could amplify the CPL dissymmetry factor (glum ∼ 10−3). Furthermore, when the water fraction was elevated to a higher level, more crystal units packed in the thickness direction, i.e., more ordered structures, were involved in the CPL generation process. Thus, glum could be further amplified (glum ∼ 10−2).
Conclusions
In summary, by tailoring the composition of the solvent (THF/H2O), the same chiral emitter R- or S-SPAn could be constructed into various nanostructures, including 0D nanospheres, 2D and 3D nanoflakes. Accompanying the morphological transformation, an amplified circularly polarized emission is observed. The maximum glum value could reach 0.029, which is a relatively large value in pure organic systems. The strong intermolecular interaction resulted in the formation of a more orderly and compact arrangement of nanostructures. The good packing of nanostructures induced a strong excimer emission, which could contribute a large glum value. The morphological dependence of emissive nanostructures on CPL activity can lead to controlled modulation of chiroptical properties, offering great potential for fabricating chiroptical organic nanomaterials.Experimental
Materials
(11aS) and (11ab)-3,7-Di-9-anthracenyl-10,11,12,13-tetrahydro-5-hydroxy-5-oxide diindeno[7,1de:1′,7′-fg][1,3,2] dioxaphosphocin (S-SPAn and R-SPAn) were purchased from Daicel Chiral Compounds (Shang Hai) without further purification. Tetrahydrofuran was purchased from TCI. Milli-Q water (18.2 MO cm) was used in all cases.Preparation
S-SPAn and R-SPAn were dissolved in tetrahydrofuran (THF) with a volume of 1 mL, 500 μL, 150 μL and 100 μL, respectively. And then 500 μL, 850 μL and 900 μL of water were added to the latter three. Thus, the nanostructures with various morphologies could be obtained. The final concentration of R- or S-SPAn of all samples was 1.5 mM.Characterization
UV-vis spectra, fluorescence spectra and CD spectra were obtained using a Hitachi UV-3900, Zolix Omin-λ500i monochromator with a photomultiplier tube PMTH-R 928 and JASCO J-810 spectrometers, respectively. CPL measurements were performed with a JASCO CPL-200 spectrometer. XRD analysis was performed on a Rigaku D/Max-2500X-ray diffractometer (Japan) with CuKα radiation (λ = 1.5406 Å), operated at a voltage of 40 kV and a current of 200 mA. FTIR studies were performed with a JASCO FTIR-660 spectrometer. SEM was performed on a Hitachi S-4800FE-SEM with an accelerating voltage of 10 kV. TEM and selected area electron diffraction were performed on a transmission electron microscope, JEM1011. The fluorescence lifetime measurements were recorded on an Edinburg FLS-980 fluorescence spectrometer using time-correlated single photon counting.Conflicts of interest
There are no conflicts to declare.Acknowledgements
This work was supported by the National Natural Science Foundation of China (91856115, 51673050, and 21802027); the Ministry of Science and Technology of the People's Republic of China (2017YFA0206600 and 2016YFA0203400); and the Key Research Program of Frontier Sciences, CAS (QYZDJ-SSW-SLH044). P. D. is thankful for support from the “New Hundred-Talent Program” research fund of the Chinese Academy of Sciences.Notes and references
- R. A. Hegstrom and D. K. Kondepudi, Sci. Am., 1990, 262, 108–115 CrossRef.
- J. J. Cornelissen, A. E. Rowan, R. J. Nolte and N. A. Sommerdijk, Chem. Rev., 2001, 101, 4039–4070 CrossRef CAS PubMed.
- G. A. Hembury, V. V. Borovkov and Y. Inoue, Chem. Rev., 2008, 108, 1–73 CrossRef CAS PubMed.
- M. Liu, L. Zhang and T. Wang, Chem. Rev., 2015, 115, 7304–7397 CrossRef CAS PubMed.
- R. V. Ulijn, J. Mater. Chem., 2006, 16, 2217–2225 RSC.
- A. R. Hirst, S. Roy, M. Arora, A. K. Das, N. Hodson, P. Murray, S. Marshall, N. Javid, J. Sefcik, J. Boekhoven, J. H. van Esch, S. Santabarbara, N. T. Hunt and R. V. Ulijn, Nat. Chem., 2010, 2, 1089–1094 CrossRef CAS PubMed.
- J. Labuta, S. Ishihara, T. Sikorsky, Z. Futera, A. Shundo, L. Hanykova, J. V. Burda, K. Ariga and J. P. Hill, Nat. Commun., 2013, 4, 2188 CrossRef PubMed.
- M. Yamauchi, T. Ohba, T. Karatsu and S. Yagai, Nat. Commun., 2015, 6, 8936 CrossRef CAS PubMed.
- M. Schadt, Annu. Rev. Mater. Sci., 1997, 27, 305–379 CrossRef CAS.
- C. Wagenknecht, C. M. Li, A. Reingruber, X. H. Bao, A. Goebel, Y. A. Chen, Q. A. Zhang, K. Chen and J. W. Pan, Nat. Photonics, 2010, 4, 549–552 CrossRef CAS.
- G. Muller, Dalton Trans., 2009, 44, 9692–9707 RSC.
- M. C. Heffern, L. M. Matosziuk and T. J. Meade, Chem. Rev., 2014, 114, 4496–4539 CrossRef CAS PubMed.
- F. Zinna and L. Di Bari, Chirality, 2015, 27, 1–13 CrossRef CAS PubMed.
- Y. Yang, R. C. da Costa, M. J. Fuchter and A. J. Campbell, Nat. Photonics, 2013, 7, 634–638 CrossRef CAS.
- I. Sato, R. Sugie, Y. Matsueda, Y. Furumura and K. Soai, Angew. Chem., Int. Ed., 2004, 43, 4490–4492 CrossRef CAS PubMed.
- T. Kawasaki, M. Sato, S. Ishiguro, T. Saito, Y. Morishita, I. Sato, H. Nishino, Y. Inoue and K. Soai, J. Am. Chem. Soc., 2005, 127, 3274–3275 CrossRef CAS PubMed.
- K. Dhbaibi, L. Favereau, M. Srebro-Hooper, M. Jean, N. Vanthuyne, F. Zinna, B. Jamoussi, L. Di Bari, J. Autschbach and J. Crassous, Chem. Sci., 2018, 9, 735–742 RSC.
- N. Saleh, B. Moore IInd, M. Srebro, N. Vanthuyne, L. Toupet, J. A. Williams, C. Roussel, K. K. Deol, G. Muller, J. Autschbach and J. Crassous, Chemistry, 2015, 21, 1673–1681 CrossRef CAS PubMed.
- K. Okano, M. Taguchi, M. Fujiki and T. Yamashita, Angew. Chem., Int. Ed., 2011, 50, 12474–12477 CrossRef CAS PubMed.
- T. Kimoto, N. Tajima, M. Fujiki and Y. Imai, Chem.–Asian J., 2012, 7, 2836–2841 CrossRef CAS PubMed.
- E. M. Sanchez-Carnerero, A. R. Agarrabeitia, F. Moreno, B. L. Maroto, G. Muller, M. J. Ortiz and S. de la Moya, Chemistry, 2015, 21, 13488–13500 CrossRef CAS PubMed.
- F. S. Richardson and J. P. Riehl, Chem. Rev., 1977, 77, 773–792 CrossRef CAS.
- G. Longhi, E. Castiglioni, J. Koshoubu, G. Mazzeo and S. Abbate, Chirality, 2016, 28, 696–707 CrossRef CAS PubMed.
- J. L. Lunkley, D. Shirotani, K. Yamanari, S. Kaizaki and G. Muller, J. Am. Chem. Soc., 2008, 130, 13814–13815 CrossRef CAS PubMed.
- J. Roose, B. Z. Tang and K. S. Wong, Small, 2016, 12, 6495–6512 CrossRef CAS PubMed.
- J. Kumar, T. Nakashima and T. Kawai, J. Phys. Chem. Lett., 2015, 6, 3445–3452 CrossRef CAS PubMed.
- E.-M. Roller, L. K. Khorashad, M. Fedoruk, R. Schreiber, A. O. Govorov and T. Liedl, Nano Lett., 2015, 15, 1368–1373 CrossRef CAS PubMed.
- L. He, M. Wang, J. Ge and Y. Yin, Acc. Chem. Res., 2012, 45, 1431–1440 CrossRef CAS PubMed.
- S. Yagai and A. Kitamura, Chem. Soc. Rev., 2008, 37, 1520–1529 RSC.
- H.-L. Sun, Y. Chen, X. Han and Y. Liu, Angew. Chem., Int. Ed., 2017, 56, 7062–7065 CrossRef CAS PubMed.
- X. Miao, J. Li, B. Zha, K. Miao, M. Dong, J. Wu and W. Deng, Appl. Surf. Sci., 2018, 433, 1075–1082 CrossRef CAS.
- P. Moitra, Y. Subramanian and S. Bhattacharya, J. Phys. Chem. B, 2017, 121, 815–824 CrossRef CAS PubMed.
- P. Moitra, K. Kumar, P. Kondaiah and S. Bhattacharya, Angew. Chem., Int. Ed., 2014, 53, 1113–1117 CrossRef CAS PubMed.
- H. J. Dou, M. Jiang, H. S. Peng, D. Y. Chen and Y. Hong, Angew. Chem., Int. Ed., 2003, 42, 1516–1519 CrossRef CAS PubMed.
- Y. Li, T. Zhao, C. Wang, Z. Lin, G. Huang, B. D. Sumer and J. Gao, Nat. Commun., 2016, 7, 13777–13788 CrossRef CAS PubMed.
- H. Yao, M. Qi, Y. Liu and W. Tian, Chem.–Eur. J., 2016, 22, 8508–8519 CrossRef CAS PubMed.
- K. V. Rao, D. Miyajima, A. Nihonyanagi and T. Aida, Nat. Chem., 2017, 9, 1133–1139 CrossRef PubMed.
- X. Wang and M. Liu, Chem.–Eur. J., 2014, 20, 10110–10116 CrossRef CAS PubMed.
- H. Maeda, Y. Bando, K. Shimomura, I. Yamada, M. Naito, K. Nobusawa, H. Tsumatori and T. Kawai, J. Am. Chem. Soc., 2011, 133, 9266–9269 CrossRef CAS PubMed.
- E. M. Sanchez-Carnerero, F. Moreno, B. L. Maroto, A. R. Agarrabeitia, M. J. Ortiz, B. G. Vo, G. Muller and S. de la Moya, J. Am. Chem. Soc., 2014, 136, 3346–3349 CrossRef CAS PubMed.
- Z. Shen, T. Wang, L. Shi, Z. Tang and M. Liu, Chem. Sci., 2015, 6, 4267–4272 RSC.
- J. Kumar, H. Tsumatori, J. Yuasa, T. Kawai and T. Nakashima, Angew. Chem., Int. Ed., 2015, 54, 5943–5947 CrossRef CAS PubMed.
- C. Bai and M. Liu, Angew. Chem., Int. Ed., 2013, 52, 2678–2683 CrossRef CAS PubMed.
- B. Han, Acta Phys.-Chim. Sin., 2017, 33, 2325–2326 CAS.
- X. H. Liu, J. M. Jiao, X. X. Jiang, J. F. Li, Y. X. Cheng and C. J. Zhu, J. Mater. Chem. C, 2013, 1, 4713–4719 RSC.
- J. Kumar, T. Nakashima, H. Tsumatori, M. Mori, M. Naito and T. Kawai, Chemistry, 2013, 19, 14090–14097 CrossRef CAS PubMed.
- J. Liu, H. Su, L. Meng, Y. Zhao, C. Deng, J. C. Y. Ng, P. Lu, M. Faisal, J. W. Y. Lam, X. Huang, H. Wu, K. S. Wong and B. Z. Tang, Chem. Sci., 2012, 3, 2737–2747 RSC.
- J. Zhang, Q. Liu, W. Wu, J. Peng, H. Zhang, F. Song, B. He, X. Wang, H. H. Sung, M. Chen, B. S. Li, S. H. Liu, J. W. Y. Lam and B. Z. Tang, ACS Nano, 2019, 13, 3618–3628 CrossRef CAS PubMed.
- D. Yang, P. Duan, L. Zhang and M. Liu, Nat. Commun., 2017, 8, 15727–15736 CrossRef CAS.
- J. Han, P. Duan, X. Li and M. Liu, J. Am. Chem. Soc., 2017, 139, 9783–9786 CrossRef CAS PubMed.
- X. Yang, J. Han, Y. Wang and P. Duan, Chem. Sci., 2019, 10, 172–178 RSC.
- J. Kumar, T. Nakashima, H. Tsumatori and T. Kawai, J. Phys. Chem. Lett., 2014, 5, 316–321 CrossRef CAS PubMed.
- A. G. Hu, Y. Fu, J. H. Xie, H. Zhou, L. X. Wang and Q. L. Zhou, Angew. Chem., Int. Ed., 2002, 41, 2348–2350 CrossRef CAS PubMed.
- Y. Fu, J. H. Xie, A. G. Hu, H. Zhou, L. X. Wang and Q. L. Zhou, Chem. Commun., 2018, 54, 1449–1452 RSC.
- K. Takaishi, R. Takehana and T. Ema, Chem. Commun., 2018, 54, 1449–1452 RSC.
- M. Inouye, K. Hayashi, Y. Yonenaga, T. Itou, K. Fujimoto, T. Uchida, M. Iwamura and K. Nozaki, Angew. Chem., Int. Ed., 2014, 53, 14392–14396 CrossRef CAS PubMed.
- P. K. Lekha and E. Prasad, Chemistry, 2010, 16, 3699–3706 CrossRef CAS PubMed.
- Y. Sheng, J. Ma, S. Liu, Y. Wang, C. Zhu and Y. Cheng, Chemistry, 2016, 22, 9519–9522 CrossRef CAS PubMed.
- L. Yang, C.-S. Kwan, L. Zhang, X. Li, Y. Han, K. C.-F. Leung, Y. Yang and Z. Huang, Adv. Funct. Mater., 2018, 1807307–1807315 CrossRef.
- J. P. Riehl and F. S. Richardson, Chem. Rev., 1986, 86, 1–16 CrossRef CAS.
- T. Nakanishi, M. Naito, Y. Takeoka and K. Matsuura, Curr. Opin. Colloid Interface Sci., 2011, 16, 482–490 CrossRef CAS.
- K. Liu, R. Y. Zhang, Y. X. Li, T. F. Jiao, D. A. Ding and X. H. Yan, Adv. Mater. Interfaces, 2017, 4, 1600183–1600189 CrossRef.
- I. W. Hamley and V. Castelletto, Prog. Polym. Sci., 2004, 29, 909–948 CAS.
- F. Mangolini, A. Rossi and N. D. Spencer, Tribol. Lett., 2009, 35, 31–43 CrossRef CAS.
- Y. Sang, P. Duan and M. Liu, Chem. Commun., 2018, 54, 4025–4028 RSC.
Footnote |
| † Electronic supplementary information (ESI) available. See DOI: 10.1039/c9sc01577a |
| This journal is © The Royal Society of Chemistry 2019 |

