 Open Access Article
Water-soluble chiral tetrazine derivatives: towards the application of circularly polarized luminescence from upper-excited states to photodynamic therapy†
Tingchao
He
 a,
Can
Ren
a,
Yu
Luo
b,
Qi
Wang
c,
Junzi
Li
a,
Xiaodong
Lin
a,
Chuanxiang
Ye
a,
Wenbo
Hu
*c and
Junmin
Zhang
a,
Can
Ren
a,
Yu
Luo
b,
Qi
Wang
c,
Junzi
Li
a,
Xiaodong
Lin
a,
Chuanxiang
Ye
a,
Wenbo
Hu
*c and
Junmin
Zhang
 *b
*b
aCollege of Physics and Energy, Shenzhen University, Shenzhen 518060, China
bCollege of Chemistry and Environmental Engineering, Shenzhen University, Shenzhen 518060, China. E-mail: zhangjm@szu.edu.cn
cKey Laboratory of Flexible Electronics (KLOFE), Institute of Advanced Materials (IAM), Jiangsu National Synergetic Innovation Center for Advanced Materials (SICAM), Nanjing Tech University (NanjingTech), Nanjing 211816, China. E-mail: iamwbhu@njtech.edu.cn
First published on 8th March 2019
Abstract
A new family of water-soluble chiral tetrazine derivatives 1 and 2 is reported. Spectroscopic studies reveal that the derivatives violate Kasha's rule and emit from their upper-excited states (Sn, n > 1). The transition assignments are supported by time-dependent density functional theory calculations. More importantly, both chromophores exhibit anisotropy factors on the order of ∼10−3 to 10−4 for circular dichroism and circularly polarized luminescence (CPL) from upper-excited states. Additionally, the nonplanar geometry of the derivatives induces a significant yield of triplet excited states. Transient absorption spectroscopic measurements reveal high triplet quantum yields of ∼86% for 1 and ∼81% for 2. Through in vitro studies, we demonstrate that the derivatives can be used as photodynamic therapy (PDT) agents, providing a highly efficient form of cancer therapy. This study is the first demonstration of simple organic molecules with CPL from upper-excited states and efficient PDT.
Introduction
When the energy gap between short- and long-wavelength bands becomes sufficiently large, a slow internal conversion process between upper-excited states (Sn, n > 1) and S1 excited states is expected.1–6 In this case, some molecules display weak emission from the Sn state to the S0 state. Contrary to Kasha's rule, molecules that emit Sn fluorescence are rare but are particularly promising in photovoltaic cells and optically operated logic gates.7 Furthermore, investigating the photophysical properties in the Sn states is very important and challenging because many energy and electron transfer processes occur in the initial Sn states, and the deactivation process from the Sn states is relatively rapid. Several types of organic molecules including porphyrin-based systems,1–5 boron dipyrromethene derivatives,6 azulene,8 and thiones9 have received much attention because of their peculiar S2 emission properties. Although some papers report general fluorescence emission from Sn states,1–6 circularly polarized luminescence (CPL) from Sn states has not yet been developed. Interest in CPL has grown in recent years, especially because of its utilization as a source of information about the chiral structures of emitting excited states, as well as its potential for smart photonic applications such as 3D displays and information storage.10–15 In particular, the development of CPL from Sn states may increase the number of potential applications of chiral materials. Despite their promising application background, such organic molecules are still scarce and are practically unknown. There are two effective ways to achieve molecular chirality. One way is to tether a perturbing chiral moiety to an inherently achiral organic chromophore.14 The other way is to fabricate achiral organic molecules into chiral building blocks, such as double helices, twists, and rolled-up nanotubes.16 Although the first way is less efficient relative to the second, it is more useful for some special CPL-related applications, e.g., biomolecular CPL sensing in cells and smart photonic devices. If the achiral molecules with emission from upper-excited states are perturbed with chiral moieties, CPL from the upper-excited states should be achieved.It should be noted that the dynamic processes of these organic molecules are affected by not only the energy gap but also intersystem crossing (ISC), which is a key factor for the application of photodynamic therapy (PDT).17–19 Although the fluorescence emission from Sn states and the ISC properties of simple molecules have been studied separately, the combination of CPL from Sn states and efficient ISC into these states remains absent in the literature. Therefore, the design and synthesis of such special, simple molecules may open up new avenues for their use in various applications, such as in photovoltaics and biological science, as well as in new fields that are currently under exploration. There are also two ways to achieve efficient ISC in organic molecules. One way is to introduce heavy metals to enhance molecular spin–orbit coupling; the other way is to reduce the energy gap between the singlet and triplet states.20 The latter can be realized through the incorporation of curved (nonplanar) π-electron systems into the organic molecules.21–24 Hence, the combination of CPL from Sn states and efficient ISC from the singlet to the triplet states may be achieved in twisted molecular architectures that are perturbed with chiral moieties and have a sufficiently large energy gap between the Sn and S1 states.
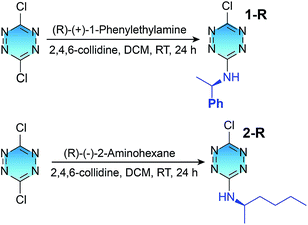
In this work, we have designed and synthesized the enantiomeric twisted tetrazine derivatives 1-R, 1-S, 2-R and 2-S as evidence of the workability of a new simple structural design. (R or S)-1-Phenylethyl-amine and (R or S)-2-aminohexane were tethered to the achiral tetrazine core to form new chiral tetrazine derivatives 1-R, 1-S, 2-R and 2-S, respectively. Additionally, the derivatives exhibit a large energy gap between the Sn and S1 states. More interestingly, the water-soluble, simple organic molecules represent the first example of chiral molecules enabling CPL from Sn states, which can be exploited to generate exceptional ISC in PDT.
Results and discussion
Tetrazine derivatives 1-R, 1-S, 2-R and 2-S were straightforwardly obtained from a commercially available 3,6-dichlorotetrazine core, by substitution with commercial (R or S)-1-phenylethylamine and (R or S)-2-aminohexane, respectively, according to a previously described method (Scheme 1).25,26 Compounds 1 and 2 were characterized by 1H NMR and 13C NMR spectroscopy, and elemental analysis (Fig. S1–S4 in the ESI†). The obtained samples of 1 and 2 were not solid powders but liquids with high viscosity, so a single crystal of the derivatives cannot be easily obtained to confirm their absolute configurations. Previous literature reports have proven that the use of (R or S)-1-phenylethylamine and (R or S)-2-aminohexane as starting materials for similar transformations will not alter the absolute configuration of the resultant derivatives.27–30 Therefore, the absolute configuration of chiral centres of the derivatives should be consistent with (R or S)-1-phenylethylamine and (R or S)-2-aminohexane, even though no single crystal X-ray analysis is provided. Compounds 1 and 2 can be dissolved easily in chloroform (CHCl3) and water.To investigate the electronic structures of the tetrazine derivatives 1 and 2, their photophysical properties were investigated. As shown in Fig. 1a and b, both 1 and 2 display sharp absorption bands that correspond to S0–Sn centred at 250 and 252 nm. The second broad bands (S0–S2) show vibronic features with maxima at 391 and 413 nm for 1, and 397 and 417 nm for 2. Additionally, the third broad absorption band (S0–S1) was observed for 1 and 2 peaking at 520 and 521 nm, respectively. The experimental absorption spectra can be reproduced well using time-dependent density functional theory (TDDFT B3LYP 631G**, Fig. S5†), and the relevant transitions can be further confirmed by the calculation of their oscillation strengths (Table S1†). The lowest energy singlet excited states were calculated to elucidate the nature of the electronic transitions that give rise to the absorption bands in the electronic spectra (Fig. 1). For chromophores 1 and 2, TD-DFT predicts that the S0 → S1 and S0 → S2 bands are a HOMO → LUMO and a HOMO−1 → LUMO transition, respectively, whereas the S0 → Sn band corresponds to a HOMO−1 → LUMO+1 transition (Fig. S6†).
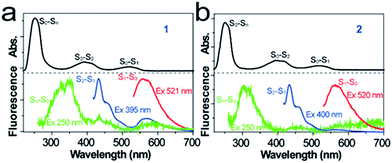 | ||
| Fig. 1 Comparison of absorption and fluorescence spectra of (a) 1 and (b) 2 in CHCl3 under excitation by different wavelengths. | ||
Fluorescence studies performed on 1 and 2 revealed that the S1 → S0 emission peaks were located at 565 and 564 nm, respectively, starting with a 521 nm excitation from the lowest energy S0 → S1 band (Fig. 1). Importantly, for chromophore 1, one dominant emission band other than the broad S1 → S0 emission appeared, with three maxima at 433, 469 and 495 nm, starting with a 395 nm excitation that corresponds to the S0 → S2 transition. This broad emission band for 1 was consistent in energy with an S2 → S0 emission. Chromophore 2 displays the S2 → S0 broad emission band with three maxima at 434, 468 and 496 nm. More interestingly, after a 250 nm excitation corresponding to the S0 → Sn transition, another broad emission band was observed for both 1 and 2. The broad emission band for 1 with a maximum at 345 nm correlates in energy with a radiative Sn → S0 deactivation, whereas the Sn → S0 broad emission band with a maximum at 311 nm was observed for chromophore 2. To the best of our knowledge, this is the first observed Sn → S0 (n > 2) emission. According to Kasha's rule, the emitting electronic level of a molecule is usually its lowest excited level. However, in the case of a large energy gap between the Sn (n > 1) and S1 states, which corresponds to their small Sn–S1 vibrational overlap (Franck–Condon) factor, the nonradiative decay from the Sn state will be much slower. The fact that compounds 1 and 2 violate Kasha's rule can be attributed to the large S2–S1 and Sn–S1 energy gaps. The energy gap values for S2–S1 (1.84 eV) and Sn–S1 (2.58 eV) were estimated for 1, which are comparable to the corresponding values of 2, i.e., S2–S1 (1.91 eV) and Sn–S1 (2.57 eV). These values are among the largest for molecules that emit from the Sn (n > 1) level.1–6 It is reasonable that the large S2–S1 and Sn–S1 energy gaps of 1 and 2 lead to the violation of Kasha's rule, and thus to the emission from the S2 and Sn levels. The fluorescence quantum yields of the S1, S2 and Sn emissions were determined to be 0.013%, 0.04% and 4.5 × 10⁻⁵% for 1, while the respective values were 0.025%, 0.08% and 6.4 × 10⁻⁵% for 2. The low fluorescence quantum yields of 1 and 2 should be mainly caused by the rapid deactivation process from the Sn states and high efficiency ISC from the singlet state to the triplet state, which will be discussed later.
To evaluate the chiroptical properties of the tetrazine derivatives, we measured their CD spectra. The entire CD spectra of 1-R, 1-S, 2-R and 2-S give clear mirror images, which extend from the extreme ultraviolet to visible bands (Fig. 2). The enantiopure 1-R and 1-S show opposite Cotton effects at 250 and 400 nm. Moreover, the maximum dichroic signals of the CD spectra match the maximum absorption of the chromophores. The maximum level of CD measured in terms of |gabs| was 3.2 × 10⁻³ at 290 nm, 4.1 × 10⁻⁴ at 400 nm and 4.8 × 10⁻⁵ at 520 nm for 1, whereas the relevant values for 2 were 1.6 × 10⁻³ at 290 nm, 2.5 × 10⁻⁴ at 400 nm and 2.8 × 10⁻⁵ at 520 nm. These values were determined by the equation gabs = Δε/ε = (AL − AR)/A, where A represents the conventional absorption of nonpolarized light and AL and AR are the absorption of left and right circularly polarized light, respectively.31,32 Moreover, the simulated CD spectra of compounds 1 and 2 were compared with their experimental spectra and they basically reproduced the experimental features, especially in the high-energy part.
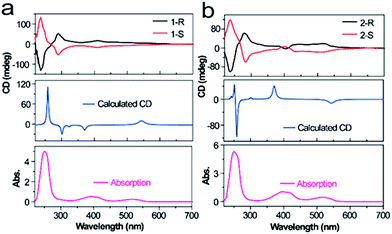 | ||
| Fig. 2 Comparison of absorption for experimental and theoretically calculated CD spectra of 1 and 2. | ||
The strong CD response of 1 and 2 in their ground states makes their CPL possible. Considering the limit of the excitation wavelength of our CPL instrument (350–800 nm), we only measured the CPL properties of enantiopure 1 and 2 in CHCl3 excited at 395 and 520 nm (Fig. 3). As expected, upon excitation at 520 nm, 1 and 2 indeed exhibited CPL activities from the S1 state, whereas CPL from the S2 state was observed after excitation at 395 nm. The recorded CPL spectra are virtually mirror images, whose maxima match the maximum emissions of 1 and 2. The dissymmetric factor for luminescence, |glum|, which is defined as glum = 2(IL − IR)/(IL + IR), where IL and IR are the intensities of left and right fluorescence emission,31,32 was estimated to be 7.9 × 10⁻⁴ for 1 and 4.5 × 10⁻⁴ for 2 when excited at 395 nm. When excited at 520 nm, the values of |glum| were determined to be 7.2 × 10⁻⁵ for 1 and 4.9 × 10⁻⁵ for 2. Although the values of |glum| are relatively small, they prove, for the first time, the feasibility of achieving CPL with simple molecules, especially from the Sn state. Although we have not measured the CPL spectra of 1 and 2 upon excitation at 250 nm, it is highly expected that CPL activities from Sn can be achieved, considering their strong CD signals that correspond to the S0–Sn transition.
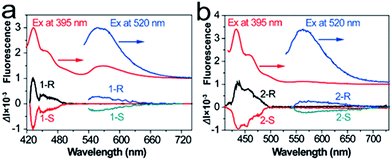 | ||
| Fig. 3 Comparison of absorption and CPL spectra of (a) 1 and (b) 2 under excitation by different wavelengths. | ||
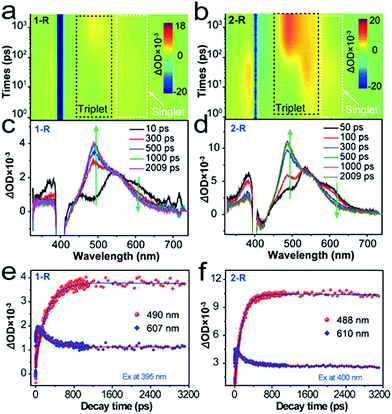
To unravel the kinetics of the ISC, the chromophores 1-R and 2-R in CHCl3 were excited at 400 nm with a 100 fs laser pulse. Full contour plots of fs-TA spectra of 1-R and 2-R are shown in Fig. 4a and b, respectively. Fs-TA spectra of 1-R and 2-R at various pump–probe delay times are plotted in Fig. 4c and d. Chromophore 1-R exhibits positive absorption peaks centred at 381, 447, 490, 546 and 607 nm, whereas positive absorption peaks centred at 385, 457, 488, 546 and 610 nm are observed for 2-R. Remarkably, for 1-R (2-R), accompanied by the decay of the band at 607 nm (610 nm), another positive band peak at 490 nm (488 nm) gradually appears. Positive absorption centred at 607 nm (610 nm) corresponds to singlet–singlet transitions, whereas the positive absorption band at 490 nm (488 nm) is ascribed to the triplet–triplet transition. For more underlying information, the fs-TA profiles and kinetic traces at the wavelengths of the singlet and triplet states were extracted and are presented in Fig. 4e and f. For chromophore 1-R, the corresponding global fitting on the 607 and 490 nm traces resulted in one decay component of 229 ps and one rise component of 266 ps. Similarly, a decay lifetime of 141 ps and rise time of 175 ps were estimated for 2-R. Accordingly, the efficiency of ISC (ΦISC) was estimated to be ΦISC = (1/τrise)/(1/τdecay) = 0.86 for 1-R and 0.81 for 2-R.33,34 The efficiencies of ISC in 1-R and 2-R are among the highest values for organic molecules.35–38 From the energy-optimized structures of 1-R and 2-R calculated using DFT at the B3LYP/3-21G(d) level, it is apparent that chromophores 1-R and 2-R exhibit severe out-of-plane distortion that can lead to the breakdown of the σ–π orbital separation, and thus enhance the spin–orbital coupling that is necessary for a highly efficient ISC (inset of Fig. S5†).39–42 To confirm this, the spin–orbital couplings (ξS1T1) of 1 and 2 were calculated to be 0.86 cm−1 and 0.47 cm−1, respectively (Fig. S7†). These results also account for the low fluorescence quantum yield, proving the generation of the triplet state through a highly efficient ISC pathway.
Low-temperature emission properties of 1-R and 2-R were studied to obtain their singlet and triplet energy gaps (ΔEST). As shown in Fig. S8,† through the comparison of the fluorescence and phosphorescence bands, equivalent values of ΔEST for 1-R and 2-R were estimated, i.e., 0.42 eV for both 1-R and 2-R. Such a low value of ΔEST is quite favourable for the singlet-to-triplet ISC process with high efficiency.43 Comparisons between 1-R and 2-R suggest that the substituents can slightly influence their ISC properties. The 1-phenylethylamine group can boost the efficient ISC pathway with the aid of a great ξST, where the spin–orbit interaction mixes two states that differ in both spin and electronic configurations. The aforementioned results clearly prove a highly efficient ISC process and the consequential singlet oxygen generation for 1-R and 2-R upon direct optical excitation. We also measured the actual efficiencies of 1O2 generation (ΦΔ) for chromophores 1 and 2 in water by using the commercial photosensitizer 5,10,15,20-tetrakis(1-methyl-4-pyridinio)porphyrin tetra(p-toluenesulfonate) (TMPyP4) as a standard (Φr = 0.74 in water), and the measurement details are described in the ESI.†19,44 Values of ΦΔ = 0.73 and 0.69 were obtained for 1-R and 2-R, respectively, after 400 nm light irradiation.
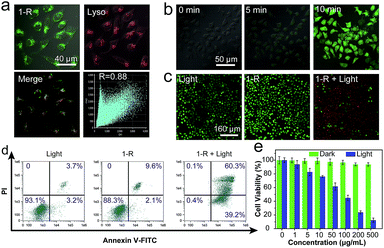
It has been reported that most organic molecules exhibit low ΦΔ in solvents with high polarity and are even insoluble in water.45–48 The good solubilities of 1 and 2, as well as their high ΦΔ values in water, indicate that they are promising candidates for use in PDT. Considering the higher value of ΦΔ for 1-R, we selected it as the photosensitizer to demonstrate the proof-of-concept for PDT application. The specific cellular target of 1-R was further confirmed by colocalization assays. The excellent overlap between 1-R and commercial lysosome Tracker Red (Lyso) suggests that 1-R localises in the lysosome (Fig. 5a). Given the key role of reactive oxygen species (ROS, e.g., 1O2) in PDT, we first verified the ability of 1-R to generate intracellular ROS by determining the fluorescence of an ROS tracker, 2,7-dichlorofluorescein diacetate (DCF-DA), which was based on the fact that nonfluorescent DCF-DA can be oxidized by ROS into green-emissive DCF.49 No obvious fluorescence was observed prior to irradiation (Fig. 5b), whereas significantly enhanced fluorescence occurred along with the increasing irradiation time under a white light emitting diode, demonstrating the intracellular ROS generation by 1-R. By employing a calcein AM (living cell) and propidium iodide (PI, dead cell) cellular viability kit, we can distinguish the dead cells from the living cells and visually clarify the PDT effect (Fig. 5c).50 Upon either light irradiation or 1-R exposure alone, most of the cells showed great cellular viability, which demonstrated the resistance of cells to light irradiation and the low dark-cytotoxicity of 1-R. With both light irradiation and 1-R exposure, the significantly changed morphology of cells and red fluorescence confirmed the excellent therapeutic effects of 1-R. Then, we conducted a typical flow cytometric assay with HeLa cells to quantitatively evaluate the PDT effect (Fig. 5d). After treatment with either light irradiation or 1-R alone, the HeLa cells exhibited cell viability of >88% (Annexin V-FITC−/PI−), again indicating their high resistance to light irradiation and the low dark-cytotoxicity of 1-R. However, upon exposure to light irradiation and 1-R, the population of early- (39%, Annexin V-FITC+/PI−) and late-stage (60%, Annexin V-FITC+/PI+) apoptotic HeLa cells significantly increased, which was induced by the highly efficient PDT effect of 1-R. Moreover, the efficient PDT effect of 1-R can be further revealed by the MTT assay (Fig. 5e). It can be concluded that 1-R is a promising candidate with potential for application in PDT.
Conclusions
In conclusion, we designed and synthesized chiral and water-soluble tetrazine derivatives 1 and 2. We observed unusual CPL from the S2 states, which violates Kasha's rule and results from the large values of the energy gaps between the S0 and S2 states. Although the glum values are in the typical range for simple molecules, the achievement of CPL from upper-excited states is reported for the first time. We also noted that the studied compounds with severely distorted molecular geometries exhibit remarkable ISC and efficient 1O2 generation. Finally, we demonstrated a proof-of-concept application of 1-R for PDT. The present work may lead to a new generation of simple molecules with overall performance superior to that of conventional agents in terms of CPL from upper-excited states, 1O2 quantum yield, water dispersibility, and biocompatibility.Experimental
Steady-state spectroscopy
The UV-visible absorption measurements were carried out using a UV-vis-NIR spectrophotometer (Lambda 950, PerkinElmer, Inc.), while the fluorescence spectra were collected with a spectrometer (Zolix, SENS-9000). CD measurements were conducted on a JASCO J-1500 CD spectrometer, and CPL measurements were performed on a JASCO CPL-300 spectrometer.Measurements of the fs-TA spectrum
The fs-TA spectra and dynamics were recorded using a standard pump–probe configuration at 350 nm, ∼100 fs pump pulses at a 1 kHz repetition rate and a broadband white-light supercontinuum probe (18SI80466 Rev.1, Newport). The excited spot diameter was 300 μm, and the measured quantity was the normalized transmission change, i.e., ΔA/A, which was performed on sample solutions with an optical density below 1 at the excitation wavelength.Photodynamic therapy activity on cancer cells
The experimental details are described in the ESI.†Conflicts of interest
The authors declare no conflict of interest.Acknowledgements
This research was financially supported by the National Natural Science Foundation of China (NSFC Grant no. 11404219, and 61805118) and the Shenzhen Basic Research Project of Science and Technology under Grant No. JCYJ20170302142433007 and the Natural Science Foundation of Guangdong Province (2018A030310637), the Natural Science Foundation of Jiangsu Province of China (No. BK20171020), the China Postdoctoral Science Foundation (No. 2017M621733 and 2018T110488), and the open research fund of the Key Laboratory for Organic Electronics and Information Displays. We gratefully acknowledge the supports from the Instrumental Analysis Center of Shenzhen University (Xili Campus).Notes and references
- Y. Shen, Y. Yao, A. N. Brigeman, H. Kim and N. C. Giebink, Nano Lett., 2018, 18, 1693–1698 CrossRef CAS PubMed.
- W. Cha, W. Kim, H. Mori, T. Yoneda, A. Osuka and D. Kim, J. Phys. Chem. Lett., 2017, 8, 3795–3799 CrossRef CAS PubMed.
- J. O. Kim, Y. Hong, T. Kim, W. Cha, T. Yoneda, T. Soya, A. Osuka and D. Kim, J. Phys. Chem. Lett., 2018, 9, 4527–4531 CrossRef CAS PubMed.
- R. García, S. More, M. Melle-Franco and A. Mateo-Alonso, Org. Lett., 2014, 16, 6096–6099 CrossRef PubMed.
- J. Sung, P. Kim, S. Saga, S. Hayashi, A. Osuka and D. Kim, Angew. Chem., Int. Ed., 2013, 52, 12632–12635 CrossRef CAS PubMed.
- D. W. Cho, M. Fujitsuka, J. H. Ryu, M. H. Lee, H. K. Kim, T. Majimabc and C. Ima, Chem. Commun., 2012, 48, 3424–3426 RSC.
- J. Szmytkowski, S. M. K. Brunet, U. Tripathy, J. A. O'Brien, M. F. Paige and R. P. Steer, Chem. Phys. Lett., 2011, 501, 278–282 CrossRef CAS.
- M. Beer and H. C. Longuet-Higgins, J. Chem. Phys., 1955, 23, 1390 CrossRef CAS.
- M. H. Hui, P. D. Mayo, R. Suau and R. W. Ware, Chem. Phys. Lett., 1975, 31, 257–263 CrossRef CAS.
- M. Li, S. H. Li, D. Zhang, M. Cai, L. Duan, M. K. Fung and C.-F. Chen, Angew. Chem., Int. Ed., 2018, 57, 2889–2893 CrossRef CAS PubMed.
- M. Naito, K. Iwahori, A. Miura, M. Yamane and I. Yamashita, Angew. Chem., Int. Ed., 2010, 49, 7006–7009 CrossRef CAS PubMed.
- T. Otani, A. Tsuyuki, T. Iwachi, S. Someya, K. Tateno, H. Kawai, T. Saito, K. S. Kanyiva and T. Shibata, Angew. Chem., Int. Ed., 2017, 56, 3906–3910 CrossRef CAS PubMed.
- J. Cheng, J. Hao, H. Liu, J. Li, J. Li, X. Zhu, X. Liu, K. Wang and T. He, ACS Nano, 2018, 12, 5341–5350 CrossRef CAS PubMed.
- E. M. Sánchez-Carnerero, F. Moreno, B. L. Maroto, A. R. Agarrabeitia, M. J. Ortiz, B. G. Vo, G. Muller and S. Moya, J. Am. Chem. Soc., 2014, 136, 3346–3349 CrossRef PubMed.
- Y. Inoue, D. Sakamaki, Y. Tsutsui, M. Gon, Y. Chujo and S. Seki, J. Am. Chem. Soc., 2018, 140, 7152–7158 CrossRef CAS PubMed.
- J. Kumar, T. Nakashima, H. Tsumatori and T. Kawai, J. Phys. Chem. Lett., 2014, 5, 316–321 CrossRef CAS PubMed.
- C. Ji, Q. Gao, X. Dong, W. Yin, Z. Gu, Z. Gan, Y. Zhao and M. Yin, Angew. Chem., Int. Ed., 2018, 57, 11384–11388 CrossRef CAS PubMed.
- E. Ju, K. Dong, Z. Chen, Z. Liu, C. Liu, Y. Huang, Z. Wang, F. Pu, J. Ren and X. Qu, Angew. Chem., Int. Ed., 2016, 55, 11467–11471 CrossRef CAS PubMed.
- W. Hu, M. Xie, H. Zhao, Y. Tang, S. Yao, T. He, C. Ye, Q. Wang, X. Lu, W. Huang and Q. Fan, Chem. Sci., 2018, 9, 999–1005 RSC.
- H. Uoyama, K. Goushi, K. Shizu, H. Nomura and C. Adachi, Nature, 2012, 492, 234–238 CrossRef CAS PubMed.
- Y. Nakakuki, T. Hirose, H. Sotome, H. Miyasaka and K. Matsuda, J. Am. Chem. Soc., 2018, 140, 4317–4326 CrossRef CAS PubMed.
- A. Bedi, L. J. W. Shimon and O. Gidron, J. Am. Chem. Soc., 2018, 140, 8086–8090 CrossRef CAS PubMed.
- C. Zhou, Y. Ren, J. Han, X. Gong, Z. Wei, J. Xie and R. Guo, J. Am. Chem. Soc., 2018, 140, 9417–9425 CrossRef CAS PubMed.
- N. J. Schuster, R. H. Sánchez, D. Bukharina, N. A. Kotov, N. Berova, F. Ng, M. L. Steigerwald and C. Nuckolls, J. Am. Chem. Soc., 2018, 140, 6235–6239 CrossRef CAS PubMed.
- C. Allain, J. Piard, A. Brosseau, M. Han, J. Paquier, T. Marchandier, M. Lequeux, C. Boissière and P. Audebert, ACS Appl. Mater. Interfaces, 2016, 8, 19843–19846 CrossRef CAS PubMed.
- Y. H. Gong, F. Miomandre, R. Méallet-Renault, S. Badré, L. Galmiche, J. Tang, P. Audebert and G. Clavier, Eur. J. Org. Chem., 2009, 2009, 6121–6128 CrossRef.
- Z. Yang and J. Zhou, J. Am. Chem. Soc., 2012, 134, 11833–11835 CrossRef CAS PubMed.
- C. Wu, M. S. Coumar, C. Chu, W. Lin, Y. Chen, C. Chen, H. Shiao, S. Rafi, S. Wang, H. Hsu, C. Chen, C. Chang, T. Chang, T. Lien, M. Fang, K. Yeh, C. Chen, T. Yeh, S. Hsieh, J. T.-A. Hsu, C. Liao, Y. Chao and H. Hsieh, J. Med. Chem., 2010, 53, 7316–7326 CrossRef CAS PubMed.
- Q. Shen, T. Ogata and J. F. Hartwig, J. Am. Chem. Soc., 2008, 130, 6586–6596 CrossRef CAS PubMed.
- Q. Shen, S. Shekhar, J. P. Stambuli and J. F. Hartwig, Angew. Chem., Int. Ed., 2005, 44, 1371–1375 CrossRef CAS PubMed.
- J. E. Field, G. Muller, J. P. Riehl and D. Venkataraman, J. Am. Chem. Soc., 2003, 125, 11808–11809 CrossRef CAS PubMed.
- A. Satrijo, S. C. J. Meskers and T. M. Swager, J. Am. Chem. Soc., 2006, 128, 9030–9031 CrossRef CAS PubMed.
- K. Nagarajan, A. R. Mallia, K. Muraleedharan and M. Hariharan, Chem. Sci., 2017, 8, 1776–1782 RSC.
- Y. Wu, Y. Zhen, Y. Ma, R. Zheng, Z. Wang and H. Fu, J. Phys. Chem. Lett., 2010, 1, 2499–2502 CrossRef CAS.
- F. Hu, S. Xu and B. Liu, Adv. Mater., 2018, 30, 1801350 CrossRef PubMed.
- W. Piao, K. Hanaoka, T. Fujisawa, S. Takeuchi, T. Komatsu, T. Ueno, T. Terai, T. Tahara, T. Nagano and Y. Urano, J. Am. Chem. Soc., 2017, 139, 13713–13719 CrossRef CAS PubMed.
- Z. Wang, J. Zhao, A. Barbon, A. Toffoletti, Y. Liu, Y. An, L. Xu, A. Karatay, H. G. Yaglioglu, E. A. Yildiz and M. Hayvali, J. Am. Chem. Soc., 2017, 139, 7831–7842 CrossRef CAS PubMed.
- R. Acharya, S. Cekli, C. J. Zeman, R. M. Altamimi and K. S. Schanze, J. Phys. Chem. Lett., 2016, 7, 693–697 CrossRef CAS PubMed.
- W. Zhao, Z. He, Q. Peng, J. W. Y. Lam, H. Ma, Z. Qiu, Y. Chen, Z. Zhao, Z. Shuai, Y. Dong and B. Z. Tang, Nat. Commun., 2018, 9, 3044 CrossRef PubMed.
- Y. Cakmak, S. Kolemen, S. Duman, Y. Dede, Y. Dolen, B. Kilic, Z. Kostereli, L. T. Yildirim, A. L. Dogan, D. Guc and E. U. Akkaya, Angew. Chem., Int. Ed., 2011, 50, 11937–11941 CrossRef CAS PubMed.
- K. Nagarajan, A. R. Mallia, V. S. Reddy and M. Hariharan, J. Phys. Chem. C, 2016, 120, 8443–8450 CrossRef CAS.
- K. Nagarajan, A. R. Mallia, K. Muraleedharan and M. Hariharan, Chem. Sci., 2017, 8, 1776–1782 RSC.
- S. Cekli, R. W. Winkel, E. Alarousu, O. F. Mohammed and K. S. Schanze, Chem. Sci., 2016, 7, 3621–3631 RSC.
- Z. An, C. Zheng, Y. Tao, R. Chen, H. Shi, T. Chen, Z. Wang, H. Li, R. Deng, X. Liu and W. Huang, Nat. Mater., 2015, 14, 685 CrossRef CAS PubMed.
- R. Gao, X. Mei, D. Yan, R. Liang and M. Wei, Nat. Commun., 2018, 9, 2798 CrossRef PubMed.
- N. N. Esemoto, Z. Yu, L. Wiratan, A. Satraitis and M. Ptaszek, Org. Lett., 2016, 18, 4590–4593 CrossRef CAS PubMed.
- L. Shi, B. Hernandez and M. Selke, J. Am. Chem. Soc., 2006, 128, 6278–6279 CrossRef CAS PubMed.
- L. Beverina, M. Crippa, M. Landenna, R. Ruffo, P. Salice, F. Silvestri, S. Versari, A. Villa, L. Ciaffoni, E. Collini, C. Ferrante, S. Bradamante, C. M. Mari, R. Bozio and G. A. Pagani, J. Am. Chem. Soc., 2008, 130, 1894–1902 CrossRef CAS PubMed.
- L. Huang, Z. Li, Y. Zhao, Y. Zhang, S. Wu, J. Zhao and G. Han, J. Am. Chem. Soc., 2016, 138, 14586–14591 CrossRef CAS PubMed.
- H. Zhao, W. Hu, H. Ma, R. Jiang, Y. Tang, Y. Ji, X. Lu, B. Hou, W. Deng and W. Huang, Adv. Funct. Mater., 2017, 27, 1702592 CrossRef.
Footnote |
| † Electronic supplementary information (ESI) available: Experimental details of synthesis, characterization and supplementary figures. See DOI: 10.1039/c9sc00264b |
| This journal is © The Royal Society of Chemistry 2019 |

