 Open Access Article
Creative Commons Attribution 3.0 Unported Licence
Enhancing singlet oxygen generation in semiconducting polymer nanoparticles through fluorescence resonance energy transfer for tumor treatment†
Jiayang
Jiang‡
a,
Yuanyuan
Qian‡
a,
Zihan
Xu
a,
Zhuang
Lv
a,
Peng
Tao
 a,
Mingjuan
Xie
a,
Shujuan
Liu
*a,
Wei
Huang
a,
Mingjuan
Xie
a,
Shujuan
Liu
*a,
Wei
Huang
 *ab and
Qiang
Zhao
 *a
*a
aKey Laboratory for Organic Electronics and Information Displays, Institute of Advanced Materials (IAM), Jiangsu National Synergetic Innovation Center for Advanced Materials (SICAM), Nanjing University of Posts and Telecommunications (NUPT), Nanjing 210023, P. R. China. E-mail: iamsjliu@njupt.edu.cn; iamqzhao@njupt.edu.cn
bShaanxi Institute of Flexible Electronics (SIFE), Northwestern Polytechnical University (NPU), Xi'an 710072, Shaanxi, China. E-mail: provost@nwpu.edu.cn
First published on 11th April 2019
Abstract
Photosensitizers (PSs) are of particular importance for efficient photodynamic therapy (PDT). Challenges for PSs simultaneously possessing strong light-absorbing ability, high 1O2 generation by effective intersystem crossing from the singlet to the triplet state, good water-solubility and excellent photostability still exist. Reported here are a new kind of dual-emissive semiconducting polymer nanoparticles (SPNs) containing fluorescent BODIPY derivatives and near-infrared (NIR) phosphorescent iridium(III) complexes. In the SPNs, the BODIPY units serve as the energy donors in the fluorescence resonance energy transfer (FRET) process for enhancing the light absorption of the SPNs. The NIR emissive iridium(III) complexes are chosen as the energy acceptors and efficient photosensitizers. The ionized semiconducting polymers can easily self-assemble to form hydrophilic nanoparticles and homogeneously disperse in aqueous solution. Meanwhile, the conjugated backbone of SPNs provides effective shielding for the two luminophores from photobleaching. Thus, an excellent overall performance of the SPN-based PSs has been realized and the high 1O2 yield (0.97) resulting from the synergistic effect of BODIPY units and iridium(III) complexes through the FRET process is among the best reported for PSs. In addition, owing to the phosphorescence quenching of iridium(III) complexes caused by 3O2, the SPNs can also be utilized for O2 mapping in vitro and in vivo, which assists in the evaluation of the PDT process and provides important instructions in early-stage cancer diagnosis.
Introduction
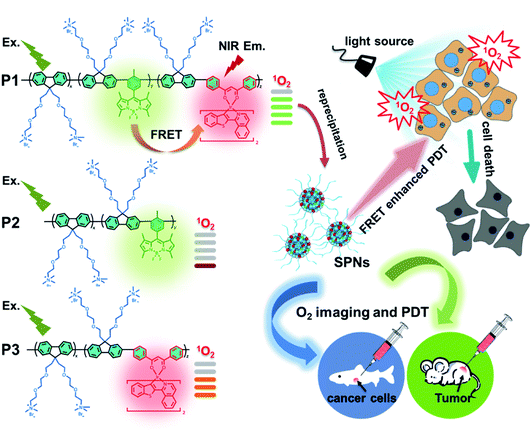
Photodynamic therapy (PDT) with high optical precision has attracted tremendous attention as an emerging clinical modality for treating cancers, which brings little damage to normal tissues, no wound surface, and negligible long-term sequelae or immune attack.1,2 During the PDT process, photosensitizers (PSs), which convert 3O2 to 1O2 or other reactive oxygen species (ROS) under light irradiation, play a crucial role in the irreversible cytotoxic process to cancer cells.3,4 In order to achieve effective PDT, high 1O2 production via an effective intersystem crossing (ISC) from the singlet (S1) to the triplet state (T1), intense light absorption, good photostability and water-solubility should be required for PSs. Currently, PSs are mainly based on organic dyes and phosphorescent transition-metal complexes (PTMCs), however, few of these PSs can simultaneously meet the above requirements. For PSs based on organic dyes, such as BODIPY, fluorescein and methylene blue, they have strong light absorption, but usually cannot achieve highly efficient 1O2 generation because of their weak ISC from S1 to T1.5–7 In addition, their photostability is usually poor for long-time PDT treatment. PTMCs are among the most promising candidates for PSs, owing to their high 1O2 quantum yield and excellent photostability.8 However, suffering from the spin-forbidden triplet transition, light absorption in visible regions of PTMCs is usually not strong enough for highly efficient PDT. Moreover, the rigid structures of these PSs are usually hydrophobic, which will induce aggregation in physiological environments and lead to a remarkable reduction of their luminescence intensity and 1O2 generation. Therefore, it still remains the challenge to develop photosensitizers with excellent overall performance.To address the above-mentioned issues, herein, we proposed an effective strategy of light-harvesting fluorescence resonance energy transfer (FRET) to design excellent photosensitizers based on semiconducting polymer nanoparticles (SPNs) to amplify the PDT efficiency. To demonstrate the effectiveness of this strategy, BODIPY units and iridium(III) complexes were simultaneously introduced into the backbone of cationic polyfluorene. Among them, BODIPY units served as the energy donors with a high extinction coefficient in the FRET process for enhancing the light absorption of the SPN-based PSs.9,10 The NIR emissive iridium(III) complexes with a suitable triplet energy level were chosen as the energy acceptors and photosensitizers in SPNs, which can easily transfer the energy to the ground state of O2 and lead to a high 1O2 quantum yield. Moreover, the ionized side chains of the polyfluorene backbone endowed the semiconducting polymers with the capability to form hydrophilic nanoparticles through self-assembly and homogeneously disperse in aqueous solution for further applications. Meanwhile, the conjugated backbone of SPNs provided an efficient shielding effect for the two luminophores from photobleaching, improving the photostability.11 Attributed to the rational structural design, together with the synergistic effect of BODIPY units and iridium(III) complexes through a highly efficient FRET process, a high 1O2 quantum yield (0.97) of SPNs has been achieved, which is among the best reported for PSs. In addition, owing to the phosphorescence quenching of iridium(III) complexes caused by oxygen through the energy transfer process, the SPNs could also be used for O2 mapping in vitro and in vivo, which assisted in the evaluation of the PDT process and provided important guidance in early-stage cancer diagnosis.12
Results and discussion
Design, synthesis and characterization of SPNs
As shown in Scheme 1, we rationally designed and synthesized polyfluorene-based dual-emissive SPNs containing BODIPY units and NIR emissive iridium(III) complexes by the Suzuki coupling reaction. The large π skeleton constructed iridium(III) complex monomers (M1) were prepared using a two-step process (see ESI†). Meanwhile, the green-emitting BODIPY monomers (M2) were prepared according to the literature report.13 The synthesis of semiconducting polymers is illustrated in Scheme S1.† The polymers were precipitated in the mixture of methanol and H2O (v/v = 10![[thin space (1/6-em)]](https://www.rsc.org/images/entities/char_2009.gif) :
:![[thin space (1/6-em)]](https://www.rsc.org/images/entities/char_2009.gif) 1), and then treated by Soxhlet extraction for 3 days. After quaternization with trimethylamine, P1 was obtained. The ionized side chain of P1 improved the water-solubility, avoiding luminescence quenching caused by aggregation. In addition, P2 and P3 were also prepared according to the same procedure for comparison. As seen in Table S1,† the real contents of M1 and M2 units in SPNs estimated by 1H NMR spectra were 10.1% and 4.8%, respectively, which were lower than those in feeding ratio probably because of the reaction activity and steric hindrance. The weight-average molecular mass (Mw) of P1, P2 and P3 was 27
1), and then treated by Soxhlet extraction for 3 days. After quaternization with trimethylamine, P1 was obtained. The ionized side chain of P1 improved the water-solubility, avoiding luminescence quenching caused by aggregation. In addition, P2 and P3 were also prepared according to the same procedure for comparison. As seen in Table S1,† the real contents of M1 and M2 units in SPNs estimated by 1H NMR spectra were 10.1% and 4.8%, respectively, which were lower than those in feeding ratio probably because of the reaction activity and steric hindrance. The weight-average molecular mass (Mw) of P1, P2 and P3 was 27![[thin space (1/6-em)]](https://www.rsc.org/images/entities/char_2009.gif) 300, 11
300, 11![[thin space (1/6-em)]](https://www.rsc.org/images/entities/char_2009.gif) 800 and 15
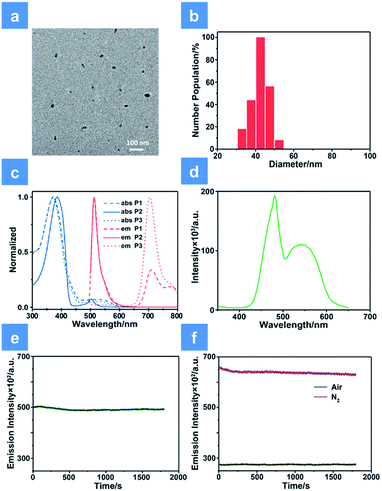
800 and 15![[thin space (1/6-em)]](https://www.rsc.org/images/entities/char_2009.gif) 500 with polydispersity indexes (PDI) of 1.26, 1.67 and 1.10, respectively. The SPNs were constructed under ultrasound treatment in water and a small fraction of large-sized particles were removed via a 0.22 μm membrane. As shown in Fig. 1a, transmission electron microscopy (TEM) revealed the uniform morphology of P1-based SPNs. Additionally, dynamic light scattering (DLS) showed the hydrodynamic diameter of SPNs to be approximately 40 nm (Fig. 1b) in phosphate buffered solution (PBS). The ζ-potential of SPNs in deionized water is 36.8 mV. The suitable size and charged surface suggested that the nanoparticles could be well dispersed in aqueous solution.
500 with polydispersity indexes (PDI) of 1.26, 1.67 and 1.10, respectively. The SPNs were constructed under ultrasound treatment in water and a small fraction of large-sized particles were removed via a 0.22 μm membrane. As shown in Fig. 1a, transmission electron microscopy (TEM) revealed the uniform morphology of P1-based SPNs. Additionally, dynamic light scattering (DLS) showed the hydrodynamic diameter of SPNs to be approximately 40 nm (Fig. 1b) in phosphate buffered solution (PBS). The ζ-potential of SPNs in deionized water is 36.8 mV. The suitable size and charged surface suggested that the nanoparticles could be well dispersed in aqueous solution.
Photophysical properties of SPNs
The ultraviolet-visible absorption and photoluminescence (PL) spectra of all monomers and SPNs have been studied (Fig. 1 and S1†). As shown in Fig. 1c, an intense absorption band between 300 and 440 nm is observed for P1, P2 and P3. This band corresponds to the π–π* transitions of conjugated backbones. A sharp absorption band of P2 appears between 480 and 520 nm, which is assigned to the characteristic S0–S1 transition of M2 units. By contrast, the relatively wide and weak absorption between 460 and 580 nm of P3 is attributed to the metal-to-ligand charge transfer (MLCT) transition of M1 units. For the absorption of P1, the broad band in the range from 490 to 600 nm is attributed to the overlap between the MLCT absorption of M1 units and characteristic transition of M2 units. Then, the PL spectrum of SPNs has been investigated upon excitation at 488 nm. From the spectrum we can see that P2 has a strong emission peak centered at 515 nm, which originates from the emission of M2 units. P3 exhibits a broad near-infrared emission in the range of 650–800 nm with a quantum yield of 0.13, which is attributed to the phosphorescence emission of M1. As expected, P1 displays two emission peaks from both M1 and M2 units and the quantum yield between 650 and 800 nm is 0.11. The NIR emission of iridium(III) complexes could enhance the penetration depth, reduce the tissue scattering and be far less likely to damage the healthy tissue.14Moreover, as seen from Fig. S1,† the emission of M2 (500–570 nm) has a good overlap with the absorption of M1 (490–600 nm). This result indicates that M1 and M2 are capable of forming an efficient FRET pair. To validate the energy transfer between M1 and M2, the excitation spectrum of P1 monitored at 704 nm is acquired (Fig. 1d). The sharp signal around 480 nm is assigned to the excitation of M2 units and the broad peak from 500–600 nm belongs to the M1 units. This spectral result demonstrates that BODIPY units have given assistance to the excitation process and is beneficial to efficient energy transfer. In order to calculate the energy transfer efficiency, the luminescence lifetime measurement (monitored between 500 and 550 nm) of P1 and P2 has been conducted. The lifetimes of M2 units in P1 and P2 have been summarized in Table S1.† The efficiency of energy transfer between M1 and M2 in P1 was calculated to be 51% according to the following eqn (1):15
 | (1) |
In addition, anti-photobleaching ability is an important factor for biomedical applications. We evaluated the photostability of P1 in aqueous solution under irradiation of a 488 nm laser for 30 min (Fig. 1e and f). As the time increased, the two emission bands of P1 remained over 90% of the initial intensity. This result demonstrates that the photostability of BODIPY units has been improved owing to the shielding effect of the conjugated backbone.11
1O2 generation by SPNs
The difference of 1O2 generation ability in aqueous solution among P1, P2 and P3 is discussed as follows. The monitoring of 1O2 generation was carried out via the 9,10-anthracenediylbis(methylene) malonic acid (ABDA) assay.16 From Fig. S2† we can see that the order of the absorption quenching rate was P1 > P3 > Ru(II)(bpy)32+ > P2, suggesting that P1 is the best photoactivatable 1O2 producer among the SPNs. Then, Ru(II)(bpy)32+ (ΦΔ = 0.41 in water) was utilized as the reference for calculating the 1O2 yield of SPNs, which was obtained by using the absorbance change (ΔA) of ABDA within 9 min according to eqn (2):17 | (2) |
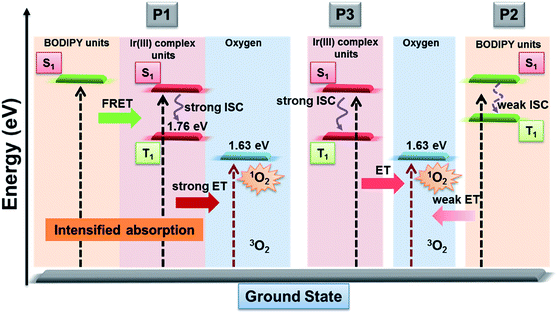
As is known that 1O2 generation depends on the energy transfer between the energy donor and acceptor, the difference in energy levels between the triplet state of iridium(III) complex units and the excited state of molecular oxygen largely determines the final 1O2 yield.18 According to the PL spectrum of SPNs, the triplet energy of iridium(III) complexes (1.76 eV) in P3 matches well with the energy of the excited state of molecular oxygen (1.63 eV), leading to a high 1O2 yield (0.78) of P3. In contrast, P2 without iridium(III) complexes shows a relatively low 1O2 yield (0.12), because BODIPY derivatives without electron donors or heavy atoms cannot possess efficient intersystem crossing between S1 and T1, which results in the low 1O2 generation.6 By contrast, the FRET of P1 can enhance the light absorption ability as well as giving rise to the highest 1O2 generation yield (0.97), which will improve the cancer-killing efficiency during PDT (Scheme 2).9
Luminescence response to oxygen in aqueous solution
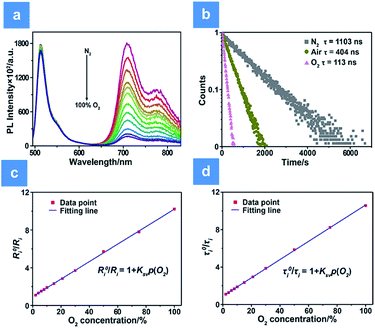
The oxygen sensing experiments of P1 have been conducted in PBS at the concentration of 70 μg mL−1. The relationship between PL intensity and O2 contents is shown in Fig. 2a. Under 488 nm excitation, the PL intensity at 515 nm of P1 remains unchanged at different O2 contents. In contrast, the NIR signal of P1 collected at 704 nm increases dramatically along with the decrease of O2 content. As a result, efficient ratiometric luminescence O2 sensing of the SPNs has been realized based on the two luminophores. And the large wavelength difference (∼200 nm) between the emission of M1 and M2 in P1 is beneficial for two intensity-based non-interfering O2 sensing. To quantitatively evaluate the capability of P1 for oxygen detection, the Stern–Volmer equation (eqn (3)) is defined as follows:19 | (3) |
 | (4) |
Additionally, measurement of phosphorescence lifetime is another reliable method for quantitative oxygen sensing. By using eqn (3), lifetime-based analysis of oxygen content has also been realized. As seen in Fig. 2b, the emission lifetime at 704 nm changes from 1.10 μs to 0.11 μs in pure nitrogen or pure oxygen, respectively. The remarkable lifetime variation and the linear relationship between lifetime and O2 content shown in Fig. 2d ensure accuracy and sensitivity in lifetime-based oxygen detection.
Ratiometric luminescence and lifetime imaging of oxygen in cells
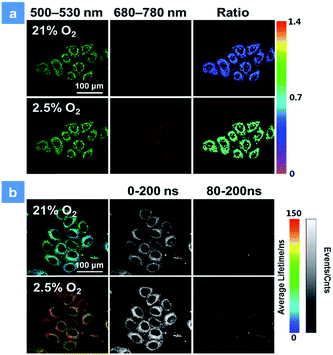
The good water-solubility and high oxygen-response sensitivity have indicated the promising potential of P1 for mapping oxygen in biological systems. The cytotoxicity of P1 is a vital factor to be concerned for biosensing and bioimaging. The cytotoxicity evaluation of P1 was carried out based on the 3-(4,5-dimethyl-2-thiazolyl)-2,5-diphenyl-2H-tetrazolium bromide (MTT) assay. As shown in Fig. S3,† over 90% of the cells were viable after incubation with P1 for 24 h in darkness, indicating the low cytotoxicity of P1 in biological systems. Next, the biodegradability of P1 was studied in vitro as well.3c,d,10e Myeloperoxidase (MPO) is a widely distributed peroxidase enzyme in immune cells. The reaction of MPO and H2O2 can generate hypochlorous acid, which can destroy proteins and even cell organelles. Upon adding with the mixture of MPO and H2O2, the absorption of P1 remained the same for 48 h (Fig. S4†), indicating that P1 could not be broken down by MPO. This result proves that P1 is beneficial for the long-time monitoring of oxygen mapping. Before confocal laser scanning microscopy (CLSM) imaging, the cells were incubated with 50 μg mL−1P1 for 4 h at the oxygen contents of 21% and 2.5%. In Fig. 3, CLSM images of cells were acquired under 488 nm irradiation. With the decrease of the oxygen level from 21% to 2.5%, the signal from BODIPY units (500–550 nm, green channel) remains unchanged, while that from iridium(III) complex units (680–780 nm, red channel) shows a remarkable enhancement. Moreover, as shown in Fig. 3a, ratiometric luminescence oxygen sensing in cells has also been confirmed by the evident change of ratio values (I704nm/I515nm) of P1, which demonstrates its sensitive intracellular oxygen detection ability.21 Furthermore, the long emission lifetime of P1 has been utilized for time-resolved luminescence imaging, which includes phosphorescence lifetime imaging (PLIM) and time-gated lifetime imaging (TGLI). According to PLIM images displayed in Fig. 3b, the lifetime of P1 under normoxia conditions (70 ns) is shorter than that under hypoxia conditions (110 ns), which is consistent with the results in solution. Then, TGLI was conducted for highlighting the advantages of the long-lived phosphorescence of P1 in Fig. 3b. After setting a time delay of 80 ns, the lifetime signal can still be observed clearly. Because of the oxygen induced quenching, the signal in hypoxia was stronger than that in normoxia. According to these results acquired via TGLI techniques, the signal-to-noise ratio in sensing intracellular O2 can be evidently elevated by eliminating the background interference in complicated environments.22P1-mediated PDT
Next, the PDT effect evaluation of P1 was studied. To capture the 1O2 generated by P1 in cells, 2,7-dichlorofluorescin diacetate (DCFH-DA) was chosen as an intracellular singlet oxygen indicator.23 After incubation with P1 and DCFH-DA for 4 h, HeLa cells treated under different conditions were monitored by CLSM. The emission signal collected from DCF between 500 and 550 nm is shown in Fig. S5.† In contrast to the cells treated in darkness, those treated under xenon lamp irradiation display bright fluorescence of DCF, illustrating that the abundant 1O2 has been produced by P1. Before PDT, the photoinduced cytotoxicity of P1 has been analyzed in HeLa cells via the MTT assay. As shown in Fig. S6,† the death cell population increases along with both extended minutes and increased dosage of SPNs, which confirms the efficient PDT of P1. For further demonstrating the PDT effect of P1, the annexin V-FITC/PI kit has been applied in this experiment for observing the apoptosis state of cells.24 As seen in the images of Fig. S7a and b,† the signal of annexin FTIC/PI cannot be observed in blank or dark groups, indicating that P1 has low toxicity without light irradiation. Moreover, compared to the cells treated with the ROS cleaner N-acetyl-L-cysteine (NAC) (Fig. S7c†), the non-NAC-added group exhibits bright green fluorescence of DCF (Fig. S7d†), furtherly demonstrating that the destructive 1O2 has been generated for killing HeLa cells.Oxygen-related PDT evaluation in vivo
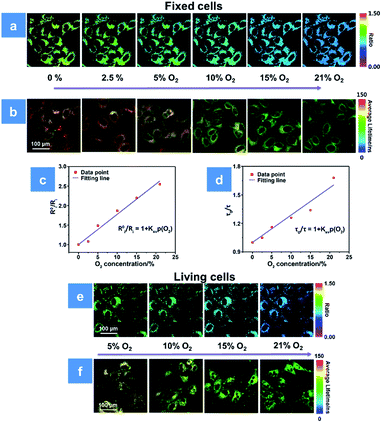
So far, the significantly hypoxic microenvironment has been demonstrated as a common feature inside solid tumors.25 Real-time O2 monitoring in the tumor environment can help to predict the PDT efficiency and give suggestions for subsequent treatment. Before in vivo experiments, the 1O2 yield influenced by O2 content is investigated firstly in solution. The mixture of P1 and ABDA was bubbled with different contents of O2. After irradiation by a low-powered 475 ± 20 nm xenon lamp for 1 min, the absorbance of ABDA at 400 nm decreased, which indicated the increase in singlet oxygen concentration. The results of the 1O2 generation rate under different conditions have been presented in Fig. S8.† By using eqn (2), the light induced 1O2 yields at different O2 levels of 5, 10, 15 and 21% are calculated to be 20, 35, 65 and 97%, respectively. The positive relationship between the O2 content and 1O2 yield directly demonstrates that O2 plays a significant role in PDT.For further evaluating the PDT process with P1, we combined the ratiometric luminescence and lifetime imaging techniques to determine the intracellular oxygen concentration of living cells. The fixed cells are selected for simulating the biological environment beforehand, because the O2 content is supposed to be the same inside and outside the fixed cells, which ensures the reliability of the results. As seen in Fig. 4a, after incubation with P1 for 2 h, the fixed HeLa cells were cultured at the extracellular O2 contents of 0, 2.5, 5, 10, 15 and 21%. The intensity ratio (I704 nm/I515 nm) reveals a decreasing trend upon increasing O2 content, and the calibration curve has been fitted according to eqn (3). Then, the real O2 content in living cells is determined in terms of the calibration curve and shown in Fig. 4c. When the O2 content outside the living cells is 5%, P1 in cells exhibits an intensity ratio of 0.87 and the real O2 content is calculated to be 4%. As the O2 content increases to 21%, the ratio value decreases to 0.51 and the real O2 content is calculated to be 16% (Fig. 4e). Photoluminescence lifetime imaging is another effective tool for real O2 content assessment. Similarly, as shown in Fig. 4b, the PLIM-based calibration curve has been fitted in terms of the luminescence lifetime distributions of P1 in fixed cells at various O2 contents. And according to the calibration curve in Fig. 4d, the real O2 content in living cells has been calculated to be 5% and 21% at the extracellular O2 contents of 4% and 18%, respectively (Fig. 4f). We found that the real O2 concentration calculated by both ratiometric imaging and PLIM is lower than that outside the cells, which is caused by the oxygen consumption of cellular activity (Tables S2 and S3†). Thus, the ratiometric luminescence and lifetime imaging techniques provide high sensitivity and signal-to-noise ratio for real oxygen content detection in cells. Making full use of the real-time O2 imaging ability of P1, the subsequent PDT assessment can be realized.
The time series model of CLSM has been utilized to track and distinguish the apoptosis and death of cells after different treatments. As shown in Fig. S9 and S10,† the fluorescence of annexin V-FITC/PI cannot be observed in the blank or dark group during 4 h, which is in line with the above results shown in Fig. S8a and b.† In contrast, the fluorescence signal of annexin V-FITC appears obviously 1 h after irradiation, indicating the early apoptosis of HeLa cells. Then, the apoptotic signal collected from PI dyes in the cell nucleus can be observed 2 h after irradiation (Fig. S11†), demonstrating the death process of HeLa cells. By contrast, the cell-killing ability becomes less effective due to the lack of oxygen as the 1O2 source (Fig. S12†). Therefore, the highly efficient PDT of P1 has been confirmed by qualitative CLSM analysis. For better understanding the PDT ability of P1, the quantitative analysis of P1-induced apoptosis has been studied via flow cytometry analysis (Fig. S13†). The population statistics of apoptosis cells treated with P1-induced PDT is determined to be 58.5% (Fig. S13d†). In contrast, just a few cells died in the control group (Fig. S13a–c†). In addition, the proportion of apoptotic HeLa cells increases as the exposure time extends (Fig. S13e–h†), which is in line with the MTT results shown in Fig. S6b.† More importantly, the oxygen-dependent apoptotic effect is also investigated (Fig. S13i–l†). A notable growth in the number of apoptotic cells is observed with increasing O2 content. These results point out that the content of O2 greatly impacts the PDT efficiency and provides effective instructions for in vivo experiments.
Anticancer studies in xenograft zebrafish
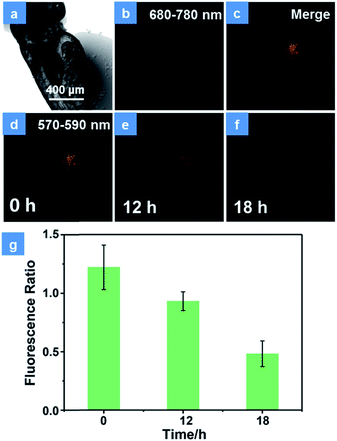
Encouraged by the excellent PDT performance of P1in vitro, the in vivo treatment has been assessed using HeLa cells xenograft zebrafish. Firstly, the PDT effect in transfected HeLa cells was studied. As shown in Fig. S14,† the HeLa cells have been transfected with the DsRed fluorescent protein expression vector according to operating instructions. In order to demonstrate the photostability of fluorescent protein during the PDT process, the cells were exposed to a 475 nm xenon lamp for 15 min. The emission of fluorescent protein observed using an inverted fluorescence microscope displays no significant decline (Fig. S14a†), which is proved to have good photostability in the PDT process. After incubation with P1 for 4 h, the cells were divided into two groups. There is no obvious difference in the population of cells between the control group (Fig. S14b†) and the dark group (Fig. S14c†), revealing the low dark toxicity of P1. In contrast, under irradiation by a xenon lamp for 15 min, the emission of fluorescent protein decreased 4 h later (Fig. S14d†). This is because the high levels of 1O2 induced by P1 can damage the DNA, cleave the protein and then give rise to the cell apoptosis and necrosis.26 These results suggest that P1 is an effective tool for cell inhibition. For the purpose of simulating a cancer cell growth environment, the zebrafish xenograft model has been used to evaluate the PDT effects of P1. HeLa cells were firstly xenotransplanted into the yolk sac of 3 day zebrafish for 12 h and then treated with P1 for 4 h via in situ injection inside the cell cluster before CLSM imaging. The emission intensity of fluorescence protein in cancer cells was monitored for assessing the cell survival state. As expected, the control group displays almost no intensity change of cancer fluorescence, which indicates good biocompatibility and low toxicity in darkness (Fig. S15†). Then, representative images of xenotransplanted zebrafish injected with P1 (100 μg mL−1) and exposed under 15 min irradiation by a xenon lamp are depicted in Fig. 5. The NIR phosphorescence emission (680–780 nm) of P1 has a good overlap with the cancer fluorescence (570–590 nm) (Fig. 5b–d), which guarantees the maximized PDT effect for cancer cells. Consistent with the results in vitro, the number of emissive cells significantly decreased during 18 h (Fig. 5d-f). The reduced fluorescence intensity of cancer cells has been recorded in Fig. 5g. As the time increased, the cancer cells gradually died and the ratio of the intensity in cancer cells between 570 and 590 nm to that between 680 and 780 nm decreased, which proves the excellent cancer inhibition ability of P1 in zebrafish.Anticancer studies in mice models
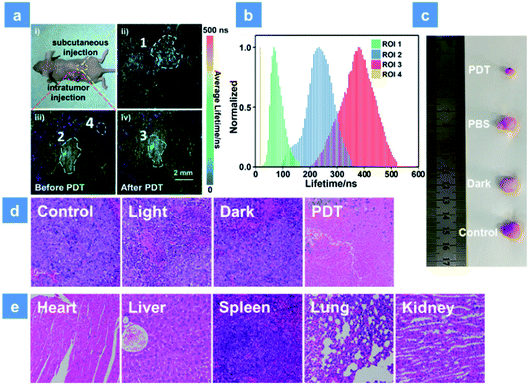
For further simulating a human body environment, PDT in the tumor-bearing mice has been studied. As shown in Fig. 6a, 3 mg kg−1 SPNs were injected beneath the skin (yellow area) or into the tumor tissue (red area). Then, the lifetime distribution curves of P1 were acquired by using the in vivo PLIM system (Fig. 6b). The lifetime of P1 in ROI 1 was about 68 ns. In contrast, the lifetime lengthened to be about 233 ns in ROI 2 of the tumor, which was caused by the hypoxia feature of tumor tissues. Moreover, after 15 min irradiation by a xenon lamp, the phosphorescence lifetime of ROI 3 became 380 ns and was longer than that without treatment (ROI 2). This result suggests that the sensitive O2 detection ability of P1 is beneficial for real-time monitoring of O2 consumption during PDT. In addition, the lifetime collected from the background area (ROI 4) was only 20 ns and could be obviously distinguished from the signal of P1. This suggests that the high signal to noise ratio in O2 mapping utilizing P1 can provide a reliable visual feedback during PDT treatment. Then, PDT in tumor-bearing mice has been studied. To distinguish the roles played by the light source, oxygen and photosensitizer, all mice were randomly assigned to four groups (Fig. S16†). The tumor volume and mice body weight were continuously recorded every two days and used to evaluate the treatment effect for two weeks (Fig. S17a and b†). The PBS-injected group shows an approximately 8-fold larger tumor volume than the initial state and the only xenon lamp irradiated group (475 nm, 200 mW cm−2, 15 min) exhibits a similar tumor growth rate, suggesting that the light irradiation has no evident impact on tumor growth. Then, P1 was intratumorally injected into the tumor tissue followed by different treatments after 2 h injection in PDT and dark groups. P1-treated mice in the dark group exhibit a similar tumor growth to the control group owing to the low photocytotoxicity of P1. Then, the excellent tumor inhibition ability of P1 is found in the PDT group under 475 nm irradiation, and the experimental photographs of tumors excised from representative mice visually reveal the tumor size after treatment with P1 (Fig. 6c). These results confirm the excellent PDT effect for killing tumors induced by P1. Histology results of the mice injected with P1 have been studied as well (Fig. 6d). By utilizing the hematoxylin and eosin (H&E) staining method, tumor tissue necrosis is clearly observed. Compared with other control groups, a high degree of tumor cell necrosis and apoptosis is found in the PDT group, evidencing tumor cell death after P1-mediated PDT. For the purpose of evaluating the in vivo biosafety of P1, the body weight of mice in different groups was recorded and the metabolic time of P1 in solid tumors was studied using small animal in vivo imaging systems (Fig. S17b and c†). After P1 was injected into the tumor intratumorally, the phosphorescence signal of P1 (680 ± 20 nm) was collected. The maximum intensity of P1 can be observed in tumor tissues 2 h after the injection. Within 36 h, the signal gradually decreased, demonstrating that P1 could also be excreted rapidly from the tumor. In addition, the body weight of mice in all groups slightly fluctuates after 14 days treatment, indicating that P1 has no significant side effects on healthy mice (Fig. S17b†). Moreover, the histological examination of primary organs excised from P1-injected nude mice after 14 days PDT treatment has been performed by H&E as well. The photos of the stained mice organs were observed under microscopy (Fig. 6e). After two weeks PDT, no obvious necrosis or inflammatory response happened to the examined mice organs, confirming the favorable biocompatibility of P1in vivo.Conclusions
In summary, we have successfully utilized the FRET strategy to design dual-emissive semiconducting polymer nanoparticle-based photosensitizers containing BODIPY derivatives and near-infrared phosphorescent iridium(III) complexes for amplified 1O2 generation in PDT. In the SPNs, the BODIPY units served as the energy donors in the FRET process and enhanced the light absorption ability of the SPNs. The NIR emissive iridium(III) complexes were employed as the energy acceptors and photosensitizers, which have been demonstrated to provide the SPNs with high 1O2 quantum yield. In the meantime, the ionized semiconducting polymer can easily self-assemble to form nanoparticles homogeneously in water and the conjugated backbone has been demonstrated to offer effective shielding for the two luminophores from photobleaching. Due to the rational structural design, together with the FRET-based synergistic effect of the two luminophores in SPNs, a high 1O2 quantum yield (0.97) has been successfully achieved, which is among the best reported for PSs. In addition, taking advantage of the balanced process between the O2-related photophysical variation (PL intensity ratio or lifetime value) and 1O2 production, P1 has also been used as a multifunctional theranostic platform for image-guided PDT treatment in vitro and in vivo. All the results reveal that the SPNs integrating and amplifying the advantages of all the components successfully achieve high PDT efficiency as well as excellent O2 imaging capability. We believe that these results would inspire the development of more excellent SPN-based photosensitizers for cancer theranostics.Experimental section
The detailed information of materials, instruments, synthesis and characterization of SPNs, spectral tests, cell culture, cell xenotransplantation, in vitro/in vivo imaging and PDT experiments can be found in the ESI.†Animal models
All the nude mice and zebrafish were bought from the Comparative Medicine Centre of Yangzhou University and Model Animal Research Center of Nanjing University, respectively. All the animal experiments were conducted in line with the specifications of The National Regulation of China for Care and Use of Laboratory Animals and approved by the Jiangsu Administration of Experimental Animals.Conflicts of interest
The authors declare no competing financial interest.Acknowledgements
We acknowledge financial support from the National Funds for Distinguished Young Scientists (61825503), National Natural Science Foundation of China (51473078 and 21671108), National Program for Support of Top-Notch Young Professionals, Scientific and Technological Innovation Teams of Colleges and Universities in Jiangsu Province (TJ215006), the Open Research Fund of State Key Laboratory of Bioelectronics, Southeast University, Priority Academic Program Development of Jiangsu Higher Education Institutions (YX03001) and Postgraduate Research & Practice Innovation Program of Jiangsu Province (KYLX15_0847).Notes and references
- (a) T. J. Dougherty, C. J. Gomer, B. W. Henderson, G. Jori, D. Kessel, M. Korbelik, J. Moan and Q. Peng, Eur. J. Cancer, 1991, 68, 1–9 Search PubMed; (b) D. W. Felsher, Nat. Rev. Cancer, 2003, 3, 375–380 CrossRef CAS PubMed.
- (a) P. Agostinis, K. Berg, K. A. Cengel, T. H. Foster, A. W. Girotti, S. O. Gollnick, S. M. Hahn, M. R. Hamblin, A. Juzeniene, D. Kessel, M. Korbelik, J. Moan, P. Mroz, D. Nowis, J. Piette, B. C. Wilson and J. Golab, Ca-Cancer J. Clin., 2011, 61, 250–281 CrossRef PubMed; (b) A. P. Castano, P. Mroz and M. R. Hamblin, Nat. Rev. Cancer, 2006, 6, 535–545 CrossRef CAS PubMed; (c) C. Iadecola, Nat. Rev. Neurosci., 2004, 5, 347–360 CrossRef CAS PubMed; (d) B. E. Sands, F. H. Anderson, C. N. Bernstein, W. Y. Chey, B. G. Feagan, R. N. Fedorak, M. A. Kamm, J. R. Korzenik, B. A. Lashner and J. E. Onken, N. Engl. J. Med., 2004, 350, 876–885 CrossRef CAS PubMed.
- (a) P. Carmeliet, Y. Dor, J. M. Herbert, D. Fukumura, K. Brusselmans, M. Dewerchin, M. Neeman, F. Bono, R. Abramovitch and P. Maxwell, Nature, 1998, 394, 485–490 CrossRef CAS PubMed; (b) G. L. Semenza, Science, 2007, 318, 62–64 CrossRef CAS PubMed; (c) Q. Q. Miao, C. Xie, X. Zhen, Y. Lyu, H. W. Duan, X. G. Liu, J. V. Jokerst and K. Y. Pu, Nat. Biotechnol., 2017, 35, 1102–1110 CAS; (d) Y. Y. Jiang and K. Y. Pu, Acc. Chem. Res., 2018, 51, 1840–1849 CrossRef CAS PubMed.
- M. C. Derosa and R. J. Crutchley, Coord. Chem. Rev., 2002, 233, 351–371 CrossRef.
- (a) D. Hu, L. Chen, Y. Qu, J. Peng, B. Chu, K. Shi, Y. Hao, L. Zhong, M. Wang and Z. Qian, Theranostics, 2018, 8, 1558–1567 CrossRef CAS PubMed; (b) H. Zhang, K. Liu, S. Li, X. Xin, S. Yuan, G. Ma and X. Yan, ACS Nano, 2018, 12, 8266–8276 CrossRef CAS PubMed; (c) Z. Dong, L. Feng, Y. Hao, M. Chen, M. Gao, Y. Chao, H. Zhao, W. Zhu, J. Liu and C. Liang, J. Am. Chem. Soc., 2018, 140, 2165–2178 CrossRef CAS PubMed.
- (a) J. Zou, Z. Yin, P. Wang, D. Chen, J. Shao, Q. Zhang, L. Sun, W. Huang and X. Dong, Chem. Sci., 2018, 9, 2188–2194 RSC; (b) Z. Ruan, Y. Zhao, P. Yuan, L. Liu, Y. Wang and L. Yan, J. Mater. Chem. B, 2018, 6, 753–762 RSC; (c) A. Cui, X. Peng, J. Fan, X. Chen, Y. Wu and B. Guo, J. Photochem. Photobiol., A, 2007, 186, 85–92 CrossRef CASD. Wang, J. Fan, X. Gao, B. Wang, S. Sun and X. Peng, J. Org. Chem., 2009, 74, 7675–7683 CrossRef CAS PubMed; (d) X. Li, X. H. Peng, B. D. Zheng, J. Tang, Y. Zhao, B. Y. Zheng, M. R. Ke and J. D. Huang, Chem. Sci., 2018, 9, 2098–2104 RSC; (e) S. M. Ji, J. Ge, D. Escudero, Z. Wang, J. Z. Zhao and D. Jacquemin, J. Org. Chem., 2015, 80, 5958–5963 CrossRef CAS PubMed.
- (a) J. Liu, P. Du, T. Liu, B. J. C. Wong, W. Wang, H. Ju and J. Lei, Biomaterials, 2019, 192, 179–188 CrossRef CAS PubMed; (b) M. Jiang, R. T. Kwok, X. Li, C. Gui, J. W. Lam, J. Qu and B. Z. Tang, J. Mater. Chem. B, 2018, 6, 2557–2565 RSC.
- (a) Z. Lv, H. J. Wei, Q. Li, X. L. Su, S. J. Liu, K. Y. Zhang, W. Lv, Q. Zhao, X. H. Li and W. Huang, Chem. Sci., 2018, 9, 502–512 RSC; (b) W. Lv, H. T. Xia, K. Y. Zhang, Z. J. Chen, S. J. Liu, W. Huang and Q. Zhao, Mater. Horiz., 2017, 4, 1185–1189 RSC; (c) W. Lv, Z. Zhang, K. Y. Zhang, H. R. Yang, S. J. Liu, A. Q. Xu, S. Guo, Q. Zhao and W. Huang, Angew. Chem., Int. Ed., 2016, 128, 10101–10105 CrossRef; (d) P. Tao, W. L. Li, J. Zhang, S. Guo, Q. Zhao, H. Wang, B. Wei, S. J. Liu, X. H. Zhou, Q. Yu, B. S. Xu and W. Huang, Adv. Funct. Mater., 2016, 26, 881–894 CrossRef CAS; (e) P. Tao, Y. B. Zhang, J. Wang, L. W. Wei, H. X. Li, X. L. Li, Q. Zhao, X. W. Zhang, S. J. Liu, H. Wang and W. Huang, J. Mater. Chem. C, 2017, 5, 9306–9314 RSC; (f) P. Tao, Y. Q. Miao, Y. B. Zhang, K. Wang, H. X. Li, L. Li, X. Li, T. Yang, Q. Zhao, H. Wang, S. J. Liu, X. H. Zhou, B. Xu and W. Huang, Org. Electron., 2017, 45, 293–301 CrossRef CAS; (g) P. Tao, Y. Q. Miao, H. Wang, B. Xu and Q. Zhao, Chem. Rec., 2018, 18 DOI:10.1002/tcr.201800139.
- (a) X. Zheng, L. Wang, S. Liu, W. Zhang, F. Liu and Z. Xie, Adv. Funct. Mater., 2018, 28, 1706507–1706518 CrossRef; (b) M. Li, S. Long, Y. Kang, L. Guo, J. Wang, J. Fan, J. Du and X. Peng, J. Am. Chem. Soc., 2018, 140, 15820–15826 CrossRef CAS PubMed; (c) K. Lu, C. He, N. Guo, C. Chan, K. Ni, R. R. Weichselbaum and W. Lin, J. Am. Chem. Soc., 2016, 138, 12502–12510 CrossRef CAS PubMed; (d) K. Lu, C. He and W. Lin, J. Am. Chem. Soc., 2015, 137, 7600–7603 CrossRef CAS PubMed; (e) S. Guo, L. Ma, J. Zhao, B. Küçüköz, A. Karatay, M. Hayvali, H. G. Yaglioglu and A. Elmali, Chem. Sci., 2014, 5, 489–500 RSC.
- (a) J. C. Li and K. Y. Pu, Chem. Soc. Rev., 2019, 48, 38–71 RSC; (b) X. Zhen, C. Xie, Y. Y. Jiang, X. Z. Ai, B. G. Xing and K. Y. Pu, Nano Lett., 2018, 18, 1498–1505 CrossRef CAS PubMed; (c) H. J. Zhu, Y. Fang, Q. Q. Miao, X. Y. Qi, D. Ding, P. Chen and K. Y. Pu, ACS Nano, 2017, 11, 8998–9009 CrossRef CAS PubMed; (d) X. Zhen, C. Xie and K. Y. Pu, Angew. Chem., Int. Ed., 2018, 130, 4002–4006 CrossRef; (e) Y. Lyu, J. F. Zeng, Y. Y. Jiang, X. Zhen, T. Wang, S. S. Qiu, X. Lou, M. Y. Gao and K. Y. Pu, ACS Nano, 2018, 12, 1801–1810 CrossRef CAS PubMed.
- (a) C. Zhu, L. Liu, Q. Yang, F. Lv and S. Wang, Chem. Rev., 2012, 112, 4687–4735 CrossRef CAS PubMed; (b) Z. Xiang, L. Zhu, L. Qi, L. Yan, Y. Xue, D. Wang, J. F. Chen and L. Dai, Chem. Mater., 2016, 28, 8651–8658 CrossRef CAS; (c) A. Giovannitti, C. B. Nielsen, J. Rivnay, M. Kirkus, D. J. Harkin, A. J. P. White, H. Sirringhaus, G. G. Malliaras and I. McCulloch, Adv. Funct. Mater., 2016, 26, 514–523 CrossRef CAS; (d) H. Zhu, Y. Fang, Q. Miao, X. Qi, D. Ding, P. Chen and K. Pu, ACS Nano, 2017, 11, 8998–9009 CrossRef CAS PubMed; (e) P. Li, L. Liu, H. Xiao, W. Zhang, L. Wang and B. Tang, J. Am. Chem. Soc., 2016, 138, 2893–2896 CrossRef CAS PubMed; (f) Y. Jiang and J. McNeill, Chem. Rev., 2017, 117, 838–859 CrossRef CAS PubMed.
- (a) Y. M. Wang, W. Liu and X. B. Yin, Chem. Sci., 2017, 8, 3891–3897 RSC; (b) X. Zheng, X. Wang, H. Mao, W. Wu, B. Liu and X. Jiang, Nat. Commun., 2015, 6, 5834 CrossRef CAS PubMed.
- Y. Rong, C. Wu, J. Yu, X. Zhang, F. Ye, M. Zeigler, M. E. Gallina, I. C. Wu, Y. Zhang and Y. H. Chan, ACS Nano, 2013, 7, 376–384 CrossRef CAS PubMed.
- (a) Y. Sun, M. Ding, X. Zeng, Y. Xiao, H. Wu, H. Zhou, B. Ding, C. Qu, W. Hou, A. Er-Bu, Y. Zhang, Z. Cheng and X. Hong, Chem. Sci., 2017, 8, 3489–3493 RSC; (b) Y. Sun, C. Qu, H. Chen, M. He, C. Tang, K. Shou, S. Hong, M. Yang, Y. Jiang, B. Ding, Y. Xiao, L. Xing, X. Hong and Z. Cheng, Chem. Sci., 2016, 7, 6203–6207 RSC; (c) S. Kesarkar, W. Mroz, M. Penconi, M. Pasini, S. Destri, M. Cazzaniga, D. Ceresoli, P. R. Mussini, C. Baldoli, U. Giovanella and A. Bossi, Angew. Chem., Int. Ed., 2016, 55, 2714–2718 CrossRef CAS PubMed.
- A. R. Clapp, I. L. Medintz, J. Matthew Mauro, B. R. Fisher, M. G. Bawendi and H. Mattoussi, J. Am. Chem. Soc., 2004, 126, 301–310 CrossRef CAS PubMed.
- B. A. Lindig, M. A. J. Rodgers and A. P. Schaap, J. Am. Chem. Soc., 1980, 94, 5590–5593 CrossRef.
- D. G. Fresnadillo, Y. Georgiadou, G. Orellana, A. M. Braun and E. Oliveros, Helv. Chim. Acta, 1996, 79, 1222–1238 CrossRef.
- (a) M. C. DeRosa and R. J. Crutchley, Coord. Chem. Rev., 2002, 233, 351–371 CrossRef; (b) C. Schweitzer and R. Schmidt, Chem. Rev., 2003, 103, 1685–1758 CrossRef CAS PubMed; (c) J. S. Nam, M. G. Kang, J. Kang, S. Y. Park, S. J. C. Lee, H. T. Kim, J. K. Seo, O. H. Kwon, M. H. Lim and H. W. Rhee, J. Am. Chem. Soc., 2016, 138, 10968–10977 CrossRef CAS PubMed.
- Z. Feng, P. Tao, L. Zou, P. Gao, Y. Liu, X. Liu, H. Wang, S. Liu, Q. Dong, J. Li, B. Xu, W. Huang, W. Y. Wong and Q. Zhao, ACS Appl. Mater. Interfaces, 2017, 9, 28319–28330 CrossRef CAS PubMed.
- C. Wu, B. Bull, K. Christensen and J. McNeill, Angew. Chem., Int. Ed., 2009, 48, 2741–2745 CrossRef CAS PubMed.
- (a) D. Cheng, Y. Pan, L. Wang, Z. Zeng, L. Yuan, X. Zhang and Y. T. Chang, J. Am. Chem. Soc., 2017, 139, 285–292 CrossRef CAS PubMed; (b) N. Makukhin, V. Tretyachenko, J. Moskovitz and J. Míšek, Angew. Chem., Int. Ed., 2016, 55, 12727–12730 CrossRef CAS PubMed; (c) L. Wu, I. C. Wu, C. C. DuFort, M. A. Carlson, X. Wu, L. Chen, C. T. Kuo, Y. Qin, J. Yu, S. R. Hingorani and D. T. Chiu, J. Am. Chem. Soc., 2017, 139, 6911–6918 CrossRef CAS PubMed; (d) Z. Chen, K. Y. Zhang, X. Tong, Y. Liu, C. Hu, S. T. T. Liu, Q. Yu, Q. Zhao and W. Huang, Adv. Funct. Mater., 2016, 26, 4386–4396 CrossRef CAS; (e) K. Y. Zhang, J. Zhang, Y. Liu, S. Liu, P. Zhang, Q. Zhao, Y. Tang and W. Huang, Chem. Sci., 2015, 6, 301–307 RSC.
- (a) J. Wang, J. Xue, Z. Yan, S. Zhang, J. Qiao and X. Zhang, Angew. Chem., Int. Ed., 2017, 56, 14928–14932 CrossRef CAS PubMed; (b) J. Yang, X. Zhen, B. Wang, X. Gao, Z. Ren, J. Wang, Y. Xie, J. Li, Q. Peng and K. Pu, Nat. Commun., 2018, 9, 840–848 CrossRef PubMed; (c) Q. Li, M. Zhou, M. Yang, Q. Yang, Z. Zhang and J. Shi, Nat. Commun., 2018, 9, 734–741 CrossRef PubMed; (d) Y. Ning, J. Tang, Y. W. Liu, J. Jing, Y. Sun and J. L. Zhang, Chem. Sci., 2018, 9, 3742–3753 RSC; (e) K. Vellaisamy, G. Li, C. N. Ko, H. J. Zhong, S. Fatima, H. Y. Kwan, C. Y. Wong, W. J. Kwong, W. Tan and C. H. Leung, Chem. Sci., 2018, 9, 1119–1125 RSC.
- L. Bourré, S. Thibaut, A. Briffaud, N. Rousset, S. Eléouet, Y. Lajat and T. Patrice, J. Photochem. Photobiol., B, 2002, 67, 23 CrossRef.
- Y. Ye, J. Liu, J. Xu, L. Sun, M. Chen and M. Lan, Toxicol. In Vitro, 2010, 24, 751–758 CrossRef CAS PubMed.
- (a) X. Zheng, H. Mao, D. Huo, W. Wu, B. Liu and X. Jiang, Nat. Biomed. Eng., 2017, 1, 0057 CrossRef; (b) Z. Zhou, J. Song, L. Nie and X. Chen, Chem. Soc. Rev., 2016, 45, 6597–6626 RSC.
- (a) B. B. Zhang, Y. Shimada, J. Kuroyanagi, N. Umemoto, Y. Nishimura and T. Tanaka, PLoS One, 2014, 9, 9 Search PubMed; (b) B. Zhang, Y. Shimada, J. Kuroyanagi, M. Ariyoshi, T. Nomoto, T. Shintou, N. Umemoto, Y. Nishimura, T. Miyazaki and T. Tanaka, Biomaterials, 2015, 52, 14–25 CrossRef CAS PubMed; (c) J. N. Silva, A. Galmiche, J. P. Tome, A. Boullier, M. G. Neves, E. M. Silva, J. C. Capiod, J. A. Cavaleiro, R. Santus, J. C. Maziere, P. Filipe and P. Morliere, Biochem. Pharmacol., 2010, 80, 1373–1385 CrossRef CAS PubMed.
Footnotes |
| † Electronic supplementary information (ESI) available: Details of general experimental information, NMR and MS spectra. See DOI: 10.1039/c8sc05501g |
| ‡ J. Y. Jiang and Y. Y. Qian contributed equally to this work. |
| This journal is © The Royal Society of Chemistry 2019 |

