
 Open Access Article
 This Open Access Article is licensed under a Creative Commons Attribution-Non Commercial 3.0 Unported Licence
In situ visualization of ozone in the brains of mice with depression phenotypes by using a new near-infrared fluorescence probe†
Ping
Li‡
,
Jijuan
Wang‡
,
Xin
Wang
,
Qi
Ding
,
Xiaoyi
Bai
,
Yandi
Zhang
,
Di
Su
,
Wei
Zhang
,
Wen
Zhang
and
Bo
Tang
 *
*
College of Chemistry, Chemical Engineering and Materials Science, Key Laboratory of Molecular and Nano Probes, Ministry of Education, Collaborative Innovation Center of Functionalized Probes for Chemical Imaging in Universities of Shandong, Institutes of Biomedical Sciences, Shandong Normal University, Jinan 250014, People's Republic of China. E-mail: tangb@sdnu.edu.cn
First published on 17th January 2019
Abstract
Ozone (O3), one of the reactive oxygen species (ROS), is deeply involved in diseases including depression. However, the lack of appropriate in situ detection methods suitable for the complex biological context of brain impedes uncovering the exact relationship between depression and changes in the O3 level. Therefore, we developed a near-infrared (NIR) fluorescent probe (ACy7) for the direct visualization of O3 in mice brains. The specific cycloaddition reaction between O3 and the terminal double bond of the butenyl group extends the conjugation of the “pre-” heptamethine cyanine system, which emits NIR fluorescence of heptamethine cyanine. This makes the ACy7 specific, highly sensitive and able to deeply penetrate tissue. Using ACy7, we found that under glutamate stimulation, the O3 content in PC12 cells was significantly higher than that in control cells. By imaging analysis on the brains of mice, we revealed for the first time that the levels of O3 in mice with depression phenotypes were markedly higher than that in control mice. Intriguingly, experimental results unravelled that excess O3 promoted high expression of the pro-inflammatory cytokine interleukin-8 (IL-8), which ultimately induced depression phenotypes. Our work demonstrates the pivotal role of elevated O3 in depression and provides a fresh entry point for exploring oxidative stress contributing to depression.
Introduction
Depression is a mental illness affecting people throughout the world, causing high mortality and disability rates.1 However, the aetiology of depression is still unclear. In recent years, the immunoinflammatory hypothesis of depression has received increasing attention. This hypothesis suggests that inflammatory mediators such as cytokines play an important role in the development of depression and that the immunoinflammatory reaction may be an essential cause of the poor efficacy of conventional antidepressant treatments.2,3As one of the reactive oxygen species (ROS), ozone (O3) has attracted widespread attention due to its key role in mental disorders,4–7 such as depression. Unfortunately, there are two different perspectives on the relationship between O3 and depression. Some researchers have shown that exogenous O3 stimulation induces depressive behaviors.8–11 Others have shown that ozonation in conjunction with autologous blood transfusion could be used as a new, fast acting antidepressant treatment.12 O3 is endogenously produced in the inflammation and antibacterial response of the immune system,13,14 which causes the production of cytokines, including the pro-inflammatory cytokine interleukin-8 (IL-8), amplifying the inflammatory cascade.15 So, we speculate that during depression, the level of endogenous O3 in the brain is increased, resulting in the overexpression of IL-8, which is the ultimate cause of depression. To confirm our hypothesis and clarify the role of O3 in depression, the development of appropriate in vivo detection methods to in situ visually monitor changes in O3 in brains of mice with depression phenotypes is of special note.
Fluorescent probes are characterized by high sensitivity, relatively simple preparation, and good biocompatibility, and therefore they have been used to observe target molecules in living organisms.16–20 In particular, optical imaging associated with the near-infrared (NIR) fluorescent probe has the advantages of being suitable for deep tissue penetration and low autofluorescence background, making this technique more applicable for in vivo detection.21 In recent years, fluorescent probes for monitoring O3 have been developed, but these probes are mostly used for detecting O3 at the environmental or the cellular level.22–26 Due to the complex biological environment in the brain and the blood–brain barrier, probes for measuring O3 in living brains have not been reported.
Thus, we designed and synthesized an “off–on” NIR small-molecule fluorescent probe (ACy7) for high sensitivity fluorescence imaging of O3 in the brains of mice with depression phenotypes. Our probe uses a Cy7-like molecule as the precursor of the fluorophore and 3-butenyl as the recognition group.26 O3 can undergo a specific cycloaddition reaction with the terminal olefin of the 3-butenyl moiety to convert ACy7 to the quinone derivative QCy7, extending the degree of conjugation. This reaction triggers emitting bright, NIR fluorescence of heptamethine cyanine (Scheme 1), allowing the specific and highly sensitive detection of O3. We first explored the applicability of ACy7 in macrophages and PC12 cells. Then, we applied ACy7 to the in situ fluorescence imaging of O3 in the brains of mice with depression phenotypes. In addition, we investigated the molecular mechanisms of depression associated with O3 regulation of IL-8 involvement.
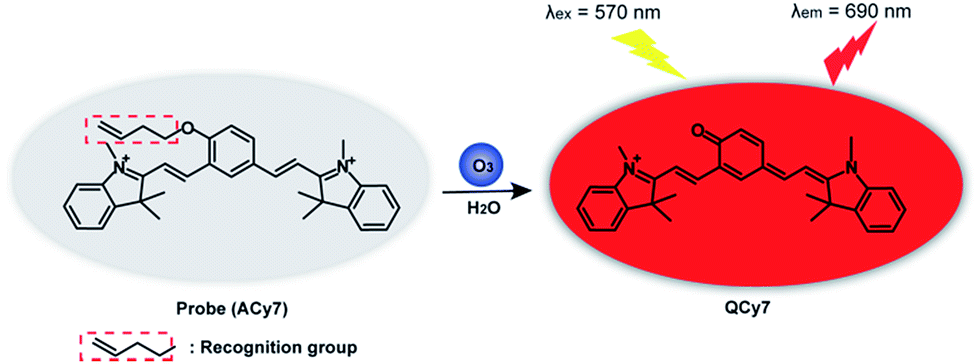 | ||
| Scheme 1 “Off–on” type NIR fluorescent probe ACy7 reaction with O3. | ||
Results and discussion
In vitro optical properties of ACy7 to O3
ACy7 was synthesized by a two-step reaction (Scheme S1, ESI†), purified by thin-layer chromatography and column chromatography, and then characterized by 1H NMR, 13C NMR and MS. To understand the effect of O3 on the photophysical properties of ACy7, we first measured the absorption spectra of the probe in the absence and presence of O3. As shown in Fig. S1a (ESI†), the absorption maximum of the probe was at approximately 420 nm in the absence of O3. When O3 was added to the system, the probe exhibited a new absorption band at approximately 570 nm, and the intensity of the absorption at 570 nm enhanced with increasing O3 concentration. Subsequently, we studied the fluorescence properties of QCy7. Fig. S1b (ESI†) shows that the maximum excitation and emission peaks of QCy7 are at 570 nm and 690 nm, respectively, with a large Stokes shift. We examined the fluorescence response of ACy7 to O3 and optimized the reaction conditions (Fig. S2–S5, ESI†). We measured the fluorescence emission intensities of ACy7 before and after the addition of O3 (Fig. 1A). The figure shows that when the reaction solution did not contain O3, the fluorescence emission of the probe at 690 nm was negligible. When O3 solution is added to the mixture, the fluorescence emission intensity of the probe at 690 nm is significantly enhanced, increasing by more than 80-fold. This indicates that the probe has a high signal to noise ratio. This result is consistent with the design of our probe, tuning fluorescence from “off” to “on” by extending the conjugation of the “pre-” heptamethine cyanine system. As depicted in Scheme S2 (ESI†), through a (3 + 2) cycloaddition reaction, the terminal olefin of probe 1 reacts with O3 to form molecular ozonide 2, which further generates aldehyde 3, HCHO and H2O2 in the aqueous solution. Then, aldehyde 3 undergoes β-elimination to produce CH2![[double bond, length as m-dash]](https://www.rsc.org/images/entities/char_e001.gif) CHCHO and compound 4. Phenate compound 4 undergoes electron rearrangement to form a fluorescent quinone derivative QCy7.27 This specific reaction mechanism can endow the probe with outstanding selective and sensitive response to O3.
CHCHO and compound 4. Phenate compound 4 undergoes electron rearrangement to form a fluorescent quinone derivative QCy7.27 This specific reaction mechanism can endow the probe with outstanding selective and sensitive response to O3.
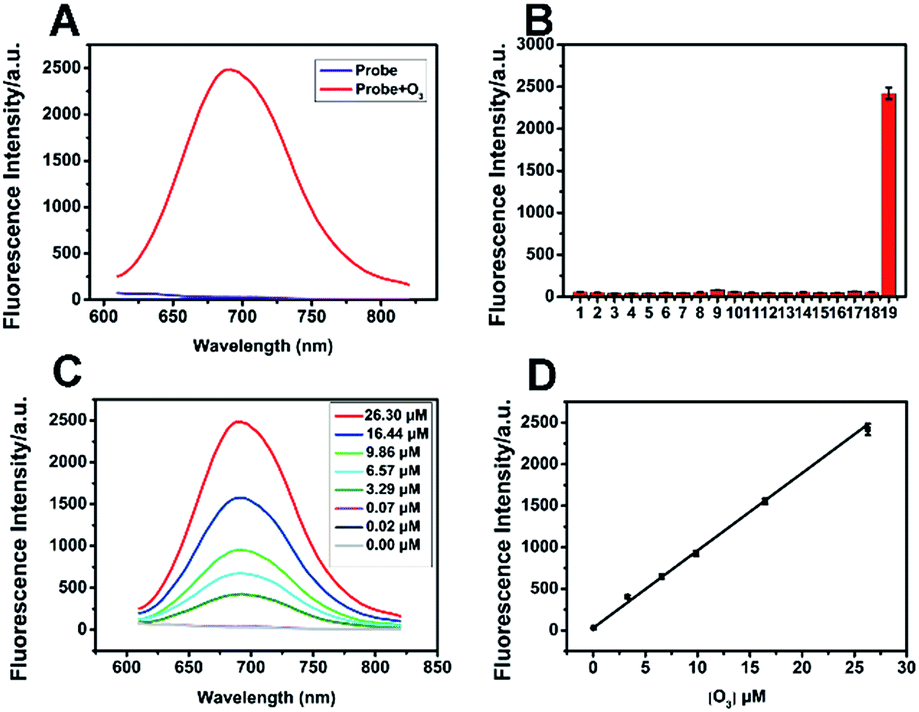 | ||
| Fig. 1 Fluorescence spectral properties of ACy7. (A) Fluorescence emission spectrum of 10 μM ACy7 before and after reaction with O3 (26.30 μM). (B) Fluorescence responses of 10 μM ACy7 to some biological interfering substances. (C) Fluorescence response of 10 μM ACy7 after the addition of serial concentrations of O3. (D) A linear relationship between the fluorescence emission intensity of the ACy7 solution and the O3 concentration (λex/λem = 570/690 nm). Error bars are ±SD (n = 3). (Interfering substances: (1) blank, (2) H2O2 (0.1 mM), (3) O2˙− (125 μM), (4) 1O2 (50 μM), (5) ·OH (50 μM), (6) t-BuOOH (30 μM), (7) NaClO (50 μM), (8) NO (50 μM), (9) ONOO− (6 μM), (10) GSH (5 mM), (11) vitamin C (0.3 mM), (12) Na+ (0.5 mM), (13) K+ (0.5 mM), (14) Zn2+ (0.5 mM), (15) Ca2+ (0.5 mM), (16) Na2S2O3 (0.5 mM), (17) Fe3+ (0.5 mM), (18) citric acid (50 μM), and (19) O3 (26.30 μM).) | ||
Under the optimal conditions, we added various concentrations of O3 to the ACy7 reaction solution. As expected, the fluorescence emission intensity of QCy7 at 690 nm gradually increased with increasing O3 concentration. The O3 concentration and fluorescence emission intensity (ΔF) showed good linearity in the range of 0.02–26.30 μM (Fig. 1C and D). The linear correlation equation was ΔF = 93.23[O3] (μM) + 29.50 (R2 = 0.9964). The limit of detection (3S/k, in which S is the standard deviation of the blank measurements, n = 11, and k was the slope of the linear equation) was 10 nM. To further confirm that the turn-on fluorescence is based on the probe reacting with ozone, we carried out RP-HPLC analysis combined with MS to detect the conversion of ACy7 before and after reaction with an equimolar amount of ozone (Fig. S6, ESI†). The results of HPLC-MS verify that 33% of ACy7 transformed to QCy7 with an equimolar amount of ozone, causing a notable increase in fluorescence. These findings demonstrate that the probe can measure low concentration of O3 with high sensitivity.
To evaluate the specificity of the reaction, we examined some interfering substances that are common in the biological environment, such as ROS, reactive nitrogen species (RNS), bio-antioxidants and metal ions, under the same conditions (Fig. 1B). When these interfering substances were added, the fluorescence intensity of the probe was extremely low. The addition of O3 brought about obvious fluorescence enhancement, indicating that the probe has good specificity and can specifically detect O3. In addition, we examined the reaction kinetics and photostability of ACy7 to O3. As shown in Fig. S7 (ESI†), when O3 was added, the emission intensity of the ACy7 solution reached a plateau at approximately 40 min, and the intensity remained basically unchanged over the next 25 min. The fluorescence emission intensity of ACy7 basically did not change with time. Therefore, ACy7 can quickly react with O3 and has good photostability. These results indicate that the probe (ACy7) has desirable properties, including emission located in the NIR region, high sensitivity and high specificity. Therefore, ACy7 is expected to be suitable for in situ detection and bioimaging of O3 in biological samples.
Endogenous O3 imaging in live cells with ACy7
The above studies on the optical properties of ACy7 in vitro proved that ACy7 was well suited for the detection of O3 under simulated physiological conditions. To test the feasibility of the probe ACy7 as an imaging reagent, its potential toxicity to cells was evaluated using a standard MTT [3-(4,5-dimethylthiazol-2-yl)-2,5-diphenyl-tetrazolium bromide] assay (Fig. S8, ESI†).28 The results showed that ACy7 had an IC50 value of 0.322 mM, meaning low cytotoxicity.Then, the applicability of ACy7 for the imaging of RAW 264.7 macrophages was investigated. We firstly tried to visualize exogenous O3 within living macrophages. Macrophages were incubated directly in 5 μM of O3 solution, and then fluorescence brightness was examined (Fig. 2B). The images showed that the fluorescence intensity within these cells was 1.5-fold stronger than that of the control (Fig. 2A). This result indicates that the probe ACy7 can be used for imaging of exogenous O3 at the cellular level. To investigate whether the probe ACy7 is capable of monitoring endogenous O3 in cells, phorbol 12-myristate 13-acetate (PMA) was used to stimulate macrophages for producing O3 (Fig. 2C).29 As expected, intracellular fluorescence intensity was 1.9-fold higher than that of the control. To verify that the enhancement of fluorescence intensity was caused by an increase in O3, we added ethyl 4-vinylbenzoate to eliminate intracellular O3 (Fig. 2D).15 We observed that the fluorescence intensity of these cells was significantly reduced (by 1.9-fold) compared to that of the PMA-stimulated group. This experiment further proves that the endogenous O3 produced in the cells undergoes a cleavage reaction with ACy7 to release QCy7 to emit light instead of reacting with other ROS. The above results demonstrate that our probe has sufficient membrane permeability and can be used for imaging changes in intracellular O3.
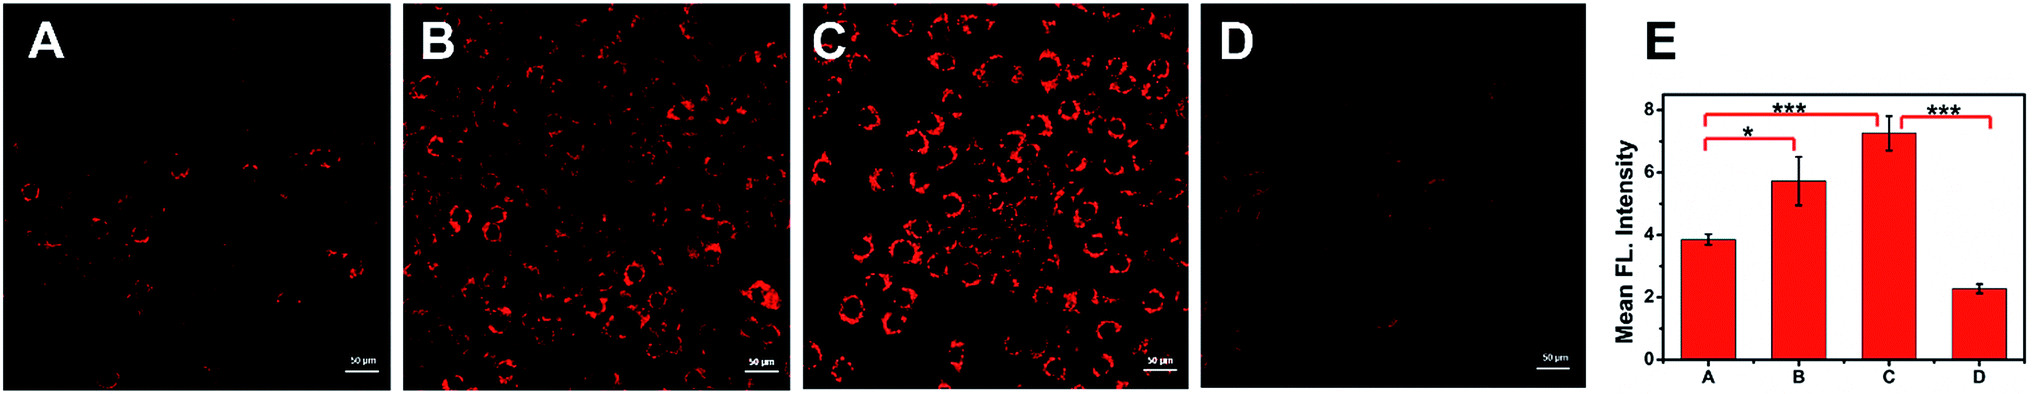 | ||
| Fig. 2 Laser confocal imaging of O3 in RAW 264.7 macrophages. (A) Cells incubated with 10 μM ACy7 for 15 min at 37 °C. (B) ACy7-loaded cells incubated with 5 μM O3 for 10 min. (C) Cells incubated with PMA (100 ng mL−1) for 20 min and then incubated with 10 μM ACy7 at 37 °C for 15 min. (D) Cells incubated with PMA (100 ng mL−1) for 20 min, and then with 0.05 mM ethyl 4-vinylbenzoate for 30 min, and then with 10 μM ACy7 for 15 min. (E) The data output of the graphs in (A)–(D). All cells were washed 3 times with 0.01 M PBS prior to imaging. Emissions from 640 nm to 740 nm were collected using a 561 nm laser. The values are the mean ± s.d. for n = 3, *p < 0.05, and ***p < 0.001. | ||
To investigate the feasibility of ACy7 in nerve cell applications, we visualized the changes in endogenous O3 levels inside PC12 cells. Considering that glutamate can cause nerve cells to undergo oxidative stress with concomitant ROS production,30 high concentration glutamate was added to the cells (Fig. 3C). We found that the fluorescence signal within these cells significantly increased (8.6-fold) compared with that of the control. This result indicates that excess of O3 is produced in glutamate-stimulated cells, and ACy7 can be used to image endogenous O3 in PC12 cells. To further demonstrate that the change in the fluorescence intensity was caused by O3, we pre-incubated the cells with ethyl 4-vinylbenzoate (Fig. 3B and D), and found that the fluorescence intensity of these cells was greatly lower than that of the control. The imaging of PC12 cells showed that ACy7 can effectively distinguish between control cells and cells under oxidative stress. Overall, the results of the cell imaging experiments demonstrate that ACy7 has the advantages of membrane permeability and biocompatibility.
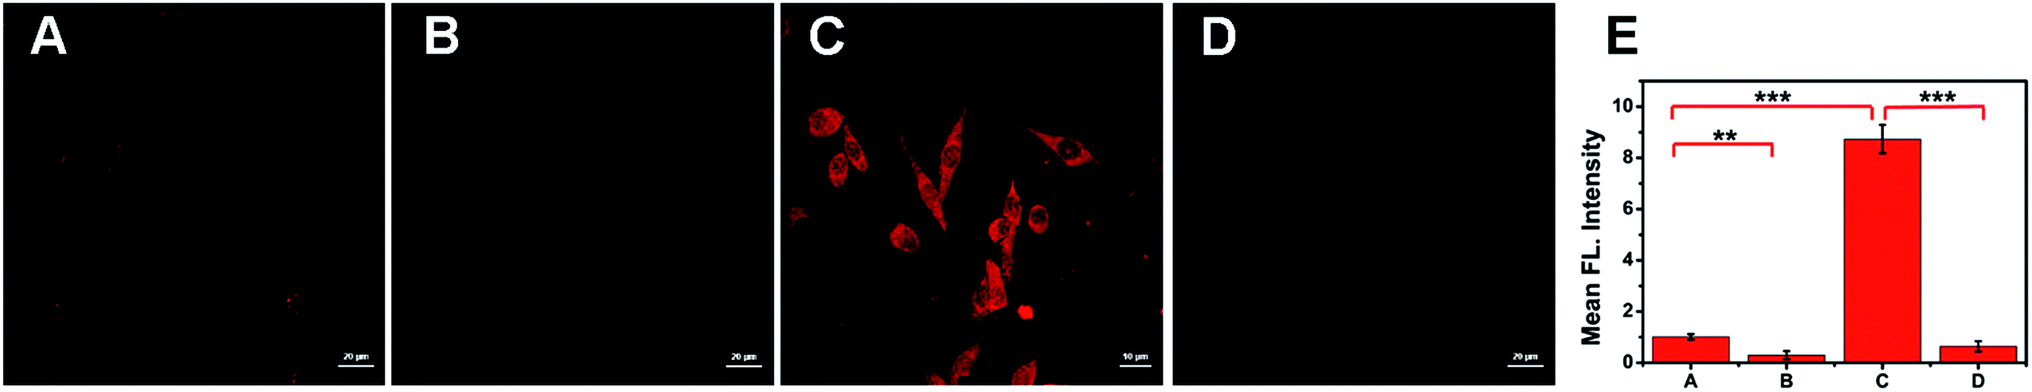 | ||
| Fig. 3 Laser confocal imaging of O3 in PC12 cells. (A) Cells incubated with 10 μM ACy7 for 15 min at 37 °C. (B) Cells incubated with 0.05 mM ethyl 4-vinylbenzoate and then treated according to (A). (C) Cells incubated with 10 mM glutamate for 17 h and then incubated with ACy7 for 15 min at 37 °C. (D) Cells incubated with 10 mM glutamate for 17 h, and then with 0.05 mM ethyl 4-vinylbenzoate for 30 min and then with ACy7 for 15 min. (E) The data output of the graphs in (A)–(D). All cells were washed 3 times with 0.01 M PBS prior to imaging. Emissions from 640 nm to 740 nm were collected using a 561 nm laser. The values are the mean ± s.d. for n = 3, **p < 0.01, and ***p < 0.001. | ||
Fluorescence imaging of O3 in the brains of mice with depression phenotypes
Since the emission of the probe is in the NIR region, it causes only slight light damage to biological samples. In particular, it could penetrate deeper tissue with weak background fluorescence interference. These merits make ACy7 well suited for in vivo imaging experiments. Therefore, we explored in vivo fluorescence imaging of O3 with the probe. First, we established a chronic unpredictable mild stress (CUMS) mouse model (Fig. S9–S11, ESI†).31 After successful modelling, both control mice and mice with depression-like behaviors were injected intraperitoneally with 0.15 mg kg−1 of ACy7. Subsequently, in situ fluorescence imaging of the brain of each mouse was performed using an IVIS Lumina III (Fig. 4). The results showed that the brain of mice with depression-like behaviors exhibited brighter fluorescence, about 1.8-times higher than that of control mice. This indicates that the O3 contents in the brains of mice with depression-like behaviors are higher than the levels in control mice. Overall, based on the superior in vivo fluorescence imaging performance of the probe ACy7, we revealed the elevation of O3 in the brains of mice with depression phenotypes for the first time.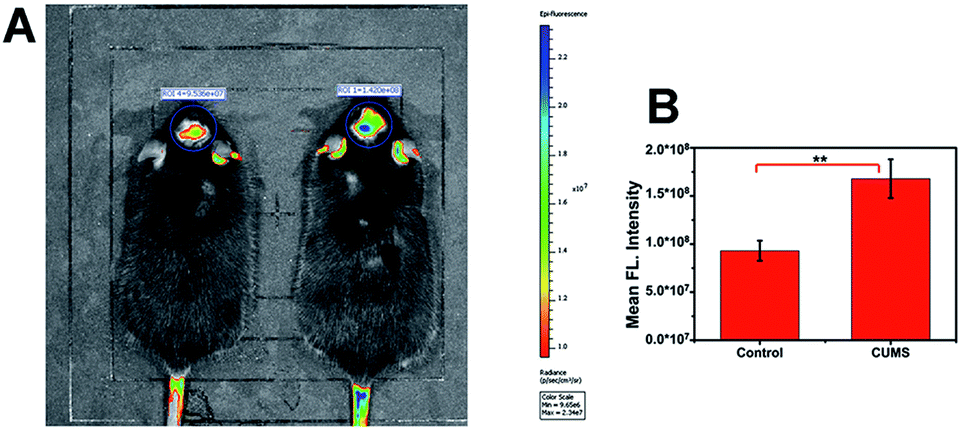 | ||
| Fig. 4 Visual imaging of O3 in the brains of mice. (A) Fluorescence imaging (pseudocolor) of ACy7 in control mice (left) and mice with depression-like behaviors (right). (B) The output of the fluorescence intensity in image (A). The excitation wavelength filter is 570 nm, and the emission wavelength filter is 690 nm. The values are the mean ± s.d. for n = 3, and **p < 0.01. | ||
Study of the signalling pathway of O3-induced depression phenotypes in mice
We have demonstrated that the level of O3 in the brain of mice is positively correlated with depression phenotypes. We wondered why the flux of O3 is associated with depression-like behaviors. Studies have shown that O3 as one of the important ROS is deeply involved in inflammation.32–34 In the meantime, there is a close relationship between inflammation and depression.35,36 So, we speculated that IL-8 served as a bridge between O3 and depression. To verify this assumption, we analysed IL-8 in the brains of mice with depression-like behaviors. First, we used lipopolysaccharide (LPS) to establish a mouse model of acute inflammation-induced depression (Fig. S12–S14, ESI†),37 and divided the mice into a control group, an LPS group and an LPS + Lim group. We next injected 0.15 mg kg−1 of ACy7 into the mice by intraperitoneal injection and performed in situ fluorescence imaging of the mouse brains using an IVIS Lumina III (Fig. 5A and B). The images showed higher fluorescence intensity in the brain tissue of the mice with depression-like behaviors, 1.9-fold greater than that of the control group. Similar results were also obtained by utilizing sulfo-ACy7 (Fig. S15, ESI†). This means the obvious increase in O3 in depression caused by inflammation.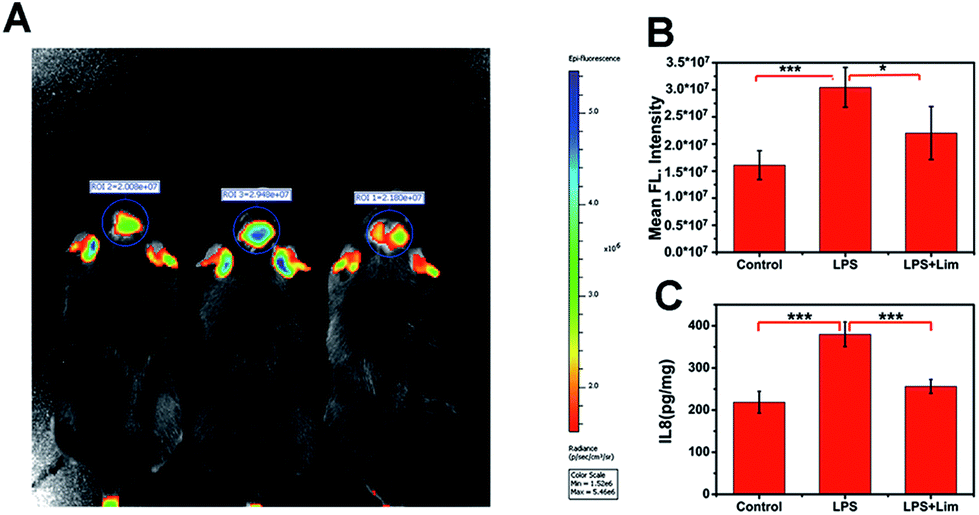 | ||
| Fig. 5 Imaging of O3 and detection of IL-8 contents in the brains of mice. (A) Fluorescence imaging (pseudocolor) in the control (left), LPS (middle), and LPS + Lim (right) groups. (B) The output of fluorescence intensity in image (A). (C) Analysis of the IL-8 content in mouse brain tissue by ELISA. The excitation wavelength filter is 570 nm, and the emission wavelength filter is 690 nm. The values are the mean ± s.d. for n = 5, *p < 0.05 and ***p < 0.001. | ||
Next, to investigate how IL-8 levels changed in the brains of mice, we measured the IL-8 content in the brain of each mouse by enzyme linked immunosorbent assay (ELISA) (Fig. 5C). The results showed that the IL-8 contents in mice with depression-like behaviors were 1.7-fold greater than those in the control group, indicating that the increase in IL-8 in the brains of mice with depression-like behaviors is caused by inflammation. To prove that the changes in the IL-8 contents in the brains of mice are ascribed to O3, we used limonene (Lim, a natural O3 scavenger) to establish an LPS + Lim mouse model.38 The LPS + Lim group of mice was given 50 mg kg−1 Lim by gavage 7 days in advance. Next, we injected 0.83 mg kg−1 LPS into the mice by intraperitoneal injection to induce depression-like behaviors. The images showed that the fluorescence in the brain of each mouse in the LPS + Lim group was significantly lower than those of the mice in the LPS group. These results indicated that the O3 in the brains of the LPS + Lim mice was decreased. At the same time, by using DepressionScan (Clever Sys. Inc.), we found that the depression-like behaviors of mice in the LPS + Lim group was relieved. Importantly, compared with mice in the LPS group, the IL-8 level in the brains of the LPS + Lim group was also significantly decreased, which is consistent with our previous speculation. Altogether, the above results fully demonstrate that over-generated O3 in the mouse brain promotes the production of excess IL-8, which ultimately induces depression.
Conclusions
In summary, we developed a new NIR fluorescent probe (ACy7) to trace O3 in the brain tissue of small animals. ACy7 was proved to be extremely sensitive and selective to O3, as well as having good biocompatibility. Relying on these merits, we successfully applied this probe in the visualization of over produced O3 in PC12 cells under oxidative stress induced by glutamate. Importantly, we realized the in situ imaging observation of O3 in the brain tissue of mice with depression phenotypes for the first time, revealing the elevated O3 levels in mice with depression phenotypes. Furthermore, we uncovered that O3 in the brain induces mouse depression by producing excessive IL-8. This work provides strong direct evidence of a positive correlation between O3 and depression and will help to more fully elucidate the pathogenesis of depression associated with oxidative stress.Live subject statement
All the animal experiments were carried out in accordance with the relevant laws and guidelines issued by the Ethical Committee of Shandong University and were in agreement with the guidelines of the Institutional Animal Care and Use Committee.Conflicts of interest
There are no conflicts to declare.Acknowledgements
This work was supported by the National Natural Science Foundation of China (21535004, 91753111, 21675105, 21475079, and 21390411) and the Key Research and Development Program of Shandong Province (2018YFJH0502), the National Major Scientific and Technological Special Project for “Significant New Drugs Development” (2017ZX09301030004) and the Natural Science Foundation of Shandong Province of China (ZR2017ZC0225).Notes and references
- E. J. Nestler, M. Barrot, R. J. DiLeone, A. J. Eisch, S. J. Gold and L. M. Monteggia, Neuron, 2002, 34, 13–25 CrossRef CAS PubMed.
- Y. Dowlati, N. Herrmann, W. Swardfager, H. Liu, L. Sham, E. K. Reim and K. L. Lanctôt, Biol. Psychiatry, 2010, 67, 446–457 CrossRef CAS PubMed.
- G. I. Papakostas, R. C. Shelton, G. Kinrys, M. E. Henry, B. R. Bakow, S. H. Lipkin, B. Pi, L. Thurmond and J. A. Bilello, Mol. Psychiatry, 2011, 18, 332 CrossRef PubMed.
- B. C. Dickinson and C. J. Chang, Nat. Chem. Biol., 2011, 7, 504 CrossRef CAS PubMed.
- A. Oudin, D. O. Åström, P. Asplund, S. Steingrimsson, Z. Szabo and H. K. Carlsen, Environ. Health, 2018, 17, 4 CrossRef PubMed.
- J. C. Chen and J. M. Samet, Eur. J. Epidemiol., 2017, 32, 943–946 CrossRef PubMed.
- T. Biermann, N. Stilianakis, S. Bleich, N. Thurauf, J. Kornhuber and U. Reulbach, Med. Hypotheses, 2009, 72, 338–341 CrossRef CAS PubMed.
- M. L. Mokoena, B. H. Harvey, F. Viljoen, S. M. Ellis and C. B. Brink, Psychopharmacology, 2015, 232, 2921–2938 CrossRef CAS PubMed.
- Y. H. Lim, H. Kim, J. H. Kim, S. Bae, H. Y. Park and Y. C. Hong, Environ. Health Perspect., 2012, 120, 1023–1028 CrossRef CAS PubMed.
- M. L. Mokoena, B. H. Harvey, D. W. Oliver and C. B. Brink, Metab. Brain Dis., 2010, 25, 125–133 CrossRef CAS PubMed.
- M. Szyszkowicz, International Journal of Occupational Medicine and Environmental Health, 2007, 20, 241–245 Search PubMed.
- L. Coppola, C. Luongo, A. Pastore, C. Masciello, R. R. Parascandola, L. Mastrolorenzo, A. Grassia, A. Coppola, M. De Biase, B. Lettieri and G. Gombos, Int. J. Geriatr. Psychopharmacol., 2010, 25, 208–213 CrossRef PubMed.
- P. Wentworth Jr, J. Nieva, C. Takeuchi, R. Galve, A. D. Wentworth, R. B. Dilley, G. A. DeLaria, A. Saven, B. M. Babior, K. D. Janda, A. Eschenmoser and R. A. Lerner, Science, 2003, 302, 1053–1056 CrossRef PubMed.
- P. Wentworth Jr, J. E. McDunn, A. D. Wentworth, C. Takeuchi, J. Nieva, T. Jones, C. Bautista, J. M. Ruedi, A. Gutierrez, K. D. Janda, B. M. Babior, A. Eschenmoser and R. A. Lerner, Science, 2002, 298, 2195–2199 CrossRef PubMed.
- B. M. Babior, C. Takeuchi, J. Ruedi, A. Gutierrez and P. Wentworth Jr, Proc. Natl. Acad. Sci. U. S. A., 2003, 100, 3031–3034 CrossRef CAS PubMed.
- Z. Hu, G. Yang, J. Hu, H. Wang, P. Eriksson, R. Zhang, Z. Zhang and K. Uvdal, Sens. Actuators, B, 2018, 264, 419–425 CrossRef CAS.
- C. Yuan, B. Liu, F. Liu, M.-Y. Han and Z. Zhang, Anal. Chem., 2014, 86, 1123–1130 CrossRef CAS PubMed.
- X. Sun and T. D. James, J. Am. Chem. Soc., 2018, 140, 2348–2354 CrossRef CAS PubMed.
- X. Chen, X. Tian, I. Shin and J. Yoon, Chem. Soc. Rev., 2011, 40, 4783–4804 RSC.
- J. Li and Y. Lu, J. Am. Chem. Soc., 2000, 122, 10466–10467 CrossRef CAS.
- N. Karton-Lifshin, L. Albertazzi, M. Bendikov, P. S. Baran and D. Shabat, J. Am. Chem. Soc., 2012, 134, 20412–20420 CrossRef CAS PubMed.
- H. Nie, W. Yang, M. Yang, J. Jing and X. Zhang, Dyes Pigm., 2016, 127, 67–72 CrossRef CAS.
- Y. Nam, B. S. Kim and I. Shin, Chem. Commun., 2016, 52, 1128–1130 RSC.
- Y. Zhang, W. Shi, X. Li and H. Ma, Sci. Rep., 2013, 3, 2830 CrossRef PubMed.
- K. Xu, S. Sun, J. Li, L. Li, M. Qiang and B. Tang, Chem. Commun., 2012, 48, 684–686 RSC.
- A. L. Garner, C. M. St Croix, B. R. Pitt, G. D. Leikauf, S. Ando and K. Koide, Nat. Chem., 2010, 2, 422 CrossRef CAS.
- N. Kartson-Lifshin, E. Segal, L. Omer, M. Portnoy, R. Satchi-Fainaro and D. Shabat, J. Am. Chem. Soc., 2011, 133, 10960–10965 CrossRef PubMed.
- H. Xiao, P. Li, W. Zhang and B. Tang, Chem. Sci., 2016, 7, 1588–1593 RSC.
- A. J. Kettle, B. M. Clark and C. C. Winterbourn, J. Biol. Chem., 2004, 279, 18521–18525 CrossRef CAS PubMed.
- M. Stanciu, Y. Wang, R. Kentor, N. Burke, S. Watkins, G. Kress, I. Reynolds, E. Klann, M. R. Angiolieri, J. W. Johnson and D. B. DeFranco, J. Biol. Chem., 2000, 275, 12200–12206 CrossRef CAS PubMed.
- W. Su, Y. Zhang, Y. Chen, H. Gong, Y. Lian, W. Peng, Y. Liu, Y. Wang, Z. You, S. Feng, Y. Zong, G. Lu and C. Jiang, Behav. Brain Res., 2017, 322, 1–8 CrossRef CAS PubMed.
- J. Bosson, S. Barath, J. Pourazar, A. F. Behndig, T. Sandstrom, A. Blomberg and E. Adelroth, Eur. Respir. J., 2008, 31, 1234–1240 CrossRef CAS PubMed.
- A. Torossian, S. Ruehlmann, L. Eberhart, M. Middeke, H. Wulf and A. Bauhofer, Inflammation Res., 2004, 53(suppl. 2), S122–S125 CAS.
- B. Kilburg-Basnyat, S. W. Reece, M. J. Crouch, B. Luo, A. D. Boone, M. Yaeger, M. Hodge, C. Psaltis, J. L. Hannan, J. Manke, M. L. Armstrong, N. Reisdorph, R. M. Tighe, S. R. Shaikh and K. M. Gowdy, Toxicol. Sci., 2018, 163, 466–477 CrossRef CAS PubMed.
- R. Krishnadas and J. Cavanagh, J. Neurol., Neurosurg. Psychiatry, 2012, 83, 495–502 CrossRef PubMed.
- A. H. Miller and C. L. Raison, Nat. Rev. Immunol., 2016, 16, 22–34 CrossRef CAS PubMed.
- Z. Wang, Q. Zhang, L. Yuan, S. Wang, L. Liu, X. Yang, G. Li and D. Liu, Behav. Brain Res., 2014, 274, 282–290 CrossRef CAS PubMed.
- E. Keinan, A. Alt, G. Amir, L. Bentur, H. Bibi and D. Shoseyov, Bioorg. Med. Chem., 2005, 13, 557–562 CrossRef CAS PubMed.
Footnotes |
| † Electronic supplementary information (ESI) available: Synthetic procedures, cells/mice culture, and additional figures. See DOI: 10.1039/c8sc04891f |
| ‡ These authors contributed equally to this work. |
| This journal is © The Royal Society of Chemistry 2019 |