 Open Access Article
In situ imaging of aminopeptidase N activity in hepatocellular carcinoma: a migration model for tumour using an activatable two-photon NIR fluorescent probe†
Haidong
Li
 a,
Yueqing
Li
b,
Qichao
Yao
a,
Jiangli
Fan
a,
Yueqing
Li
b,
Qichao
Yao
a,
Jiangli
Fan
 *ad,
Wen
Sun
ad,
Saran
Long
ad,
Kun
Shao
ad,
Jianjun
Du
 a,
Jingyun
Wang
 cd and
Xiaojun
Peng
 ad
ad
aState Key Laboratory of Fine Chemicals, Dalian University of Technology, 2 Linggong Road, Dalian 116024, P. R. China. E-mail: fanjl@dlut.edu.cn
bSchool of Pharmaceutical Science and Technology, Dalian University of Technology, 2 Linggong Road, Hi-tech Zone, Dalian 116024, P. R. China
cSchool of Life Science and Biotechnology, Dalian University of Technology, 2 Linggong Road, Dalian 116024, P. R. China
dResearch Institute of Dalian University of Technology in Shenzhen, Gaoxin South fourth Road, Nanshan District, Shenzhen 518057, China
First published on 27th November 2018
Abstract
CD13/aminopeptidase N (APN), which is a zinc-dependent metalloproteinase, plays a vital role in the growth, migration, angiogenesis, and metastasis of tumours. Thus, in situ molecular imaging of endogenous APN levels is considerably significant for investigating APN and its different functions. In this study, a novel two-photon near-infrared (NIR) fluorescence probe DCM-APN was prepared to perform in vitro and in vivo tracking of APN. The N-terminal alanyl site of probe DCM-APN was accurately hydrolysed to the amino group, thereby liberating strong fluorescence owing to the recovery of the Intramolecular Charge Transfer (ICT) effect. By considering its outstanding selectivity, ultra-sensitivity (DL 0.25 ng mL−1) and favourable biocompatibility, the probe DCM-APN was used to distinguish between normal cells (LO2 cells) and cancer cells (HepG-2 and B16/BL6 cells). Furthermore, migration of hepatocellular carcinoma cells was apparently inhibited by ensuring that the APN catalytic cavity was occupied by bestatin. The identification of three-dimensional (3D) fluorescence in cancer tissues was completed under two-photon excitation coupled with lighting up hepatocellular carcinoma tumours in situ; this revealed that probe DCM-APN is an effective tool for detecting APN, thereby assisting in the early diagnosis of tumour in clinical medicine.
Introduction
Aminopeptidase N (APN/CD13, EC 3.4.11.2), also known as a dimeric membrane protein and a member of the zinc metallopeptidase family,1,2 participates in many physiological and pathological processes, including signal transduction, neuropeptide degradation, immunological responses, and antigen processing.3 APN has been extensively considered to be a marker for hematopoietic cells of myeloid origin, which facilitates the classification of human leukaemia cells through its antigenicity.4 Because APN plays a vital role in tumour invasion, angiogenesis, and metastasis,5 if an elevated APN is observed above a threshold, it could be employed as a cancer biomarker for assessing a patient and diagnosing clinical cancer.6–8 Therefore, developing valid methods that can be employed to track the activity of APN is considered to be of great medical significance.9–12To date, fluorescence imaging has been extensively employed to visualize biologically significant analytes as well as to perform image-guided surgery because of its high selectivity, sensitivity, and spatial and temporal resolutions, especially in a noninvasive manner.13–23 Specifically, the probes that utilize near-infrared (NIR) emission (650–900 nm) fluorescence are highly favoured for application in bio-imaging because they exhibit the ability to overcome issues such as tissue penetration and autofluorescence.24–26 In addition, two-photon fluorescence microscopy (under an excitation of 700–1000 nm) provides a satisfactory cell and tissue imaging solution that can be attributed to the advantages of two-photon technology, including long wavelength excitation, minimal photo-damage, and deep tissue penetration.27–32 To date, only one NIR fluorescence probe has been reported from among the few fluorescence probes employed for the detection of APN.4,33,34 Unfortunately, severe cross-talk between the excitation and emission spectra4 weakens its capability of gathering a valid signal.35 Furthermore, to the best of our knowledge, a two-photon fluorescence probe has not been developed for tracking APN activity in both living cells and tissues.
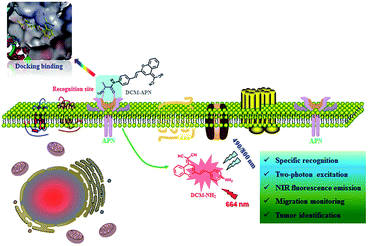
In this work, we report a novel NIR two-photon fluorescence probe DCM-APN for detecting APN by combining L-alanine as the recognition unit with the classical dicyanomethylene-benzopyran (DCM) fluorophores. DCM-APN was transformed into DCM-NH2 by performing enzymatic hydrolysis of the amide bond of APN, thereby releasing the bare amino group as a strong electron donor and liberating the NIR fluorescence signal at 664 nm based on the enhanced intramolecular charge transfer (ICT) effect. Notably, a large Stokes shift of Δλ = 194 nm (λabs = 470 nm; λem = 664 nm) considerably enhanced the ability to collect valid signals. Furthermore, DCM-APN was employed to distinguish normal cells from cancer cells as well as normal liver tissue from hepatocellular carcinoma tissue via three-dimensional (3D) imaging using a two-photon excitation fluorescence process. The in vivo transplanted tumour in nude BALB/c mice imaging revealed that the activatable probe DCM-APN can be a promising tool to study APN activity.
Results and discussion
Design and synthesis of probe DCM-APN
Dicyanomethylene-benzopyran (DCM) fluorophores possess an inherently classic donor–π–acceptor (D–π–A) structure,36–38 and have been extensively employed in the field of fluorescence probes because of their excellent photo-stability, broad absorption bands, controllable emission spectrum, large Stokes shift and considerable two-photon absorption cross-section.27 Researchers have found that alanine decorated ligands are preferred by APN within accessible catalytic cavities.1 Hence, by conjugating the bare amine group of DCM-NH2 with L-alanine's carboxyl (i.e. potential recognition sites), an enzyme-triggered two-photon fluorescent probe DCM-APN was successfully synthesized as illustrated in Scheme S1,† which was accurately validated using nuclear magnetic resonance (NMR) spectroscopy and high resolution mass spectrometry (ESI-HRMS), as presented in the ESI.†Spectroscopic characteristics and response to APN
The spectral properties of probe DCM-APN were investigated in aqueous solution (PBS/DMSO = 7![[thin space (1/6-em)]](https://www.rsc.org/images/entities/char_2009.gif) :
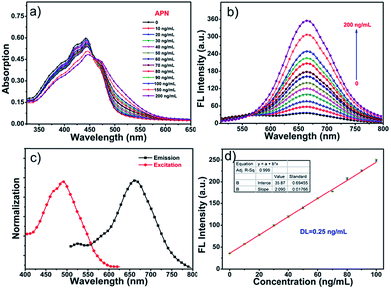
:![[thin space (1/6-em)]](https://www.rsc.org/images/entities/char_2009.gif) 3, v/v, 0.01 M, pH = 7.4). As depicted in Fig. 1a, with an increase in the concentration of APN (0–200 ng mL−1), there is an obvious 28 nm red-shift in absorption profiles ranging from 442 nm to 470 nm (an evident isosbestic point at around 458 nm) that is accompanied by an evident color change of the solution from pale yellow to light red (Fig. S1†). Simultaneously, the fluorescence intensity of probe DCM-APN (10 μM, ϕ = 0.6%) at approximately 664 nm was observed to gradually increase owing to the fact that APN specifically cuts the amide bond in the aqueous buffer solution (Fig. 1b and S2†), thereby releasing the NIR fluorescence signal of DCM-NH2 (ϕ = 2.8%, Scheme 1). Notably, a large Stokes shift of Δλ = 194 nm considerably reduced the interference of background noise and significantly improved the accuracy of detection (Fig. 1c). Furthermore, a linear functional relationship (R2 = 0.999) was obtained at the fluorescence intensity of 664 nm, and a low dose enzyme concentration (0–100 ng mL−1) with a detection limit for APN as low as 0.25 ng mL−1 (Fig. 1d) (based on the 3σ/k principle) clearly indicates that probe DCM-APN could be used to quantitatively identify trace amounts of APN in vitro.
3, v/v, 0.01 M, pH = 7.4). As depicted in Fig. 1a, with an increase in the concentration of APN (0–200 ng mL−1), there is an obvious 28 nm red-shift in absorption profiles ranging from 442 nm to 470 nm (an evident isosbestic point at around 458 nm) that is accompanied by an evident color change of the solution from pale yellow to light red (Fig. S1†). Simultaneously, the fluorescence intensity of probe DCM-APN (10 μM, ϕ = 0.6%) at approximately 664 nm was observed to gradually increase owing to the fact that APN specifically cuts the amide bond in the aqueous buffer solution (Fig. 1b and S2†), thereby releasing the NIR fluorescence signal of DCM-NH2 (ϕ = 2.8%, Scheme 1). Notably, a large Stokes shift of Δλ = 194 nm considerably reduced the interference of background noise and significantly improved the accuracy of detection (Fig. 1c). Furthermore, a linear functional relationship (R2 = 0.999) was obtained at the fluorescence intensity of 664 nm, and a low dose enzyme concentration (0–100 ng mL−1) with a detection limit for APN as low as 0.25 ng mL−1 (Fig. 1d) (based on the 3σ/k principle) clearly indicates that probe DCM-APN could be used to quantitatively identify trace amounts of APN in vitro.
Response speed and selectivity
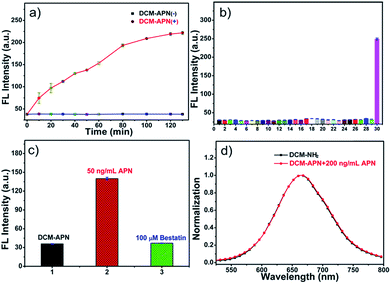
The fluorescence intensities of probe DCM-APN (10 μM) around 664 nm were periodically recorded in the presence of 100 ng mL−1 APN at 37 °C in aqueous solution. The enzymatic reaction was complete in approximately 120 min (Fig. 2a) compared to that in the absence of APN (Fig. S3†). Good specificity is one of the key indicators for evaluating probe usability in a complex bio-system. Subsequently, the influence of common biological interferents towards probe DCM-APN including ions (Na+; K+; Ca2+; Mg2+; Ni2+; NH4+; F−; Cl−; Br−; I−; CH3COO−; HCO3−; CO32−; S2−; HPO4−; NO3−; SO42−; SCN−; NO2−), amino acids (glutathione; cysteine; homocysteine), redox species (ascorbic acid; H2O2; NO) and related-enzymes (nitroreductase; transglutaminase; γ-glutamyltranspeptidase) was investigated. As depicted in Fig. 2b and S4,† only APN caused obvious fluorescence enhancement as it has the ability to specifically catalyze the conversion of the amide linkage of DCM-APN to the DCM fluorophore, thereby verifying that probe DCM-APN possesses excellent selectivity with respect to APN.Micro-environmental influence
The influence of micro-environmental conditions, including pH and temperature, was investigated. As shown in Fig. S5,† the probe DCM-APN (10 μM) exhibited good stability at different pH values ranging from 4.75 to 10.27. Temperature had little effect on the probe itself ranging from 25 °C to 50 °C (Fig. S6a†) and the fluorescence intensity of probe DCM-APN towards APN around 664 nm increased a maximum at 37 °C (Fig. S6b†). Based on the above results, the probe DCM-APN shows excellent performance during the recognition of APN under normal physiological conditions.Sensing mechanism
In order to explore the sensing mechanism of probe DCM-APN towards APN, the high resolution mass spectra of the resulting catalytic product were initially recorded (Fig. S7†). Here, a distinct peak was observed at m/z = 312.1136, which was consistent with the positive ion mode of DCM-NH2 (calcd. 312.1131 for [M + H]+). Additionally, normalization fluorescence spectra of DCM-NH2 along with those of the catalytic product completely coincided with their excitation and emission spectra (Fig. 1c, 2d and S8†). This further verifies that APN exhibits the ability to catalyze substrate sites (as per Scheme 1). Furthermore, when pretreated using 100 μM bestatin (an inhibitor of APN) in aqueous solution, the activity of APN was found to be completely suppressed (Fig. 2c and S9†) because its active sites were occupied by bestatin.To obtain further details related to the interactions between probe DCM-APN and APN, molecular docking investigations based on Accelrys' Discovery Studio 2.5 platform were conducted. The X-ray crystal structure of human APN that was measured at a resolution of 1.35095 Å using amastatin (PDB: 4FYT) from the RCSB PDB database was employed. In the crystal, a zinc ion was chelated by three ligands that were provided by His388, His392 and Glu411 in the catalytic center of APN (Fig. S10†). After defining the binding sphere and molecular docking parameters (Fig. 3a), probe DCM-APN was docked with APN and it could easily reach the coordination center of zinc ion, which could be ascribed to the hydrophobic interaction with the N-terminal amino acid of peptides (Fig. S11†). Furthermore, the coordinate bond lengths in DCM-APN and the zinc ion were 2.117 Å and 2.256 Å (Fig. 3b), respectively, and were close to the other three bond lengths observed in APN (2.027 Å, 2.085 Å and 1.936 Å, Fig. S10†). In addition, the interactions of the existing hydrogen bonds between probe DCM-APN and other peptides, such as Glu355, Glu411, Ala353 and Tyr477, firmly anchor the N-terminal amine of probe DCM-APN to the active catalytic site (Fig. 3c). Therefore, using water as the catalyst, the scissile amide bond of probe DCM-APN was precisely hydrolyzed in the catalytic system that was centered on the zinc ions. Simultaneously, DCM-NH2 was released with enhanced NIR fluorescence emission. To our delight, the results of the docking simulation agreed well with those of the aforementioned experimental phenomena, which completely confirmed the response of probe DCM-APN to APN.
Cytotoxicity and cell imaging
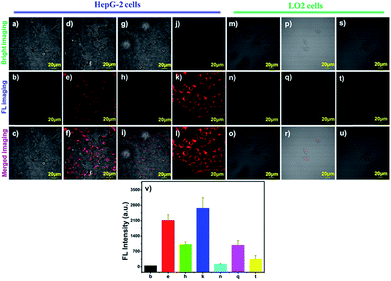
To evaluate the biocompatibility of the probe, the viability of HepG-2 cells (cancer cells) and LO2 cells (normal cells) towards various doses of probe DCM-APN (0–10 μM) was measured using standard 5-diphenyltetrazolium bromide (MTT) assays for 24 h. The experimental results are demonstrated in Fig. S12 and S13,† which reveal the considerably low cytotoxicity of the probe.Subsequently, hepatoma carcinoma cells (HepG-2 cells, APN+) and mouse melanoma (B16/BL6 cells, APN+) were selected to monitor the endogenous APN activity on the surfaces of cell membranes.5,10 Compared to the LO2 cells with a low APN expression (Fig. 4q),34 the NIR fluorescence signal was obtained (Fig. 4e) after the HepG-2 cells were treated with 2.5 μM probe DCM-APN for 10 min. The same features were present in B16/BL6 cells (Fig. S14†), which were ascribed to the enzymatic hydrolysis of the probe in cells exhibiting abnormal APN activity. With a prolonged incubation time, the fluorescence intensity of the cell continued to increase (Fig. S15 and S16†). Then, when incubated with 50 μM bestatin (the inhibitor of APN) for 2 h, a significant reduction in the fluorescence intensity of HepG-2 cells could be observed (Fig. 4h). To clearly quantify the results, the fluorescence intensity values were measured using an average of nine regions of interest (ROIs) obtained from various treated cells (Fig. 4v). As observed in Fig. 4j–l, high resolution two-photon imaging of probe DCM-APN in living HepG-2 cells was also obtained and compared with that in Fig. S17,† which further established that probe DCM-APN could be employed to track endogenous APN activity in situ using a two-photon platform. Additionally, the cell morphology and fluorescence intensity of ROIs (Fig. S18a and b†) were observed to remain unchanged (Fig. S18d†) after continuous two-photon irradiation at 800 nm for 1000 s, which confirmed that probe DCM-APN exhibited high photo-stability. Therefore, probe DCM-APN might be employed to distinguish cancer cells from normal cells via imaging techniques.
Cell motility assays
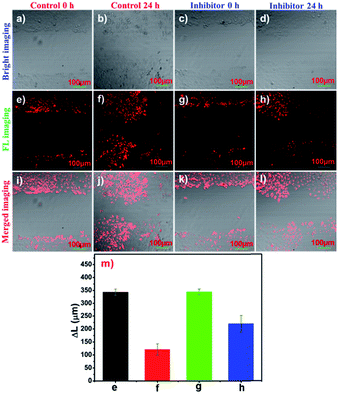
Tumour cell migration is of crucial importance for the rapid tumour progression and cancer treatment in clinical medicine. Correspondingly, aminopeptidases play a vital role in the angiogenesis, metastasis, and migration of a solid tumour.2,39,40 To visualize the APN activity in the migration of tumour cells, cell motility assays were observed. Living HepG-2 cells were obtained immediately after an injury within 350 μm (Fig. 5e and g). After the cells were cultured for 24 h by conducting pre-treatment using bestatin (100 μM) at 37 °C, their horizontal migration was observed to be remarkably inhibited (Fig. 5h). In comparison, the migration of the HepG-2 cells was visible in the control group (Fig. 5f). The migration distances are depicted in Fig. 5m and they indicated that APN participated in the regulation of tumour migration. Therefore, the treatment of metastatic tumours may benefit from APN inhibitor addition strategies for patients as an adjuvant therapy.Subcellular localization
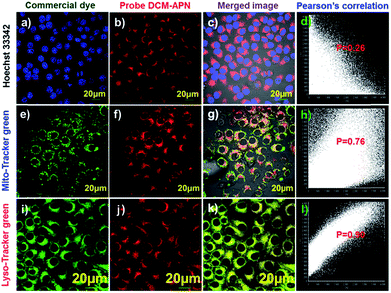
Co-localization experiments were performed to explore the distribution of probe DCM-APN in living cells. High purity commercial Hoechst 33342 (Fig. 6a), Mito-Tracker (Fig. 6e), and Lyso-Tracker (Fig. 6i) were co-incubated with probe DCM-APN (Fig. 6b, f and j) in HepG-2 cells. The NIR channel (Fig. 6j) overlaid well with the Lyso-Tracker channel (Fig. 6i) and resulted in a Pearson's correlation coefficient of 0.90 (Fig. 6l), which was higher than that of the nucleus (P = 0.26, Fig. 6d) and mitochondria (P = 0.76, Fig. 6h). The results are consistent with those of the B16/BL6 cells (Fig. S19†), demonstrating that probe DCM-APN mainly clustered as lysosomes. We inferred that lysosome labelling in this manner could be attributed to the alkalization effect of the bare amino products of DCM-NH2 (Scheme 1).Imaging of endogenous APN activity in tissues
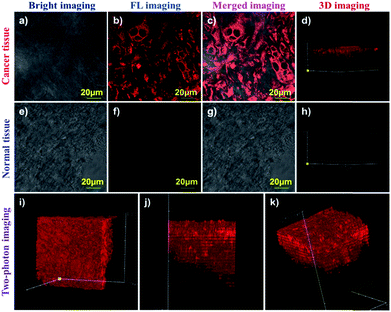
To the best of our knowledge, until now, there has been no fluorescence probe capable of monitoring APN in different tissues for clinical diagnosis. Therefore, we prepared various tissues from hepatocellular carcinoma tissue and normal liver tissue using a LEICA CM1860 UV clinical cryostat to verify probe DCM-APN. As depicted in Fig. 7a–d, 20 μm of cancer tissue from bare BABL/c mice bearing HepG-2 xenograft tumours demonstrated a strong fluorescence signal (Fig. 7c), with 2.5 μM of probe DCM-APN for 30 min. In sharp contrast, no fluorescence signal was measured from the normal liver tissue that was pre-incubated with 2.5 μM of probe DCM-APN (Fig. 7g). Additionally, the 3D fluorescence imaging results of tissues (Fig. 7d and h) were in contrast, which proved that the probe DCM-APN is an effective tool for oncologists in medical diagnosis of cancer. Considering deep tissue penetration under two-photon excitation,27 as depicted in Fig. 7i–k, 3D imaging of 200 μm of hepatocellular carcinoma tissue treated with 5 μM of probe DCM-APN resulted in the production of a remarkable fluorescence signal using 800 nm of excitation. Based on the aforementioned results, we have verified the suitability of DCM-APN as the first NIR fluorescence probe for tracking APN endogenous activity in the tissue, which is useful for the early diagnosis and treatment of hepatocellular carcinoma in clinical practice.Fluorescence imaging of APN activity in vivo
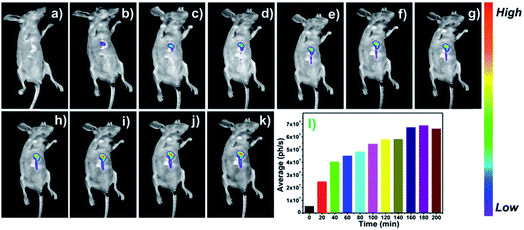
Encouraged by the outstanding performance in living cells, thereby, we explored the capability of probe DCM-APN for tracking the APN activity in mice bearing HepG-2 xenograft tumours. As depicted in Fig. 8, the bare BABL/c mice were intratumorally injected with the probe DCM-APN (100 μM, 150 μL). Using the NightOWL II LB983 small animal in vivo imaging system, an obvious fluorescence signal appeared at the tumour site in situ (Fig. 8b), with the fluorescence intensity gradually increasing as a function of time (Fig. 8b–k). Furthermore, the respective average fluorescence statistics (ph/s) are displayed in Fig. 8l, which were consistent with those of the fluorescence images. In contrast, a considerably weak fluorescence was obtained via subcutaneous injection without the HepG-2 xenograft tumour (Fig. S20†), which further confirmed that the probe could selectively light-up hepatocellular carcinoma with a high signal-to-noise ratio. By considering the above results, it was revealed that the probe DCM-APN exhibited potential to be employed for the early diagnosis and surgical imaging of hepatocellular carcinoma in clinical practice.Conclusions
In summary, we have developed a novel two-photon NIR fluorescence probe DCM-APN for tracking endogenous APN activity in virtue of the regulation of the ICT mechanism. By specifically identifying the substrates (i.e., a docking simulation), probe DCM-APN displayed high selectivity and ultra-sensitivity (DL 0.25 ng mL−1) for APN. It was observed to be biocompatible, and could be employed to monitor the APN activity for distinguishing between cancer cells (e.g., HepG-2 and B16/BL6 cells) and normal cells (LO2 cells). Notably, it was also used to investigate the APN activity at the hepatocellular carcinoma tissue using a one/two-photon confocal fluorescence microscope. Furthermore, a wound healing assay of tumour cells has demonstrated that APN plays an important role in cell migration. More importantly, HepG-2 xenograft tumour of mice is observed to be lit up through in situ injection with probe DCM-APN, thereby demonstrating that the probe shows potential to be used as an effective tool for the early diagnosis and evaluation of synergistic cancer therapies in clinical practice.Conflicts of interest
The authors declare no competing financial interests.Acknowledgements
This work was financially supported by the National Natural Science Foundation of China (21421005, 21576037, 21878039, 21822804 and 21676047), and NSFC-Liaoning United Fund (U1608222). All the animal procedures were performed in accordance with the Guidelines for Care and Use of Laboratory Animals of Dalian Medical University and experiments were approved by Dalian Medical University Animal Care and Use Committee.Notes and references
- L. Chen, Y. L. Lin, G. Peng and F. Li, Proc. Natl. Acad. Sci. U. S. A., 2012, 109, 17966–17971 CrossRef CAS PubMed.
- S. X. Cui, X. J. Qu, Z. H. Gao, Y. S. Zhang, X. F. Zhang, C. R. Zhao, W. F. Xu, Q. B. Li and J. X. Han, Cancer Lett., 2010, 292, 153–162 CrossRef CAS.
- J. S. Shim, J. H. Kim, H. Y. Cho, Y. N. Yum, S. H. Kim, H. J. Park, B. S. Shim, S. H. Choi and H. J. Kwon, Chem. Biol., 2003, 10, 695–704 CrossRef CAS.
- X. He, Y. Hu, W. Shi, X. Li and H. Ma, Chem. Commun., 2017, 53, 9438–9441 RSC.
- Y. Aozuka, K. Koizumi, Y. Saitoh, Y. Ueda, H. Sakurai and I. Saiki, Cancer Lett., 2004, 216, 35–42 CrossRef CAS PubMed.
- R. Hata, H. Nonaka, Y. Takakusagi, K. Ichikawa and S. Sando, Angew. Chem., Int. Ed., 2016, 55, 1765–1768 CrossRef CAS PubMed.
- Y. Saitoh, K. Koizumi, T. Minami, K. Sekine, H. Sakurai and I. Saiki, Biol. Pharm. Bull., 2006, 29, 709–712 CrossRef CAS.
- M. Terauchi, H. Kajiyama, K. Shibata, K. Ino, A. Nawa, S. Mizutani and F. Kikkawa, BMC Cancer, 2007, 7, 140 CrossRef.
- P. Mina-Osorio, Trends Mol. Med., 2008, 14, 361–371 CrossRef CAS PubMed.
- N. Haraguchi, H. K. Ishii, F. Tanaka, M. Ohkuma, H. M. Kim, H. Akita, D. Takiuchi, H. Hatano, H. Nagano and G. F. Barnard, J. Clin. Invest., 2010, 120, 3326–3339 CrossRef CAS PubMed.
- A. M. Alizadeh, M. Sadeghizadeh, F. Najafi, S. K. Ardestani, V. Erfanimoghadam, M. Khaniki, A. Rezaei, M. Zamani, S. Khodayari and H. Khodayari, BioMed Res. Int., 2015, 2015, 824746 Search PubMed.
- M. Wickstrã, R. Larsson, P. Nygren and J. Gullbo, Cancer Sci., 2011, 102, 501–508 CrossRef.
- D. Asanuma, M. Sakabe, M. Kamiya, K. Yamamoto, J. Hiratake, M. Ogawa, N. Kosaka, P. L. Choyke, T. Nagano, H. Kobayashi and Y. Urano, Nat. Commun., 2015, 6, 6463 CrossRef CAS.
- T. B. Ren, Q. L. Zhang, D. Su, X. X. Zhang, L. Yuan and X. B. Zhang, Chem. Sci., 2018, 9, 5461–5466 RSC.
- D. Wu, L. Chen, N. Kwon and J. Yoon, Chem, 2016, 1, 674–698 CAS.
- J. Li, Y. Kwon, K. S. Chung, S. L. Chang, D. Lee, Y. Yue, J. Yoon, G. Kim, S. J. Nam and Y. W. Chung, Theranostics, 2018, 8, 1411–1420 CrossRef CAS PubMed.
- K. Gu, Y. Xu, L. Hui, Z. Guo, S. Zhu, S. Zhu, S. Ping, T. D. James, T. He and W. H. Zhu, J. Am. Chem. Soc., 2016, 138, 5334–5340 CrossRef CAS PubMed.
- C. Zhao, X. Zhang, K. Li, S. Zhu, Z. Guo, L. Zhang, F. Wang, Q. Fei, S. Luo and P. Shi, J. Am. Chem. Soc., 2015, 137, 8490–8498 CrossRef CAS PubMed.
- A. Sharma, E. J. Kim, H. Shi, J. Y. Lee, B. G. Chung and J. S. Kim, Biomaterials, 2017, 155, 145–151 CrossRef PubMed.
- M. H. Lee, A. Sharma, M. J. Chang, J. Lee, S. Son, J. L. Sessler, C. Kang and J. S. Kim, Chem. Soc. Rev., 2018, 47, 28–52 RSC.
- Z. Mao, M. Ye, W. Hu, X. Ye, Y. Wang, H. Zhang, C. Li and Z. Liu, Chem. Sci., 2018, 9, 6035–6040 RSC.
- K. Gu, W. Qiu, Z. Guo, C. Yan, S. Zhu, D. Yao, P. Shi, H. Tian and W. H. Zhu, Chem. Sci., 2018 10.1039/c8sc04266g.
- H. Li, Q. Yao, F. Xu, N. Xu, R. Duan, S. Long, J. Fan, J. Du, J. Wang and X. Peng, Biomaterials, 2018, 179, 1–14 CrossRef CAS PubMed.
- R. J. Mellanby, J. I. Scott, I. Mair, A. Fernandez, L. Saul, J. Arlt, M. Moral and M. Vendrell, Chem. Sci., 2018, 9, 7261–7270 RSC.
- Q. Miao, D. C. Yeo, C. Wiraja, J. Zhang, X. Ning, C. Xu and K. Pu, Angew. Chem., Int. Ed., 2018, 57, 1256–1260 CrossRef CAS PubMed.
- Y. Liu, L. Teng, L. Chen, H. Ma, H.-W. Liu and X.-B. Zhang, Chem. Sci., 2018, 9, 5347–5353 RSC.
- W. Sun, J. Fan, C. Hu, J. Cao, H. Zhang, X. Xiong, J. Wang, S. Cui, S. Sun and X. Peng, Chem. Commun., 2013, 49, 3890–3892 RSC.
- P. Liu, B. Li, C. Zhan, F. Zeng and S. Wu, J. Mater. Chem. B, 2017, 5, 7538–7546 RSC.
- H. Li, Q. Yao, J. Fan, J. Du, J. Wang and X. Peng, Biosens. Bioelectron., 2017, 94, 536–543 CrossRef CAS.
- A. Sedgwick, W. T. Dou, J. B. Jiao, L. Wu, G. T. Williams, A. T. A. Jenkins, S. D. Bull, J. L. Sessler, X. P. He and T. D. James, J. Am. Chem. Soc., 2018, 140, 14267–14271 CrossRef CAS.
- Y. Lv, D. Cheng, D. Su, M. Chen, B. C. Yin, L. Yuan and X. B. Zhang, Chem. Sci., 2018, 9, 7606–7613 RSC.
- D. Cheng, Y. Pan, L. Wang, Z. Zeng, L. Yuan, X. Zhang and Y. T. Chang, J. Am. Chem. Soc., 2017, 139, 285–292 CrossRef CAS PubMed.
- L. Chen, W. Sun, J. Li, Z. Liu, Z. Ma, W. Zhang, L. Du, W. Xu, H. Fang and M. Li, Org. Biomol. Chem., 2013, 11, 378–382 RSC.
- X. He, Y. Xu, W. Shi and H. Ma, Anal. Chem., 2017, 89, 3217–3221 CrossRef CAS PubMed.
- C. H. Tung, Q. Zeng, K. Shah, D. E. Kim, D. Schellingerhout and R. Weissleder, Cancer Res., 2004, 64, 1579–1583 CrossRef CAS PubMed.
- Z. Wang, W. Hao, P. Liu, Z. Fang and S. Wu, Biomaterials, 2017, 139, 139–150 CrossRef CAS PubMed.
- K. Gu, Y. Liu, Z. Guo, C. Lian, C. Yan, P. Shi, H. Tian and W. H. Zhu, ACS Appl. Mater. Interfaces, 2016, 8, 26622–26629 CrossRef CAS PubMed.
- M. Zeng, A. Shao, H. Li, Y. Tang, Q. Li, Z. Guo, C. Wu, Y. Cheng, H. Tian and W.-H. Zhu, ACS Appl. Mater. Interfaces, 2017, 9, 13029–13036 CrossRef CAS PubMed.
- Y. Sato, Biol. Pharm. Bull., 2004, 27, 772–776 CrossRef CAS.
- K. Fukasawa, H. Fujii, Y. Saitoh, K. Koizumi, Y. Aozuka, K. Sekine, M. Yamada, I. Saiki and K. Nishikawa, Cancer Lett., 2006, 243, 135–143 CrossRef CAS PubMed.
Footnote |
| † Electronic supplementary information (ESI) available. See DOI: 10.1039/c8sc04685a |
| This journal is © The Royal Society of Chemistry 2019 |

