 Open Access Article
Bifunctional cleavable probes for in situ multiplexed glycan detection and imaging using mass spectrometry†
Wen
Ma
a,
Shuting
Xu
a,
Honggang
Nie
b,
Bingyang
Hu
c,
Yu
Bai
 *a and
Huwei
Liu
 a
a
aBeijing National Laboratory for Molecular Sciences, Key Laboratory of Bioorganic Chemistry and Molecular Engineering of Ministry of Education, College of Chemistry and Molecular Engineering, Peking University, Beijing 100871, P. R. China. E-mail: yu.bai@pku.edu.cn; Tel: +86 10 6275 8198
bAnalytical Instrumentation Center, Peking University, Beijing, 100871, P. R. China
cInstitute of Hepatobiliary Surgery, Hospital of Hepatobiliary Surgery, Chinese People's Liberation Army General Hospital, Beijing 100853, P. R. China
First published on 21st December 2018
Abstract
In situ analysis of glycans is of great significance since they mediate a range of biological activities. Aberrant changes of glycosylation are closely related to cancer onset and progression. In this work, bifunctional laser cleavable mass probes (LCMPs) were developed for in situ glycan detection from both cells and tissues using laser desorption ionization mass spectrometry (LDI-MS). Specific recognition of glycans was achieved by lectins, and inherent signal amplification was achieved by the conversion of the detection of glycans to that of mass tags which overcame the low ionization efficiency and complicated mass spectra of glycans. Multiplexed glycan profiling was easy to implement due to the simple and generic synthetic route to LCMPs and serial alternative mass tags, which offers high sensitivity, low interference and in situ detection of glycans. Moreover, as an excellent inherent matrix, LCMPs facilitated direct glycan detection from the cell surface and tissue imaging using LDI-MS. Intrinsic and fine glycan distribution in human cancer and paracancerous tissues was strictly demonstrated by MS imaging to explore the correlation between glycosylation and various cancers. This approach presented a versatile LDI-MS based platform for fast and in situ multiplexed glycan engineering, thus providing a new perspective in glycobiology and clinical diagnosis.
Introduction
Glycans decorate all eukaryotic cell surfaces through glycosylation which is considered to be one of the most important and complex post-modifications of proteins or lipids.1 Glycans mediate a range of biological activities and aberrant alterations of glycans on the cell surface usually reflect different onsets and progressions of diseases.2 For instance, an enhanced level of α-2,6 sialylation was observed in liver cancer progression,3 which is a potential biomarker in clinical diagnosis and therapy. Therefore, in situ, multiplexed and sensitive analysis of cell surface glycans is in urgent demand for understanding glycosylation machinery, correlating biological behaviors and facilitating biomarker discovery and clinical diagnosis.Diverse strategies including fluorescence,4 electrochemical sensors5 and mass spectrometry (MS)6 based methods have been explored for the analysis of cell surface glycans. However, due to the band overlap of fluorescent tags and unavoidable fluorescence interference from biological matrices, it's hard to analyze multiple glycans simultaneously in one system, and electrochemical methods failed to give intuitive and spatial information on glycans. Due to their great ability to provide structural information, multi-component detection, and qualitative and quantitative analysis, MS-based methods have been widely used in proteomics and glycomics. However, the tedious sample preparation procedure leads to inevitable sample loss and undervaluation of certain glycans. Besides, sample homogenization makes MS-based methods fail to give in situ spatial information on glycan expression on the cell surface. Recently, some photocleavable mass probes7 and DNA barcodes8 were applied for in situ analysis of cell surface glycans. Unfortunately, they suffered from either lack of generic synthesis routes and optional tags, which greatly limited multiplexed analysis, or the requirement of a secondary signal amplification strategy, which made the operation too complicated. Thus, developing a simple, multiplexed and sensitive method for in situ detection of cell surface glycans is of great value for glycan-related research and glycobiology.
Herein, an in situ multiplexed glycan detection approach was proposed based on the design of a series of bifunctional laser cleavable mass probes (LCMPs) and laser desorption ionization mass spectrometry (LDI-MS) (Scheme 1). Our LCMPs were prepared via a simple and generic synthetic route. Specific glycan recognition was achieved by lectins tethered to gold nanoparticles (Au NPs) through a PEG linker (NHS-PEG-S-S-PEG-NHS), and sufficient mass tags (MTs) were modified on the gold surface through Au–S coordination to provide inherent signal amplification. Combining the specific lectin binding with inherent signal amplification of LCMPs, the analysis of glycans was converted to the detection of numerous MTs with ultra-high sensitivity, which overcame the low ionization efficiency and complicated data interpretation of glycans. The cell number (low to 20 cells) and amount of glycans on the cell surface were measured by using a semi-quantitation method with the help of an internal standard (IS). The bifunctional property of LCMPs, which are an efficient probe for glycan detection and an excellent matrix in LDI-MS, made them directly and flexibly applicable in cell recognition and further detection. It is noteworthy that multiplexed glycan analysis could be easily achieved due to the simple and generic synthetic route to LCMPs and serial alternative MTs provided here. The above advantages make it easy to combine the LCMPs with MS imaging to provide the visible distribution of glycans. This novel approach was applied to image intrinsic and fine glycan distribution in fresh human tissues, which provided mass spectrometric evidence of different expression levels of glycans in cancerous and paracancerous tissues, tissues with different pathological changes and tissues with different microstructures, revealing the correlation between glycan expression and various cancers. Therefore, this approach presented a simple and versatile platform for multiplexed glycan engineering and thus is very promising for wide applications from deciphering biological events to clinical biomarker discovery and therapeutic treatment.
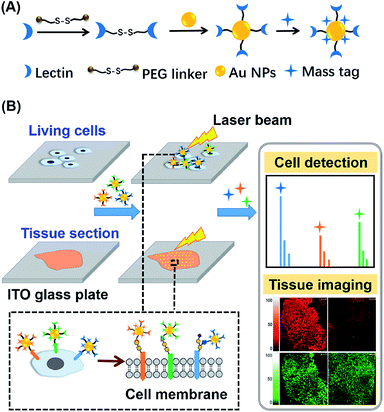 | ||
| Scheme 1 Schematic of (A) construction of LCMPs through a generic procedure and (B) multiplexed analysis of cell surface glycans and tissue imaging using LDI-MS. | ||
Results and discussion
Synthesis and characterization of LCMPs
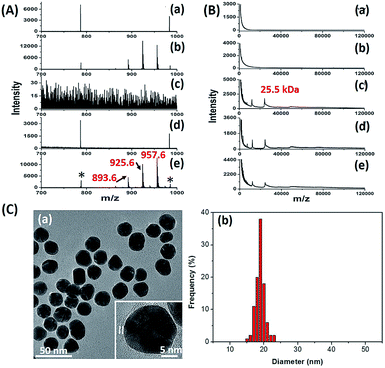
The key to the success of this method is the construction of LCMPs. Lectins were considered because of the specific recognition between lectins and glycans. For an ideal mass tag, low nonspecific interaction and interference are the key factors. In our experiments, concanavalin A (ConA) which specifically recognizes mannosyl moieties on the cell surface and (11-mercaptoundecyl)hexa(ethylene glycol) MT (HS-(CH2)11(OCH2CH2)6OH, MT1) were first selected to prepare Au@ConA-MT1 (LCMP1) through a simple, generic synthetic route9 (Scheme 1A). This series of molecular homologues HS-(CH2)11(OCH2CH2)nOH were prepared from a generic synthetic route starting from H(OCH2CH2)nOH and applied in immunoassay,10 cellular uptake11 and DNA detection12 (Scheme S1†). Proportions of Au, lectins and MTs were systematically optimized to get stable and highly reactive LCMPs (Fig. S1†). Step-by-step assembly of Au@ConA-MT1 was unambiguously verified by LDI-MS without an additional matrix (Fig. 1A and B) in which MT1 produced three characteristic mass signals with high intensity under laser irradiation. These three mass signals facilitated rapid identification even under complex matrices according to the characteristic fragment ions from sulfur loss (−32 Da), thus avoiding signal interference from the sample background. Transmission electron microscopy (TEM) images suggested a spherical and monodispersed Au@ConA-MT1 with a particle diameter of about 20 nm (Fig. 1C) and a ConA corona with a 2 nm thickness (inset in Fig. 1C). Ultraviolet and visible (UV-Vis) spectroscopy showed a 7 nm red shift of the maximum absorption peak after lectin conjugation, which is attributed to interparticle plasmon coupling (Fig. S2A†). Besides, to further verify the successful conjugation of ConA on the Au surface, fluorescein isothiocyanate (FITC)-conjugated ConA was used to modify Au NPs. Bright green fluorescence emitted from Au@ConA(FITC)-MT1 (Fig. S2B†) provided obvious evidence of ConA conjugation and further verified the feasibility of this synthesis method. Similarly, Au@SNA-MT2 (LCMP2) and Au@WGA-MT3 (LCMP3) were synthesized using Sambucus nigra agglutinin (SNA) and wheat germ agglutinin (WGA) as recognition units and HS-(CH2)11(OCH2CH2)4OH and HS-(CH2)11(OCH2CH2)5OH as MT2 and MT3, respectively. The SNA lectin specifically recognizes sialic acid (Sia) which is a common terminator of glycan chains and closely related to malignant transformation, while the WGA lectin shows specific binding to glycan N-acetylglucosamine (GlcNAc). MT2 was synthesized from CH3C(O)S(CH2)11(OCH2CH2)4OH through a simple alcoholysis reaction and MT3 was prepared starting from H(OCH2CH2)5OH. This series of molecular homologues could be synthesized from a generic route shown in Scheme S1† and have a similar mass fingerprint and ionization efficiency in LDI-MS, which offers great potential for multiplexed detection of analytes. Successful synthesis of Au@SNA-MT2 and Au@WGA-MT3 was confirmed by UV-Vis, TEM and fluorescence microscopy (Fig. S3†), respectively, which demonstrated the feasibility and universality of this synthesis method.In situ analysis of glycans
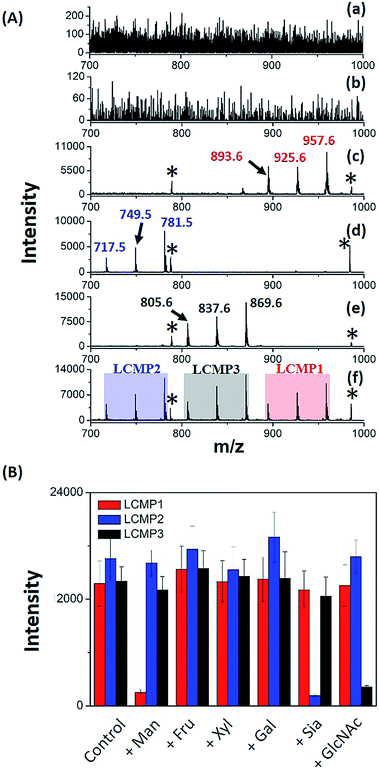
For in situ analysis of cell surface glycans, MCF-7 cells were directly cultured on a conductive indium tin oxide (ITO) glass plate. After 24 h of incubation, the cells were fixed by paraformaldehyde solution and labeled by different LCMPs, followed by direct analysis using LDI-MS. As shown in Fig. S4,† the cells successfully grew on the ITO surface; the fixation and labeling processes wouldn't cause negative effects on the cells’ morphology and viability. LCMPs themselves acted as an excellent matrix which facilitated the efficient desorption and ionization of different MTs, thus leading to a high response in MS analysis. To confirm the specific and selective recognition of the LCMPs, different nanoprobes (Au-MT1, Au@BSA-MT1, Au@ConA-MT1, Au@SNA-MT2, and Au@WGA-MT3) were used for cell labeling (Fig. 2A). As shown in Fig. 2A(c), (d) and (e), strong characteristic peaks of MT1, MT2 and MT3 were observed, reflecting a large amount of mannose (Man), Sia and GlcNAc on the cell surface, respectively. In contrast, no signal was observed in control experiments (Fig. 2A(a) and (b)), showing negligible non-specific adsorption. To further verify the interaction between LCMPs and cells attributed to the specific lectin binding, a monosaccharide inhibition experiment was conducted (Fig. 2B). LCMPs were pre-incubated with different free monosaccharides, followed by incubation with cells. Exogenous Man, Sia and GlcNAc inhibited the binding of Au@ConA-MT1, Au@SNA-MT2 and Au@WGA-MT3 to the cell surface, respectively, while fructose (Fru), xylose (Xyl) and galactose (Gal) showed no obvious inhibition. For multiplexed analysis of different glycans, a mixture of these three LCMPs was used for in situ cell labeling. Fig. 2A(f) clearly shows noninterference within these three MTs, and signal intensities were almost the same as those observed when they were used individually. Considering the simple and generic synthetic route to LCMPs and a series of alternative MTs presented here, this simple in situ method has great potential for the analysis of multiple glycans on the cell surface simultaneously and thus largely simplified the operation procedures and facilitated practical applications.Drug stimulation and semi-quantitation of cells
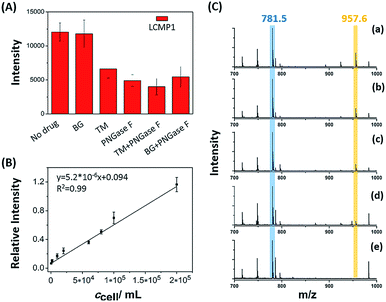
Dynamic alterations of a certain glycan under drug stimulations on the cell surface were evaluated to decipher its expression and biological function perturbed by inhibitors (Fig. 3A). Cells with a certain concentration were treated with 120 μM O-glycan inhibitor benzyl 2-acetamido-2-deoxy-α-D-galactopyranoside (BG) or 12 μM N-glycan inhibitor tunicamycin (TM) for 24 h before detection of LCMP1 for reflecting mannosyl expression. Compared with untreated cells, TM-treated cells showed a sharp decrease of signal intensity, which reflected the decrease of mannosyl expression. TM blocks the first step of N-glycosylation biosynthesis to inhibit N-glycans containing a pentasaccharide core of three mannose and two N-acetylglucosamine (GlcNAc2Man3), thus leading to a lower signal. However, even though the concentration of BG was ten-fold higher than that of TM, there was no obvious change because BG blocks the first N-acetylgalactosamine (GalNAc) of O-glycans but does not disturb N-glycosylation. On the other hand, as a glycosidase, PNGase F specifically cut innermost GlcNAc and asparagine residues of N-linked glycoproteins, thus causing an obvious decrease of signal intensity. Therefore, this novel in situ sensitive method provided a valuable tool for screening various inhibitors or stimulations of certain glycans. Further, this powerful strategy was used for semi-quantitation of cells. Cell suspensions with different concentrations were incubated with a certain amount of LCMP1 in a tube. IS Au-MT2 was mixed with cells before directly depositing the cell precipitation on an LDI-MS plate. Relative intensity (LCMP1/MT2) was proportional to cell concentration ranging from 5 × 10² to 2 × 10⁵ cells per mL (Fig. 3B and C). According to the signal to noise ratio, the limit of detection was 200 cells per mL; since 100 μL cell suspensions were added in the experiment, as low as 20 cells were detected, which was comparable to those of electrochemical methods.13 This high sensitivity was attributed to the inherent signal amplification derived from numerous MTs on the probe and strong and specific recognition of glycans by lectins.Measurement of cell surface glycans
The proposed sensitive in situ analysis method was applied in the semi-quantification of cell surface Man, Sia and GlcNAc using a competition strategy. Relative intensity was proportional to the amount of LCMPs binding on the cell surface, which progressively increased with the increment of cells. Meanwhile, the competition strategy was constructed by adding a certain amount of free monosaccharides to the incubation mixtures on the basis of the assumption that these monosaccharides had the same binding kinetics as those on the cell surface. Upon the competitive binding of free monosaccharides and cell surface glycans to LCMPs, the relative intensity decreased due to the reduced conjugation of LCMPs on cells. For instance, linear correlations between relative intensity and cell number or added free mannose were measured. As shown in Fig. 4, the relative intensity increased linearly with cell numbers ranging from 1000 to 10![[thin space (1/6-em)]](https://www.rsc.org/images/entities/char_2009.gif) 000 (R2 = 0.99) and was found to show a linear decrease with the addition of free mannose from 2 pmol to 10 pmol (R2 = 0.98). The slopes of binding curves for LCMP1, LCMP2 and LCMP3 were 5.2 × 10⁻⁵, 1.4 × 10⁻⁴ and 1.3 × 10⁻⁴, and the slopes of competition curves were −0.036, −0.15 and −0.12 for Man, Sia and GlcNAc, respectively. Thus, the average numbers of Man, terminal Sia and GlcNAc expressed on the cell surface could be estimated according to the ratio of these two slopes and were calculated to be 8.7 × 10⁸, 5.6 × 10⁸ and 6.5 × 10⁸, respectively (ESI†). These results demonstrated the feasibility of this novel method for quantitative detection of multiple glycans on the cell surface using LDI-MS.
000 (R2 = 0.99) and was found to show a linear decrease with the addition of free mannose from 2 pmol to 10 pmol (R2 = 0.98). The slopes of binding curves for LCMP1, LCMP2 and LCMP3 were 5.2 × 10⁻⁵, 1.4 × 10⁻⁴ and 1.3 × 10⁻⁴, and the slopes of competition curves were −0.036, −0.15 and −0.12 for Man, Sia and GlcNAc, respectively. Thus, the average numbers of Man, terminal Sia and GlcNAc expressed on the cell surface could be estimated according to the ratio of these two slopes and were calculated to be 8.7 × 10⁸, 5.6 × 10⁸ and 6.5 × 10⁸, respectively (ESI†). These results demonstrated the feasibility of this novel method for quantitative detection of multiple glycans on the cell surface using LDI-MS.
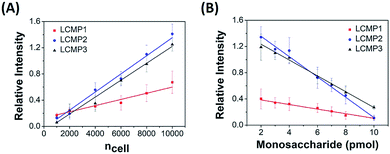 | ||
| Fig. 4 Plots of mass relative intensity of LCMP1, LCMP2, and LCMP3 vs. (A) cell number and (B) free monosaccharides added to the cell mixture. | ||
MS imaging of fresh tissues
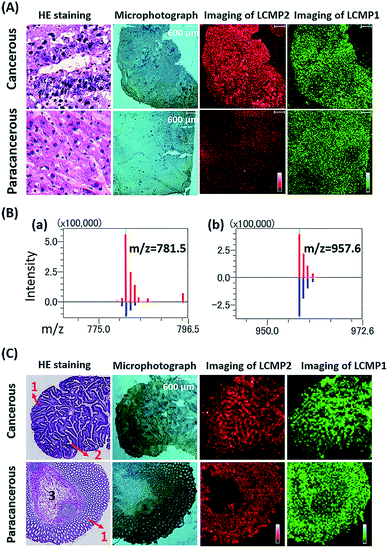
Aberrant expression of cell surface glycans is a universal hallmark of various cancers. Here, our in situ detection strategy converted the analysis of glycans to detection of various MTs, effectively overcoming the low ionization efficiency and complicated MS pattern of glycans. Besides, bifunctional LCMPs acted as not only an efficient probe but also an excellent matrix in LDI-MS, which made them directly applicable in glycan recognition and further detection. The above advantages make it easy to combine LCMPs with MS imaging14 to provide the visible distribution of glycans in various cancer tissues. To test the feasibility of this imaging method, some control experiments were first conducted on a couple of hepatocellular carcinoma (HCC) tissues and paracancerous tissues. As clearly shown in Fig. S5,† Au-tag1 and Au-tag2 had negligible non-specific adsorption on cancerous tissues and paracancerous tissues; only by conjugation of lectins can probes generate strong mass signals. Furthermore, another pair of HCC tissue and paracancerous tissue was placed on the same ITO glass, a piece of specimen was used for hematoxylin and eosin (HE) staining and the other serial section was used for labeling and MS imaging. HE staining showed different pathologies in which larger cell nuclei with heteromorphism were observed in middle-differentiated HCC. As clearly shown in Fig. 5A and B, overexpression of sialic acid in HCC tissue was observed compared with that in paracancerous tissue while the expression level of mannose almost remained the same (the same result was also observed in another pair of liver tissues in Fig. S5†). This was in good accordance with SERS imaging results15 and may be attributed to up-regulated β-galactoside α-2,6-sialyltransferase in HCC.16 HCC accounts for 90% of primary liver cancer, and this malignant tumor leads to a low survival rate, partly due to tumors being diagnosed at an advanced stage. Our simple and powerful in situ detection method reflected glycan alterations during disease initiation and progression and thus is very promising in early diagnosis of various cancers. In another liver cancer patient, a significant difference was observed in various pathological changes (Fig. S6†); for instance, almost no glycans were found in the hepatic necrosis area, and relatively low expression of glycans was observed in the liver fibrosis area while both cancer and hepatitis areas showed high expression of glycans. Besides, we also demonstrated the sialic acid and mannose imaging result of colorectal cancer tissue in Fig. 5C. In contrast to previous results, expression levels of these two glycans in cancer tissue were slightly lower than those in paracancerous one. It is noteworthy that, in cancer tissue, both glycans were expressed on the epithelial cell surface but not in the acinotubular section. However, in paracancerous tissue, glycans widely distributed on epithelial cells and acinus while the lamina propria area of connective tissue showed very low expression of sialic acid in contrast to mannose. All the above results showed the robustness and reliability of this pragmatic LCMP in distinguishing cancer tissues, tissues with different pathological changes and tissues with different microstructures based on various glycan alterations, which is significantly promising in clinical applications.Conclusions
In conclusion, a simple, multiplexed and sensitive methodology based on LCMPs and LDI-MS was provided for in situ analysis of cell surface glycans. LCMPs were prepared through a simple and generic synthetic route, and thus multiplexed detection could be easily conducted by simply replacing different lectins and MT homologues presented here. Numerous MTs incorporated on the Au surface led to inherent signal amplification of LCMPs, which converted the analysis of glycans to the detection of MTs with high sensitivity, overcoming the low ionization efficiency, lability of glycans and complicated data interpretation. Moreover, bifunctional LCMPs also acted as an excellent matrix in LDI-MS, making them directly applicable in cell recognition, detection and tissue imaging. These pragmatic bifunctional LCMPs were further used for imaging of intrinsic glycan distribution in several fresh human tissues to decipher the correlation between glycan alteration and cancer progression. This approach presented a versatile platform for in situ multiplexed glycan detection, which is also a powerful tool for understanding glycosylation machinery, deciphering glycobiology, and facilitating diagnosis and biomarker discovery.Conflicts of interest
There are no conflicts to declare.Acknowledgements
We gratefully acknowledge Mr Yi Ma and Mr Li Li for their technical support in HE staining and pathological interpretation. This work was financially supported by the National Natural Science Foundation of China (21874003, 21527809, and 21728501), the National Key R&D Program of China (2017YFC0906800) and the Ministry of Science and Technology of the People's Republic of China (2016YFF0100303).Notes and references
- (a) R. G. Spiro, Glycobiology, 2002, 12, 43R–56R CrossRef CAS PubMed; (b) K. S. Lau, E. A. Partridge, A. Grigorian, C. I. Silvescu, V. N. Reinhold, M. Demetriou and J. W. Dennis, Cell, 2007, 129, 123–134 CrossRef CAS PubMed.
- (a) M. A. Hollingsworth and B. J. Swanson, Nat. Rev. Cancer, 2004, 4, 45–60 CrossRef CAS PubMed; (b) K. Ohtsubo and J. D. Marth, Cell, 2006, 126, 855–867 CrossRef CAS PubMed.
- W. R. Alley and M. V. Novotny, J. Proteome Res., 2010, 9, 3062–3072 CrossRef CAS PubMed.
- (a) B. Belardi, A. de la Zerda, D. R. Spiciarich, S. L. Maund, D. M. Peehl and C. R. Bertozzi, Angew. Chem., Int. Ed., 2013, 52, 14045–14049 CrossRef CAS PubMed; (b) W. Lin, Y. F. Du, Y. T. Zhu and X. Chen, J. Am. Chem. Soc., 2014, 136, 679–687 CrossRef CAS PubMed; (c) N. Wu, L. Bao, L. Ding and H. X. Ju, Angew. Chem., Int. Ed., 2016, 55, 5220–5224 CrossRef CAS PubMed.
- (a) L. Ding, W. Cheng, X. J. Wang, S. J. Ding and H. X. Ju, J. Am. Chem. Soc., 2008, 130, 7224–7225 CrossRef CAS PubMed; (b) W. Cheng, L. Ding, S. J. Ding, Y. B. Yin and H. X. Ju, Angew. Chem., Int. Ed., 2009, 48, 6465–6468 CrossRef CAS PubMed.
- (a) W. X. Chen, J. M. Smeekens and R. H. Wu, Chem. Sci., 2015, 6, 4681–4689 RSC; (b) L. F. Yang, J. O. Nyalwidhe, S. Q. Guo, R. R. Drake and O. J. Semmes, Mol. Cell. Proteomics, 2011, 10, 16 Search PubMed; (c) Y. Tian, R. T. Almaraz, C. H. Choi, Q. K. Li, C. Saeui, D. N. Li, P. Shah, R. Bhattacharya, K. J. Yarema and H. Zhang, Clin. Proteomics, 2015, 12, 13 CrossRef PubMed; (d) J. Sun, H. H. Liu, L. P. Zhan, C. Q. Xiong, X. Huang, J. J. Xue and Z. X. Nie, Anal. Chem., 2018, 90, 6397–6402 CrossRef CAS PubMed.
- C. F. Dai, L. H. Cazares, L. F. Wang, Y. Chu, S. M. L. Wang, D. A. Troyer, O. J. Semmes, R. R. Drake and B. H. Wang, Chem. Commun., 2011, 47, 10338–10340 RSC.
- Z. Y. He, Q. S. Chen, F. M. Chen, J. Zhang, H. F. Li and J. M. Lin, Chem. Sci., 2016, 7, 5448–5452 RSC.
- L. R. Hirsch, J. B. Jackson, A. Lee, N. J. Halas and J. West, Anal. Chem., 2003, 75, 2377–2381 CrossRef CAS PubMed.
- J. R. Lee, A. Lee, S. K. Kim, K. P. Kim, H. S. Park and W. S. Yeo, Angew. Chem., Int. Ed., 2008, 47, 9518–9521 CrossRef CAS PubMed.
- Z. J. Zhu, P. S. Ghosh, O. R. Miranda, R. W. Vachet and V. M. Rotello, J. Am. Chem. Soc., 2008, 130, 14139–14143 CrossRef CAS PubMed.
- F. Qiu, D. W. Jiang, Y. B. Ding, J. Zhu and L. L. Huang, Angew. Chem., Int. Ed., 2008, 47, 5009–5012 CrossRef CAS PubMed.
- (a) Y. N. Xu, H. Wu, C. S. Huang, C. Q. Hao, B. N. Wu, C. C. Miao, S. Chen and N. Q. Jia, Biosens. Bioelectron., 2015, 66, 321–326 CrossRef CAS PubMed; (b) R. Pallela, P. Chandra, H. B. Noh and Y. B. Shim, Biosens. Bioelectron., 2016, 85, 883–890 CrossRef CAS PubMed; (c) J. J. Zhang, F. F. Cheng, T. T. Zheng and J. J. Zhu, Biosens. Bioelectron., 2017, 89, 937–945 CrossRef CAS PubMed.
- (a) B. Yan, S. T. Kim, C. S. Kim, K. Saha, D. F. Moyano, Y. Xing, Y. Jiang, A. L. Roberts, F. S. Alfonso, V. M. Rotello and R. W. Vachet, J. Am. Chem. Soc., 2013, 135, 12564–12567 CrossRef CAS PubMed; (b) M. R. L. Paine, B. L. J. Poad, G. B. Eijkel, D. L. Marshall, S. J. Blanksby, R. M. A. Heeren and S. R. Ellis, Angew. Chem., Int. Ed., 2018, 57, 10530–10534 CrossRef CAS PubMed; (c) S. R. Ellis, C. Wu, J. M. Deeley, X. J. Zhu, R. J. W. Truscott, M. I. H. Panhuis, R. G. Cooks, T. W. Mitchell and S. J. Blanksby, J. Am. Soc. Mass Spectrom., 2010, 21, 2095–2104 CrossRef CAS PubMed; (d) J. H. Yang, P. Chaurand, J. L. Norris, N. A. Porter and R. M. Caprioli, Anal. Chem., 2012, 84, 3689–3695 CrossRef CAS PubMed; (e) S. M. Chen, C. Q. Xiong, H. H. Liu, Q. Q. Wan, J. Hou, Q. He, A. Badu-Tawiah and Z. X. Nie, Nat. Nanotechnol., 2015, 10, 176–182 CrossRef CAS PubMed.
- D. Y. Yin, S. S. Wang, Y. J. He, J. Liu, M. Zhou, J. Ouyang, B. R. Liu, H. Y. Chen and Z. Liu, Chem. Commun., 2015, 51, 17696–17699 RSC.
- F. Dall'Olio, M. Chiricolo, A. D'Errico, E. Gruppioni, A. Altimari, M. Fiorentino and W. F. Grigioni, Glycobiology, 2004, 14, 39 CrossRef PubMed.
Footnote |
| † Electronic supplementary information (ESI) available. See DOI: 10.1039/c8sc04642e |
| This journal is © The Royal Society of Chemistry 2019 |

