
 Open Access Article
 This Open Access Article is licensed under a Creative Commons Attribution-Non Commercial 3.0 Unported Licence
Highly reversible potassium-ion intercalation in tungsten disulfide†‡
Ruding
Zhang§
 ,
Jingze
Bao§
,
Yilong
Pan
and
Chuan-Fu
Sun
*
,
Jingze
Bao§
,
Yilong
Pan
and
Chuan-Fu
Sun
*
CAS Key Laboratory of Design and Assembly of Functional Nanostructures, and Fujian Key Laboratory of Nanomaterials, Fujian Institute of Research on the Structure of Matter, Chinese Academy of Sciences, Fuzhou, Fujian 350002, P.R. China. E-mail: cfsun@fjirsm.ac.cn
First published on 27th December 2018
Abstract
Rechargeable potassium-ion batteries (PIBs) show promise beyond Li-ion technology in large-scale electrical-energy storage due to the abundance and low cost of potassium resources. However, the intercalation of large-size K+ generally results in irreversible structural degradation and short lifespan to the hosts, representing a major obstacle. Here, we report a new electrochemical K+-intercalation host, tungsten disulfide (WS2), which can store 0.62 K+ per formula unit with a reversible capacity of 67 mA h g−1 and well-defined voltage plateaus at an intrinsically safe average operation potential of 0.72 V versus K/K+. In situ X-ray diffraction and ex situ electron microscopy revealed the underlying intercalation mechanism, a relatively small cell volume change (37.81%), and high reversibility of this new battery chemistry. Such characteristics impart WS2 with ultrahigh structural stability and a long lifespan, regardless of deep or fast charging. WS2 achieved record-high cyclability among chalcogenides up to 600 cycles with 89.2% capacity retention at 0.3C, and over 1000 cycles with 96.3% capacity retention and an extraordinary average Coulombic efficiency of 99.90% at 2.2C. This intercalation electrochemistry may open up new opportunities for the design of long-cycle-life and high-safety PIBs.
Introduction
Reversible electrochemical intercalation of metal ions in solids has laid the foundation for rechargeable batteries which are recognized as the key to utilization of ‘clean’ energy.1–3 The well-established lithium-ion batteries (LIBs), for instance, rely dominantly on the (de)intercalation of lithium-ions (Li+) in graphite, LiCoO2, and LiFePO4. These layered solids typically experience small volume changes upon Li+ (de)insertion. Such structural stability enables the realization of the stable electrode–electrolyte interface, long-term cyclability and steady output of electrical energy.1–3 Despite these prominent virtues, the limited abundance of lithium resources (∼0.0017 wt% in the Earth's crust) makes Li+-technology unlikely to meet the continually increasing demands for stationary storage of electric power. This limitation drives the search for cost-effective alternatives beyond Li+ chemistry.4–7 Given the abundance (∼2.09 wt%, ∼1000-times higher than Li) and low cost of potassium resources, potassium-ion batteries (PIBs) in principle provide tremendous potentials in grid-scale energy storage and have recently been receiving rapidly increasing attention.5,8–21K+ has an ionic radius of 1.38 Å, which is ∼1.8-times that of Li+. This larger ionic size makes K+-intercalation behavior apparently differ from its Li+ counterpart, and the (de)insertion of K+ often induces irreversible structural degradation and, thus, a short lifespan to the hosts.5,18 For instance, K+ fails to intercalate in the crystalline FePO4 cathode,22 whereas the graphite anode is ready for K+ insertion but exhibits a large volume expansion (∼61%) and inferior cyclability.5,9,12,23 Therefore, the key challenge lies in the search of host materials that can reversibly intercalate K+ while exhibiting high structural stability.5,10,18,24 To this end, a large number of materials, such as hard/soft carbon,15,25 organic compounds,26,27 Mxenes,28 transition metal oxides/sulfides/phosphates,19,29–33 Prussian Blue and its analogs,10,16,34,35 have been investigated intensively and show promising prospects. Among them, the Prussian Blue analogs could effectively accommodate the structural changes induced by K+ (de)insertion due to a framework structure and are probably the most promising cathode materials to date.10,16,34,35 The currently available anode materials, however, have not yet been able to achieve overall electrochemical performances that match the Prussian Blue analogs, representing a critical issue that needs to be solved for the realization of PIBs.
Here, we report a new electrochemical K+-intercalation host: two-dimensional layered WS2. Our results showed that a maximum of 0.62 K+ readily (de)intercalated in WS2, corresponding to a specific capacity of 67 mA h g−1. This new intercalation chemistry exhibited well-defined voltage plateaus and an average operation potential of 0.72 V versus K/K+. The former favored the steady output of cell voltage and electrical energy, whereas the latter made it intrinsically free from the potassium plating (0 V versus K/K+) that may have caused catastrophic internal short-circuit. In-depth kinetic and mechanistic analyses captured K+ diffusion behavior, the underlying intercalation mechanism, and high reversibility of this new battery chemistry. Upon K+ intercalation, WS2 transformed to K0.62WS2, accompanied with cell volume expansion (37.81%) as small as approximately one-half that of graphite. This feature enabled ultrahigh structural stability and electrochemical cyclability regardless of deep or fast charging, as shown unambiguously by 84.5% capacity retention over 100 cycles at 0.075C and 96.3% capacity retention over 1000 cycles at 2.2C. Moreover, it was observed that the electrochemical K+-(de)intercalation into WS2 largely differed from that of its Li+/Na+ counterparts and provided far more distinct voltage plateaus, thus offering advantages beyond Li/Na-ion technologies.
Results and discussion
Hexagonal 2H-WS2 exhibited a characteristic layered structure with an interlayer spacing of 6.180 Å (Fig. 1A and S1, ESI‡). Two adjacent layers interacted with each other through weak van der Waals interactions, which offered the possibility of introducing K+ into the interlayers, which is a similar working principle to Li+ intercalation into TiS2 in the first prototype rechargeable LIBs.1,2 Commercial WS2 powder was adopted directly for understanding the electrochemical K+-intercalation behavior. Scanning electron microscopy (SEM) and transmission electron microscopy (TEM) revealed that WS2 was in a plate shape with a thickness of ∼100–200 nm and a lateral size of ∼1–3 μm (Fig. 1B, C). X-ray diffraction (XRD) patterns confirmed the P63/mmc structure and the purity of the WS2 materials. The presentation of solely Bragg peaks (002), (004), (006), and (008) indicated a preferential crystallographic orientation of the powder (Fig. 1D), in agreement with the observed plate shape. High-resolution TEM and electron diffraction patterns (EDPs) further verified the hexagonal phase of WS2 (Fig. 1D).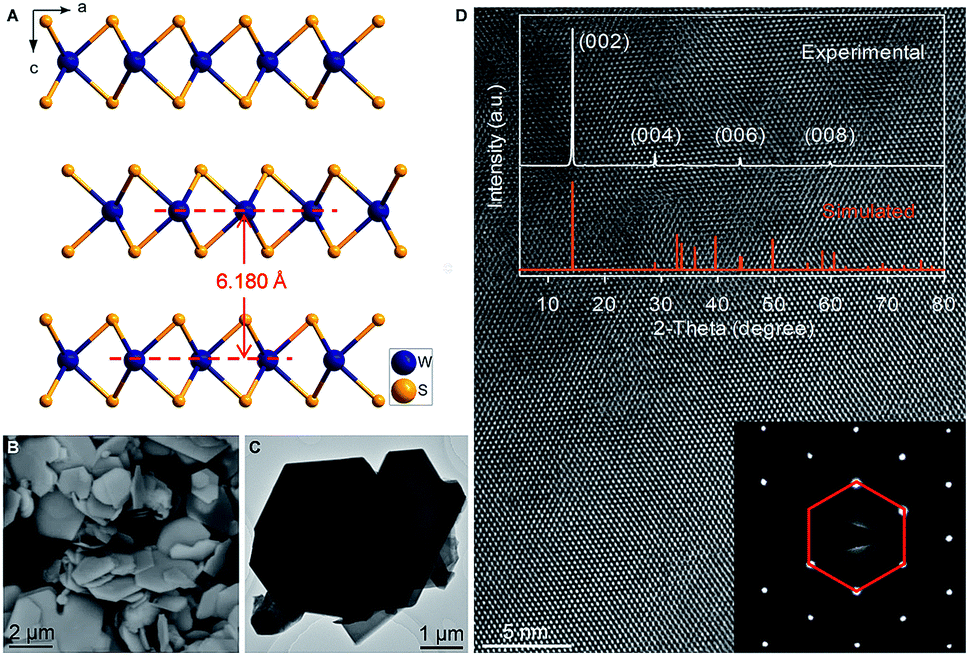 | ||
| Fig. 1 Materials characterization of WS2. (A) Structural view of WS2 along the b-axis showing a characteristic layered structure. (B and C) SEM (B) and TEM (C) images of WS2. (D) XRD pattern, HRTEM image and corresponding EDP pattern of WS2. | ||
WS2 bulk electrodes were prepared through a slurry blade-coating method. They possessed active material loading of 2.48–2.75 mg cm−2, and a specific surface area of 14.0 m2 g−1 given by Brunauer–Emmett–Teller (BET) analysis (Fig. S2, ESI‡). Previously, we demonstrated that a concentrated 5 molar (5 M) electrolyte exhibits higher reduction resistance over that of a 1 M electrolyte, and contributes better electrochemical performance for a bismuth anode.36 Therefore, 5 M potassium bis(trifluoromethylsulfonyl)imide (KTFSI) in diethylene glycol dimethyl ether (DEGDME) was adopted as an electrolyte here. Fig. 2A presents cyclic voltammetry (CV) curves in the initial five cycles at 0.1 mV s−1. The cathodic peaks around 0.5 and 0.36 V in the initial cycle correspond to K+-intercalation in WS2 and the formation of a solid electrolyte interphase (SEI), whereas the two anodic peaks at 0.77 and 1.33 V relate to the deintercalation of K+. After the activation cycle, the overlap of the subsequent CV curves indicated highly reversible K+ (de)intercalation chemistry. At a current density of 5 mA g−1 (rate of ∼0.075C), WS2 delivered an initial reversible capacity of 67 mA h g−1 (or 238 mA h cm−3), which is comparable with that of conventional Prussian Blue analogs, and corresponds to the insertion of 0.62 K+ per formula unit (Fig. 2B). An initial Coulombic efficiency (CE) of 56.6% could be mainly attributed to SEI formation, which is commonly observed in PIB anodes.9,12,13 Even under deep (de)potassiation, WS2 continued to deliver a reversible capacity of 56.6 mA h g−1 after 100 cycles with a capacity retention of 84.5%. The voltage profiles and differential capacity (dQ/dV) curve at the 5th cycle showed a main voltage plateau at 0.93 V and a less evident one at 0.5 V upon K+ insertion, as well as corresponding depotassiation plateaus at 0.65 and 1.2 V (Fig. 2C). The multiple voltage plateaus suggested a stepwise K+-(de)insertion, and the reaction equation can be described as:
| WS2 + 0.62K+ + 0.62e− = K0.62WS2 | (1) |
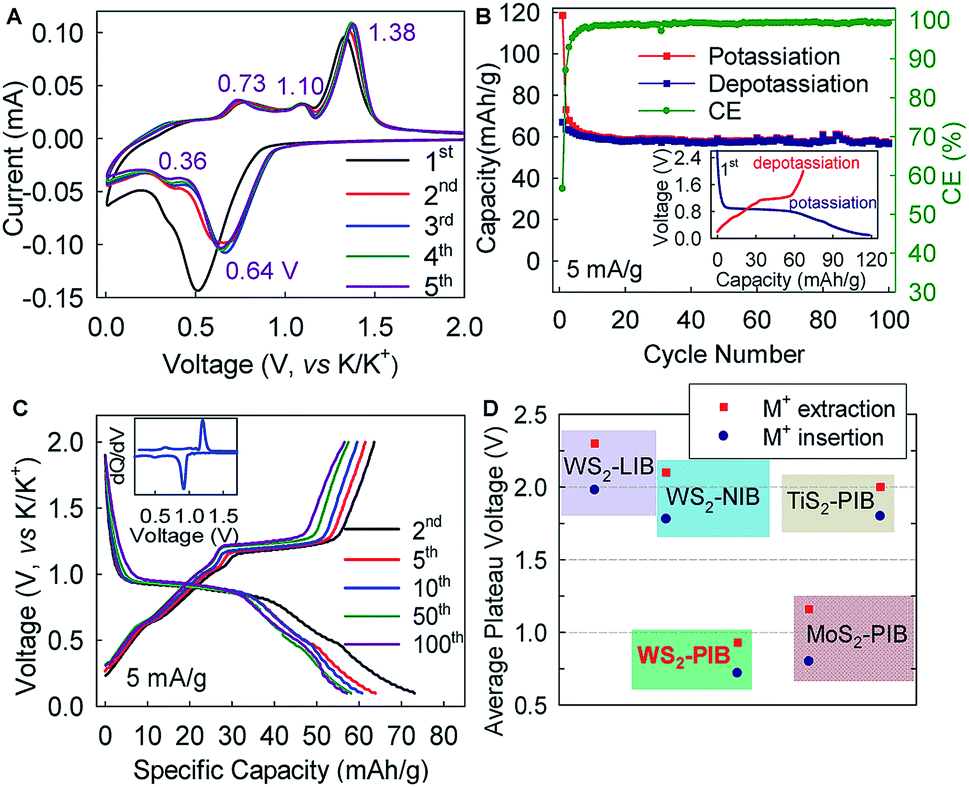 | ||
| Fig. 2 Electrochemical K+ (de)intercalation behavior in WS2. (A) CV profiles of the WS2 electrode at a scan rate of 0.1 mV s−1. (B) Galvanostatic cycling of the WS2 electrode at a current of 5 mA g−1. The inset shows the voltage profile of the first cycle. (C) Voltage profiles of the WS2 electrode at a current of 5 mA g−1. The inset is the corresponding dQ/dV curve at the fifth cycle, which shows characteristic potassiation/depotassiation plateaus at 0.5/0.65 V and 0.93/1.2 V. (D) Average plateau voltage of metal disulfides in LIBs, NIBs, and PIBs. The voltage gaps between M+ insertion (red square) and extraction (blue dot) represent the voltage hysteresis. | ||
The lower average operation potential (0.72/0.93 V) of the WS2 anode could provide higher energy density in full cells compared with those of MoS2 (ref. 29) and TiS2,37,38 whereas a small potential hysteresis of 0.21 V (voltage gap between ion insertion and extraction) generally favors high round-trip energy efficiency (Fig. 2D). Equally important, this average potential made it intrinsically free from the potassium plating (0 V, vs. K/K+) that may have caused catastrophic battery failure.
Interestingly, the electrochemical K+-(de)intercalation into WS2 differed largely from that of its Li+/Na+ counterparts, which occurs at a plateau potential >1.5 V and is typically considered to be cathode chemistry (Fig. 2D and S3, ESI‡).39,40 Moreover, the potential plateaus in a K+ system are far more distinct than those in Li+/Na+ systems,39–41 thereby offering advantages over LIBs/NIBs. In addition, WS2 exhibited a further reduction degradation potential of ∼0.08 V below which reduction of WS2 to W metal occurs (Fig. S4, ESI‡). This potential is ∼0.42 V lower than that of MoS2, indicating higher resistance to reduction degradation. We showed twice that a higher capacity (212 mA h g−1) could be achieved with a cutoff voltage of 0 V, but the preferred flat voltage plateaus became indistinct (Fig. S4, ESI‡). Therefore, the cutoff voltage for battery cycling was set to 0.1 V.
The WS2 anode exhibited considerable rate capability and long-term cyclability. As shown in Fig. 3A, WS2 delivered capacity of ∼60, ∼50, ∼45 and ∼40 mA g−1 at rates of 10, 50, 100, and 200 mA g−1 (0.15C, 0.75C, 1.5C, and 3C), respectively, which correspond to 89.6%, 74.6%, 67.2%, and 59.7% of the maximum capacity. Even at a rate as high as 500 mA g−1 (7.5, which corresponds to a charging time of 8 min), nearly half of the maximum capacity remained achievable. Of equal importance, the reversible capacity returned to ∼60 mA h g−1 after two repeated rate cycles, again confirming the structural stability of WS2 upon K+-(de)intercalation. Moreover, the voltage plateaus were well preserved with relatively small potential polarization even at high rates (Fig. 3B). An average potassiation plateau at 500 mA g−1 was 0.68 V, which is only 0.22 V lower than that at 10 mA g−1. Fig. 3C–G depict long-term cyclability. The WS2 anode achieved a capacity retention of 89.3% over 600 cycles and an average CE of 99.48% at 20 mA g−1 (∼0.3C). At 50 mA g−1, the capacity retention and average CE over 600 cycles reached 96% and 99.51%, respectively. Under higher rates of 100 and 150 mA g−1 (1.5C and 2.2C), remarkable capacity retentions of 90.8% and 96.3%, respectively, were achieved over 1000 cycles with average CE as high as 99.80% and 99.90%. This cyclability is superior to that of all the previously reported chalcogenides, and among the best reported to date for PIB anodes.5,29,31,32,37,38 Such cyclability, together with the considerable rate capability and small polarization (Fig. 3 and S5, ESI‡), suggest the ultrahigh structural stability of WS2 and relatively fast K+ diffusion within it.
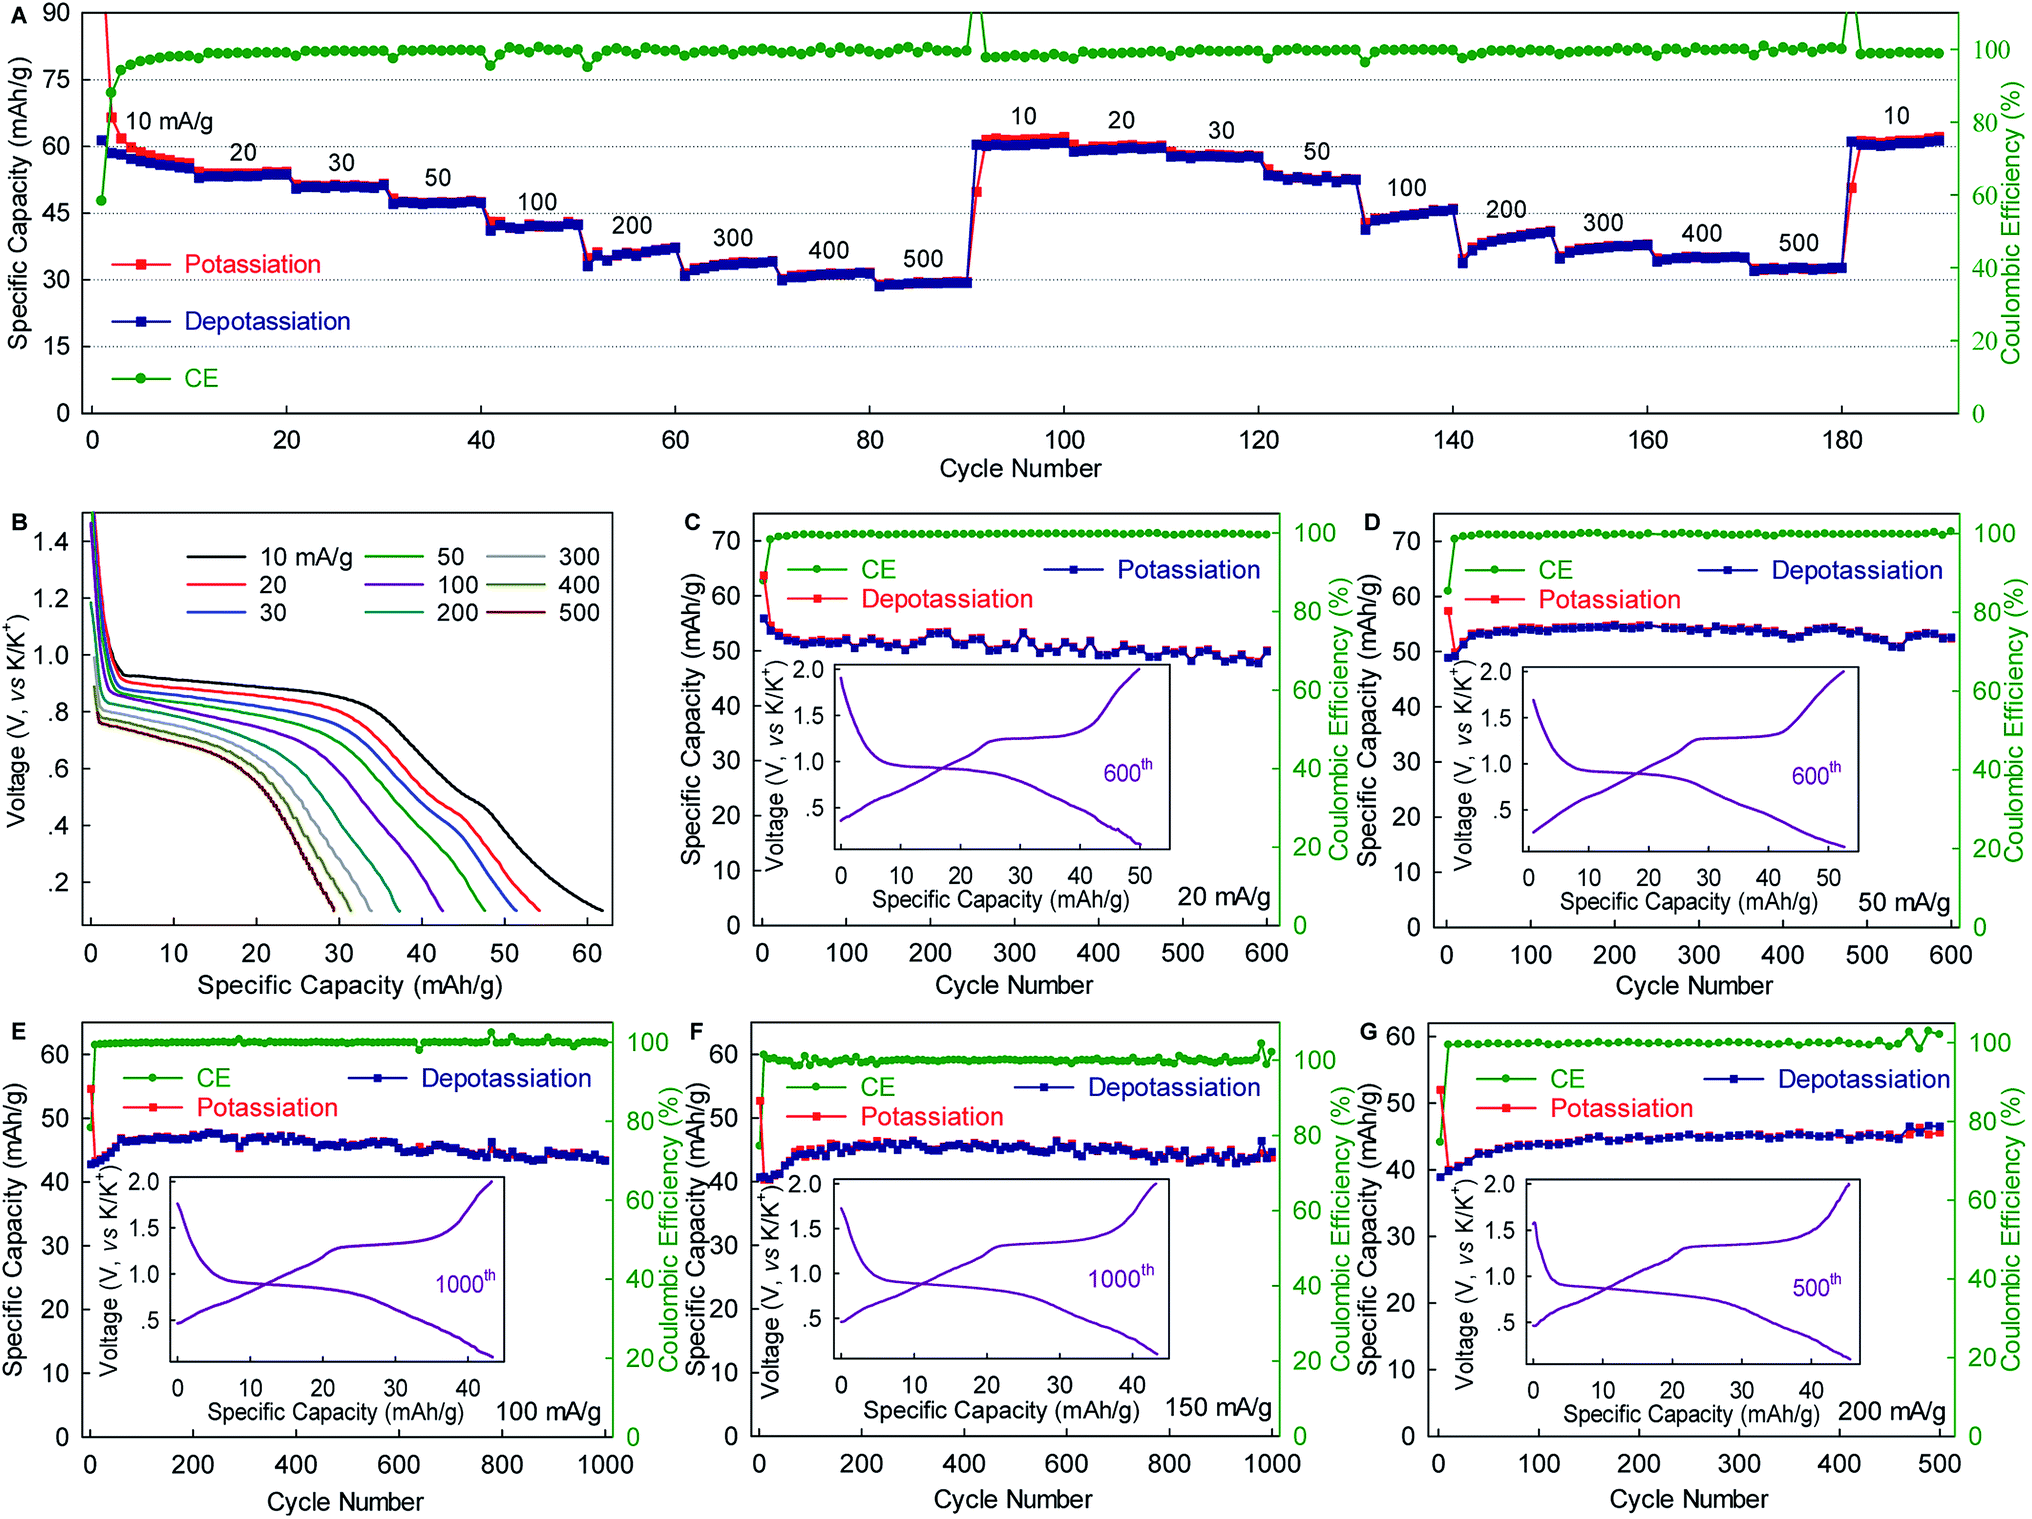 | ||
| Fig. 3 Rate capability and long-term cyclability of WS2. (A) Rate capability. (B) Potassiation voltage profiles at various rates. (C–G) Long-term cyclability at various rates. All batteries were cycled once at 10 mA g−1 for activation. For clarity, those data are not shown here. Insets in C–G show the corresponding voltage profile. | ||
Electrochemical impedance spectroscopy (EIS), rate-scanning CV, and galvanostatic intermittent titration technique (GITT) experiments were conducted to gain further kinetic insights into this K+-(de)intercalation chemistry. Fig. 4A and S6, ESI‡ show that the contact resistance (Rf) related to the ion-diffusion resistance across the SEI layer was estimated to be 31.54 Ω after five-cycle activation. This small Rf suggested relatively fast K+ permeation through the SEI layer, which would have been largely responsible for the excellent rate capability. The charge transfer resistance (Rct) of 1671 Ω was 1.6-times lower than that observed in graphite (4358 Ω),12 indicating faster charge transfer in WS2. The chemical diffusion coefficient of K+ within WS2 was deduced from the rate-scan CV (Fig. 4B, C) according to the Randles–Sevcik equation,42
| ip = (2.69 × 10⁵)n3/2C0AD1/2ν1/2 | (2) |
| DK-ion = (4/πτ) × [nMVM/S]2 × [ΔEs/ΔEt]2 | (3) |
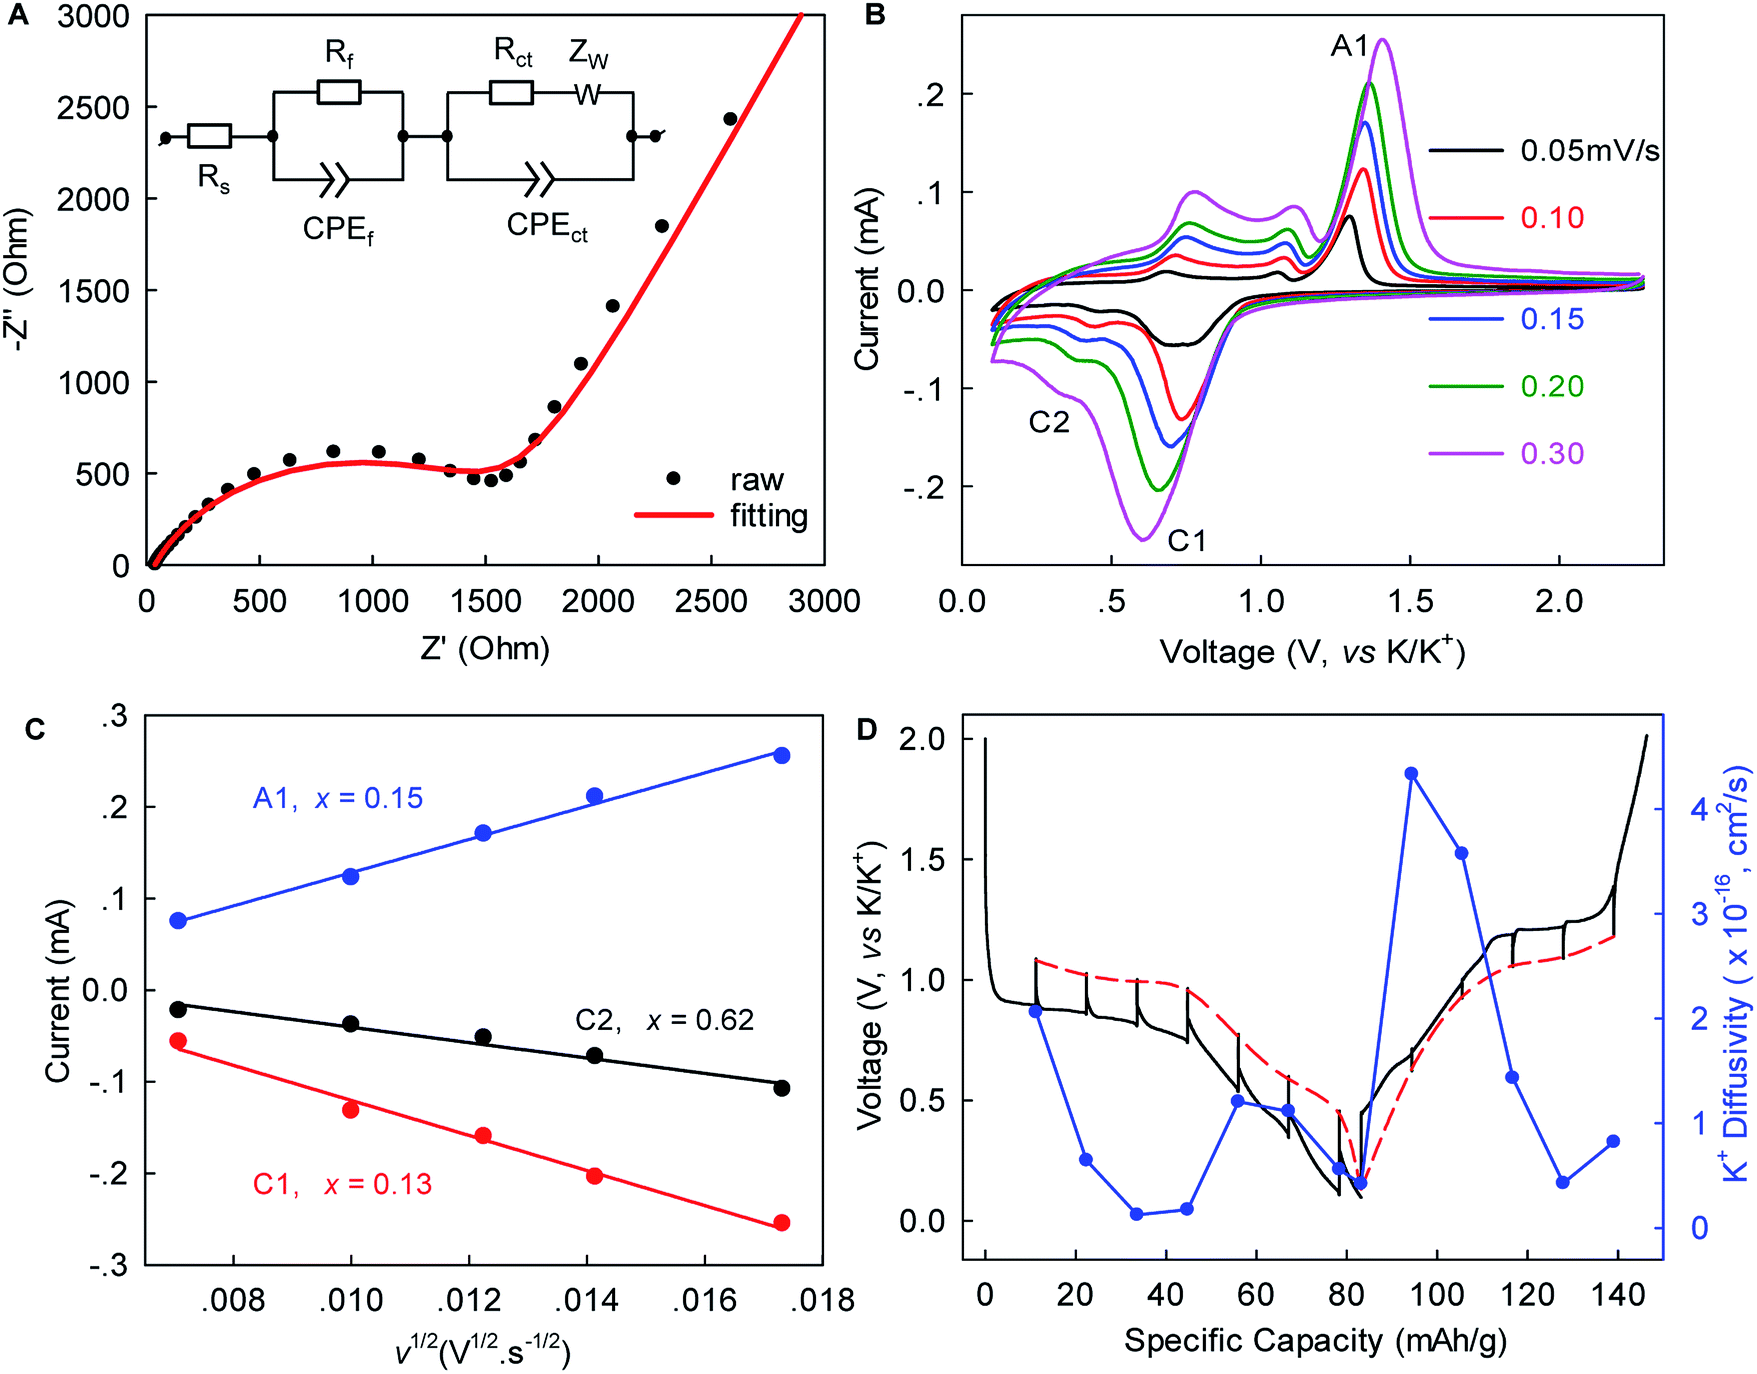 | ||
| Fig. 4 Kinetic analysis of K+ (de)intercalation in WS2. (A) EIS of WS2 after five (de)potassiation cycles. The inset shows the equivalent circuit for data fitting, where Rs, Rf, Rct, CPE, and Zw represent electrolyte resistance, contact resistance, charge-transfer resistance, constant-phase element, and Warburg ion-diffusion resistance, respectively. (B) CV profiles at various scan rates. (C) The peak currents versus the square root of the scan rate for peaks C1, C2 and A1 marked in B. (D) GITT profiles. | ||
Herein, τ is the duration of a constant current pulse; VM and nM are the mole volume and mole number of active materials, respectively; S is the effective contact area of active materials and electrolyte (here, the BET surface area); and ΔEs and ΔEt are the change in the steady-state voltage and overall cell voltage upon applying a current pulse in a single-step GITT experiment, respectively. As shown in Fig. 4D, the GITT study gave DK-ion of the order 10−17 to 10−16 cm2 s−1, similar to the ones derived from the rate-scanning CV results. As the intercalation reaction proceeded, DK-ion decreased with the formation of new-phase KxWS2. A similar trend was observed during the reverse-phase transformation from KxWS2 to WS2. This phenomenon indicated that the diffusion of K-ions became more difficult during phase transitions, which is consistent with previous observations.15 We speculated that the variation of K+ number in the WS2 host induces a change of K+–K+ and K+–WS2 interactions and, consequently, the change of DK-ion. The obtained DK-ion was lower than those for Li+/Na+, which could be attributed to the larger size of K+ (81.6% larger than that of Li+).5 Nevertheless, the benefits from a short diffusion pathway of ∼0.5–1.5 μm (half of the lateral size of WS2) and high rate capability remained achievable, as demonstrated above.
The rate capability and small electrode/electrolyte contact resistance Rf indicated that the SEI layer formed on the WS2 surface was thin, whereas the excellent electrochemical cyclability suggested the high structural stability of WS2 upon repeat K+ (de)insertion. To confirm these hypotheses, ex situ electron microscopy was done. High-resolution (HR)TEM showed that the microstructure and hexagonal crystal structure of WS2 was well preserved even upon deep K+ insertion/extraction (Fig. 5A, B and S7, ESI‡). Bright-field TEM energy-dispersive spectroscopy (EDS) mapping revealed uniform distributions of W and S elements (Fig. 5C, D), whereas a uniform spread of K and F elements on depotassiated WS2 indicated the formation of a SEI layer of thickness ∼3 nm was confirmed by HRTEM (Fig. 5F and S7, ESI‡). Ex situ SEM presented a thick SEI layer on carbon black after 1000 cycles, making the carbon black barely visible. Conversely, much less SEI formation was observed on WS2, the morphology of which was distinctly recognizable (Fig. 5G). This observation consisted of a high average CE of 99.90%, and again confirmed the structural stability of WS2 upon repeated cycling.
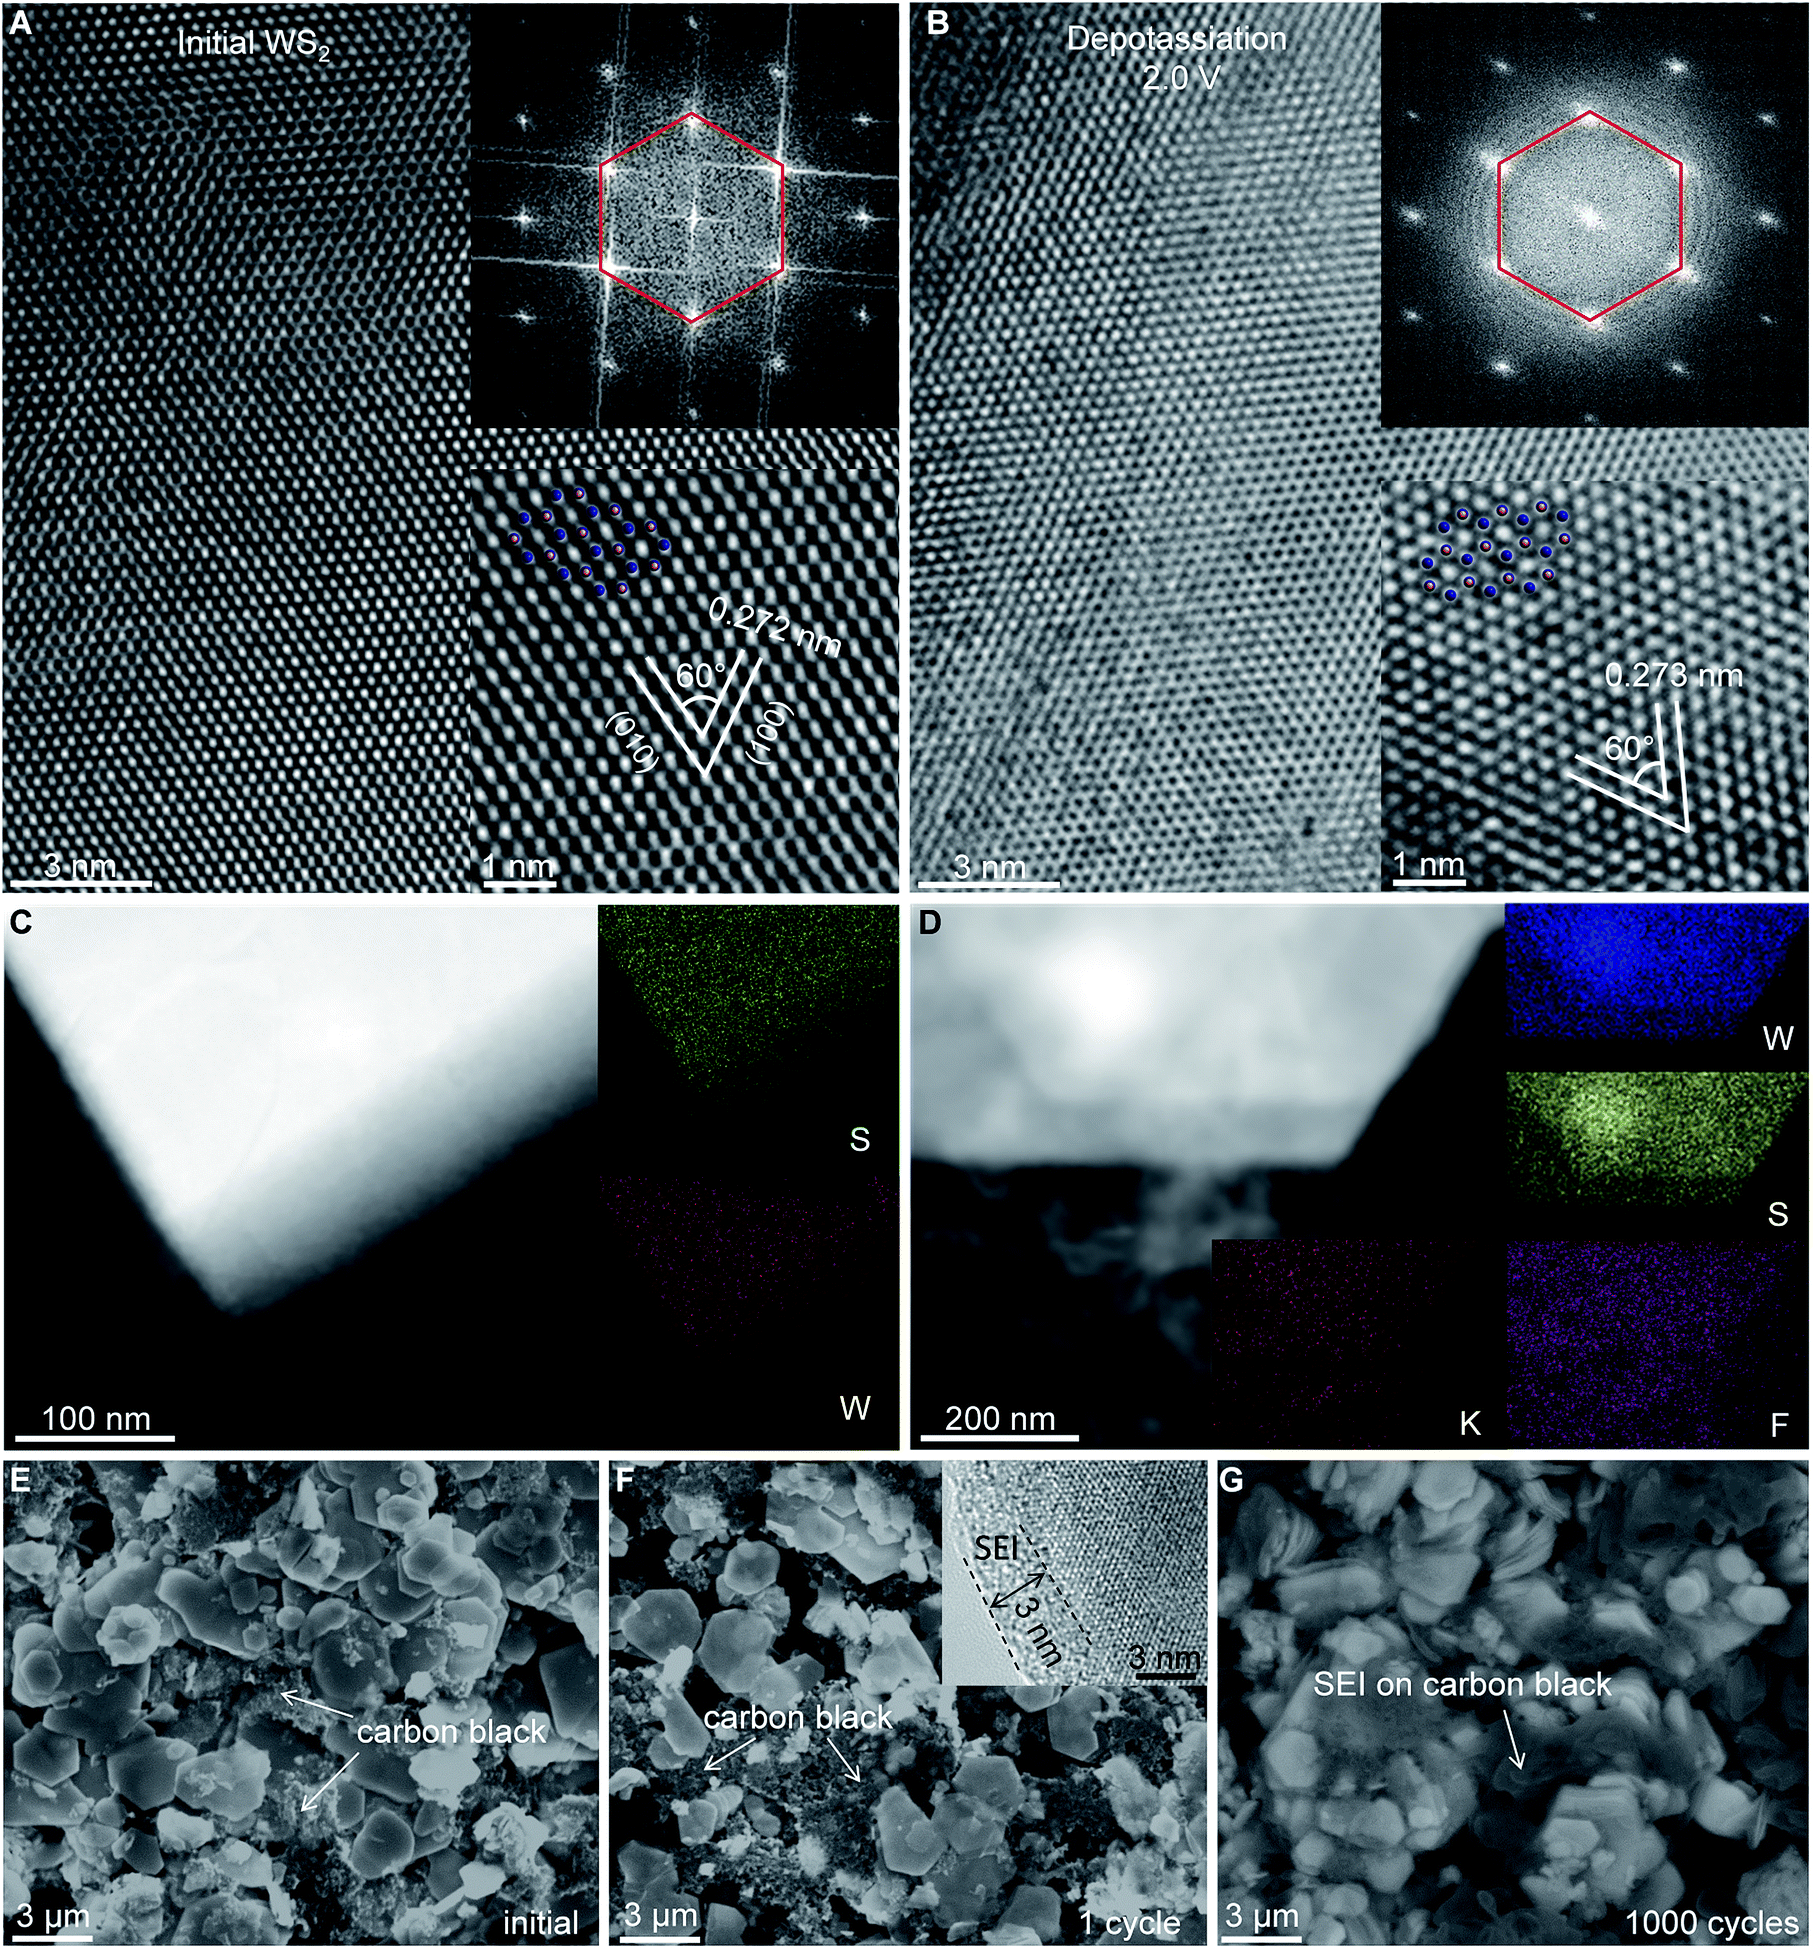 | ||
| Fig. 5 Ex situ electron microscopy resolving the structural evolution of WS2. (A, B) High-resolution TEM images. The insets are the corresponding fast Fourier transformation (FFT) and HRTEM images. The blue and yellow balls represent W and S atoms, respectively. (C, D) Bright-field TEM EDS mapping of initial (C) and depotassiated (D) WS2. (E–G) SEM images of initial (E), single-cycled (F), and 1000-cycled (G) WS2 anodes. The inset in (F) is an HRTEM image showing the SEI layer. | ||
To provide in-depth understanding of the structural stability and mechanistic insights to this K+-(de)intercalation chemistry, in situ XRD and corresponding Rietveld refinement were done. As the K+-intercalation continued (Fig. 6A and S8, ESI‡), the predominant (002) Bragg peak (2θ = 14.34°) became gradually weaker and disappeared completely at 0.1 V. Meanwhile, a new peak named (002′) appeared at 10.69° upon potassiation to ∼0.85 V, and its intensity increased progressively until the completion of intercalation. Conversely, during deintercalation, the (002) peak reappeared at 14.34° accompanying by the degradation and disappearance of the new (002′) peak, which suggested high reversibility of this new K+-intercalation electrochemistry. The same trend was observed for Bragg peak (004), which shifted from 28.88° to 21.33° upon K+-intercalation. These peak shifts indicated increases of indice spacing d002 from 6.185 to 8.266 Å and d004 from 3.091 to 4.166 Å, which corresponded to 33.65% and 34.78% expansion, respectively. In contrast to the peak offset to a small angle, the Bragg peak (006) shifted slightly from 43.94° (d = 2.061 Å) to 44.12° (d = 2.053 Å) upon K+-intercalation and eventually to 43.40° (d = 2.085 Å) upon K+-extraction. A similar changing tendency of peak offset was observed for (100) and (106) reflections, which were originally absent and first appeared at 32.31° and 55.35° upon potassiation to 0.8 and 0.75 V, respectively. Differing from all above-mentioned Bragg peaks, the (008) reflection (2θ = 59.8°) faded out gradually during potassiation and no longer reappeared upon further K+-intercalation or extraction.
Rietveld refinements revealed evolution of the lattice parameters of WS2 (Fig. 6B–E and S9–11, ESI‡). The lattice constants a and b (a = b = 3.156 Å) increased to 3.208 Å upon intercalation of 0.62 K+ (K0.62WS2), which corresponded to a negligible lattice expansion of 1.65%. In sharp contrast, the constant c showed an increase of 33.38% (from 12.344 to 16.464 Å) upon transforming to K0.62WS2, which is consistent with the evolution of indice spacing d002 (from 6.185 to 8.266 Å) predicted based on the Bragg-peak position. Overall, the cell volume evolved from 106.478 to 146.735 Å3 with a relatively small expansion of 37.81%, which is approximately one-half that of graphite and favors high electrochemical cyclability. The K+-intercalated phase K0.62WS2 maintained a hexagonal structure with a space group P![[6 with combining macron]](https://www.rsc.org/images/entities/char_0036_0304.gif) m2, and staging behavior was not observed during K+-intercalation, which is similar to the observation in MoS2 but distinct to graphite.9,29 In addition, an intermediate phase was not observed during K+-intercalation, which differs from K+-intercalated MoS2, which exhibits an intermediate phase having a similar layered structure to K0.4MoS2.29 Upon K+-extraction, constants a, c and the cell volume shrank to 3.147 Å, 12.412 Å, and 106.455 Å3, respectively, all of which were almost identical to the originals. Also, the K+-extracted WS2 transformed back to a hexagonal P63/mmc structure. The observed evolution and restitution of lattice parameters and crystal structure demonstrated the reaction mechanism and high reversibility of K+ (de)intercalation in layered WS2 which should be directly responsible for its high structural stability, long-term cyclability, rate-capability, and Coulombic efficiency.
m2, and staging behavior was not observed during K+-intercalation, which is similar to the observation in MoS2 but distinct to graphite.9,29 In addition, an intermediate phase was not observed during K+-intercalation, which differs from K+-intercalated MoS2, which exhibits an intermediate phase having a similar layered structure to K0.4MoS2.29 Upon K+-extraction, constants a, c and the cell volume shrank to 3.147 Å, 12.412 Å, and 106.455 Å3, respectively, all of which were almost identical to the originals. Also, the K+-extracted WS2 transformed back to a hexagonal P63/mmc structure. The observed evolution and restitution of lattice parameters and crystal structure demonstrated the reaction mechanism and high reversibility of K+ (de)intercalation in layered WS2 which should be directly responsible for its high structural stability, long-term cyclability, rate-capability, and Coulombic efficiency.
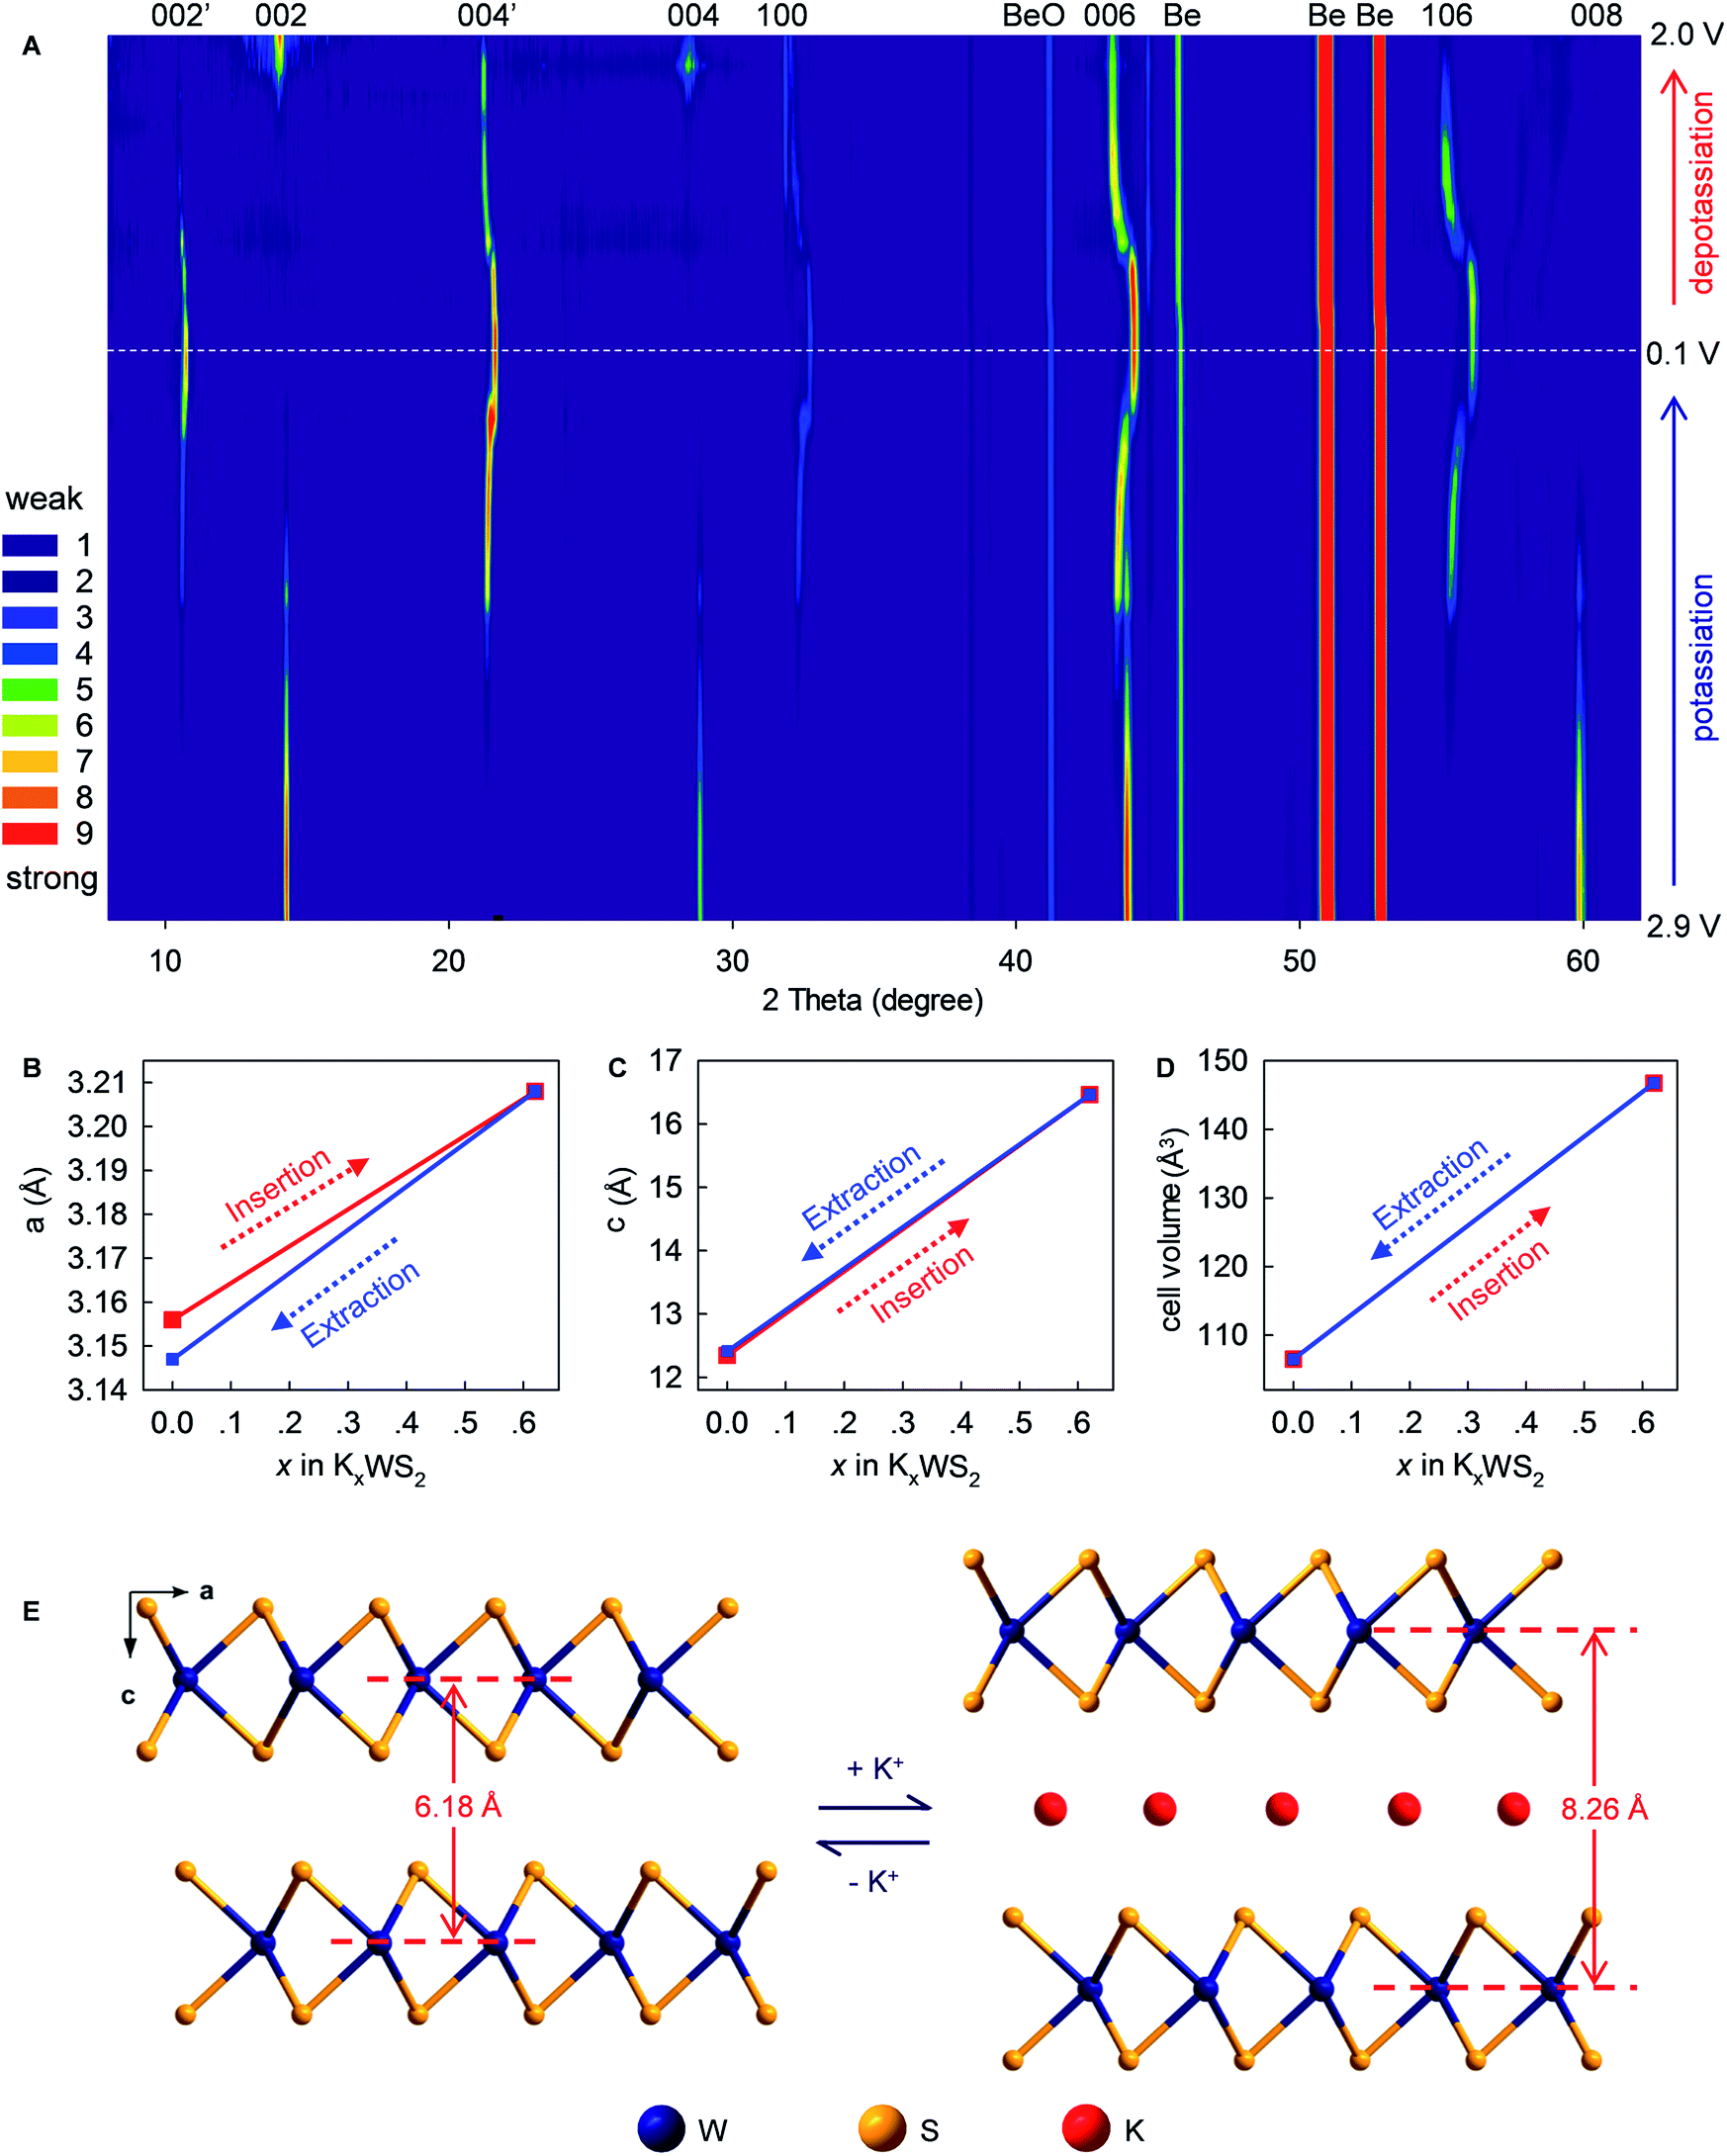 | ||
| Fig. 6 Mechanistic studies of K+ (de)intercalation in WS2. (A) In situ XRD patterns collected during the first (de)potassiation cycle. (B–D) Evolution in lattice constants of WS2 upon cycling. The values derived from Rietveld refinements. (E) Structural evolution of WS2 upon K+ (de)intercalation (schematic). | ||
As a proof-of-concept, we further fabricated full-cell batteries comprising a cathode of the Prussian Blue analog K1.98Mn[Fe(CN)6]0.92 (ref. 10) and the WS2 anode. The full cells (Fig. 7) could deliver an average discharge voltage of ∼2.9 V, an initial discharge capacity of ∼40 mA h g−1 and energy density of ∼115 W h kg−1 based on the total mass of the cathode and anode. The capacity and energy density stabilized gradually to 32 mA h g−1 and 92 W h kg−1, respectively, after five cycles. These prototype full-cell batteries suggest promising applications of the WS2 anode in practical PIBs.
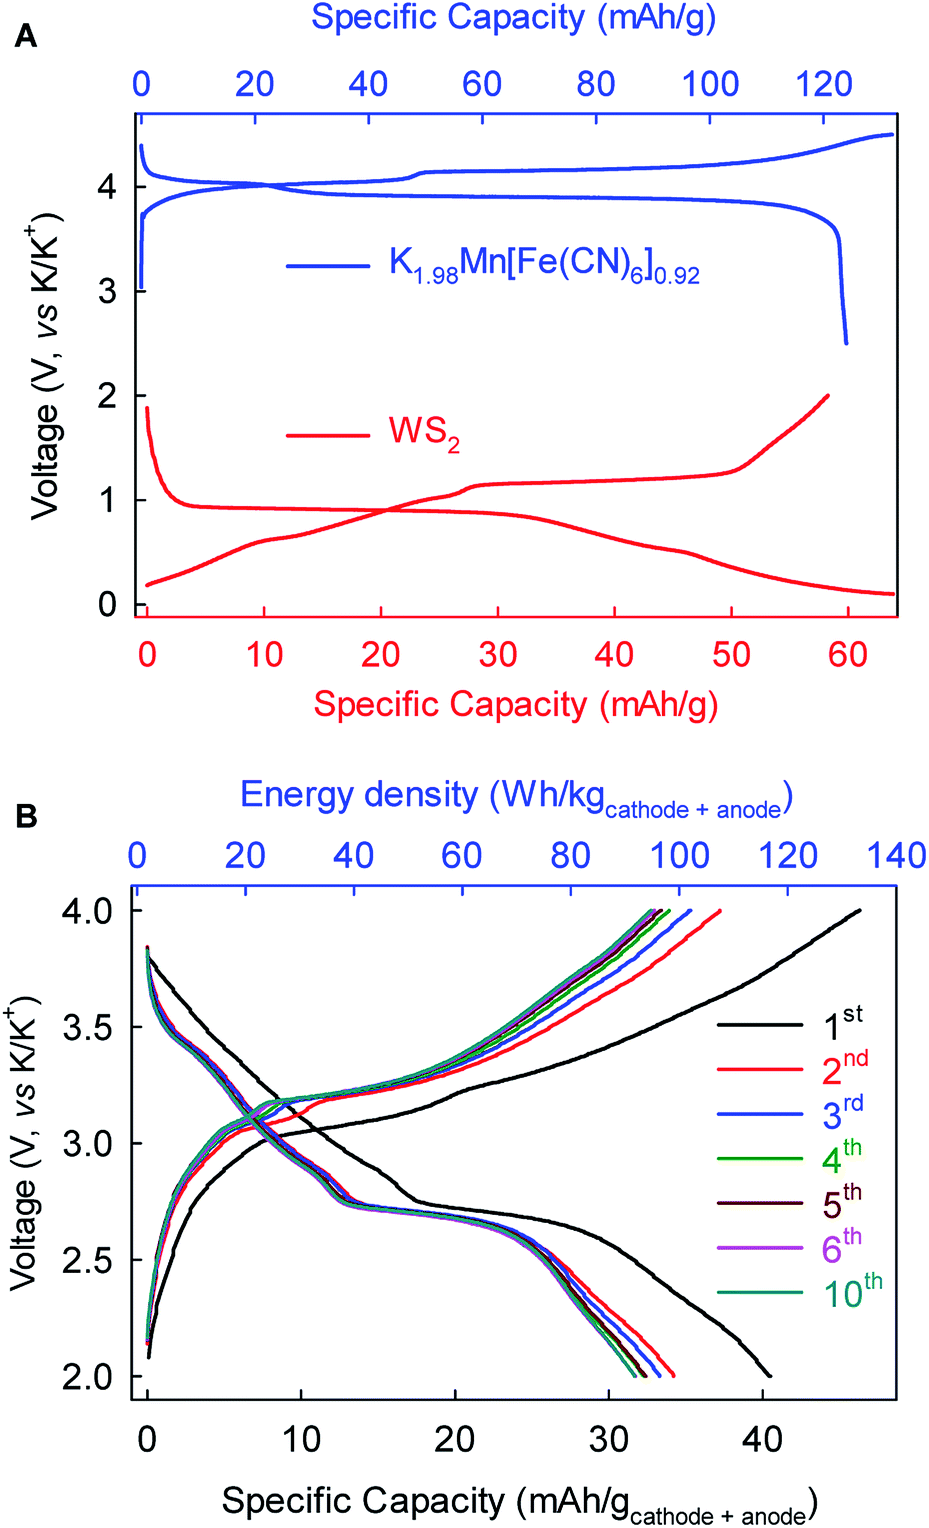 | ||
Fig. 7 (+) K1.98Mn[Fe(CN)6]0.92||WS2 (−) full-cell K-ion batteries. (A) Voltage profiles of K1.98Mn[Fe(CN)6]0.92 cathode and WS2 anode at 10 mA g−1. (B) Electrochemical performance of the full-cell battery at 10 mA g−1. The mass ratio of cathode![[thin space (1/6-em)]](https://www.rsc.org/images/entities/char_2009.gif) :anode is 1.7:1. :anode is 1.7:1. | ||
Conclusions
We demonstrated that layered WS2 could be utilized as a K+-intercalation host and store 0.62 K+ per formula unit with well-defined voltage plateaus at an intrinsically safe average operation potential of 0.72 V (versus K/K+). Mechanistic analyses confirmed the underlying intercalation mechanism and high reversibility of this battery chemistry, which accounted for its ultrahigh structural stability, electrochemical cyclability (96.3% capacity retention over 1000 cycles) and an extraordinary average Coulombic efficiency (99.90%). Our results reveal the promising prospect of this new K+-intercalation electrochemistry, and may shed light on PIB development for large-scale energy-storage applications.Conflicts of interest
The authors declare no competing financial interest.Acknowledgements
This work was financially supported by the National Natural Science Foundation of China (21771180, 51702318) and Natural Science Foundation of Fujian Province (2018J01031).Notes and references
- J. M. Tarascon and M. Armand, Nature, 2001, 414, 359–367 CrossRef CAS PubMed.
- J. B. Goodenough and Y. Kim, Chem. Mater., 2010, 22, 587–603 CrossRef CAS.
- B. Dunn, H. Kamath and J. M. Tarascon, Science, 2011, 334, 928–935 CrossRef CAS PubMed.
- Y. Wang, R. Chen, T. Chen, H. Lv, G. Zhu, L. Ma, C. Wang, Z. Jin and J. Liu, Energy Storage Mater, 2016, 4, 103–129 CrossRef.
- X. Wu, D. P. Leonard and X. Ji, Chem. Mater., 2017, 29, 5031–5042 CrossRef CAS.
- T. Koketsu, J. Ma, B. J. Morgan, M. Body, C. Legein, W. Dachraoui, M. Giannini, A. Demortiere, M. Salanne, F. Dardoize, H. Groult, O. J. Borkiewicz, K. Chapman, P. Strasser and D. Dambournet, Nat. Mater., 2017, 16, 1142–1148 CrossRef CAS PubMed.
- S. Chen, C. Wu, L. Shen, C. Zhu, Y. Huang, K. Xi, J. Maier and Y. Yu, Adv. Mater., 2017, 29, 1700431 CrossRef PubMed.
- A. Eftekhari, J. Power Sources, 2004, 126, 221–228 CrossRef CAS.
- Z. Jian, W. Luo and X. Ji, J. Am. Chem. Soc., 2015, 137, 11566–11569 CrossRef CAS PubMed.
- L. Xue, Y. Li, H. Gao, W. Zhou, X. Lu, W. Kaveevivitchai, A. Manthiram and J. B. Goodenough, J. Am. Chem. Soc., 2017, 139, 2164–2167 CrossRef CAS PubMed.
- N. Xiao, W. D. McCulloch and Y. Wu, J. Am. Chem. Soc., 2017, 139, 9475–9478 CrossRef CAS PubMed.
- J. Zhao, X. Zou, Y. Zhu, Y. Xu and C. Wang, Adv. Funct. Mater., 2016, 26, 8103–8110 CrossRef CAS.
- Q. Zhang, J. Mao, W. K. Pang, T. Zheng, V. Sencadas, Y. Chen, Y. Liu and Z. Guo, Adv. Energy Mater., 2018, 1703288 CrossRef.
- X. Wang, X. Xu, C. Niu, J. Meng, M. Huang, X. Liu, Z. Liu and L. Mai, Nano Lett., 2017, 17, 544–550 CrossRef CAS PubMed.
- Z. Jian, Z. Xing, C. Bommier, Z. Li and X. Ji, Adv. Energy Mater., 2016, 6, 1501874 CrossRef.
- D. Su, A. McDonagh, S. Z. Qiao and G. Wang, Adv. Mater., 2017, 29, 1604007 CrossRef PubMed.
- K. Lei, F. Li, C. Mu, J. Wang, Q. Zhao, C. Chen and J. Chen, Energy Environ. Sci., 2017, 10, 552–557 RSC.
- A. Eftekhari, Z. Jian and X. Ji, ACS Appl. Mater. Interfaces, 2017, 9, 4404–4419 CrossRef CAS PubMed.
- J. Han, Y. Niu, S. J. Bao, Y. N. Yu, S. Y. Lu and M. Xu, Chem. Commun., 2016, 2, 11661–11664 RSC.
- H. Kim, J. C. Kim, M. Bianchini, D. H. Seo, J. Rodriguez-Garcia and G. Ceder, Adv. Energy Mater., 2017, 1702384 Search PubMed.
- K. Lei, C. Wang, L. Liu, Y. Luo, C. Mu, F. Li and J. Chen, Angew. Chem., Int. Ed., 2018, 57, 4687–4691 CrossRef CAS PubMed.
- V. Mathew, S. Kim, J. Kang, J. Gim, J. Song, J. P. Baboo, W. Park, D. Ahn, J. Han, L. Gu, Y. Wang, Y. S. Hu, Y. K. Sun and J. Kim, NPG Asia Mater., 2014, 6, e138 CrossRef CAS.
- W. Luo, J. Wan, B. Ozdemir, W. Bao, Y. Chen, J. Dai, H. Lin, Y. Xu, F. Gu, V. Barone and L. Hu, Nano Lett., 2015, 15, 7671–7677 CrossRef CAS PubMed.
- H. Kim, J. C. Kim, S.-H. Bo, T. Shi, D. H. Kwon and G. Ceder, Adv. Energy Mater., 2017, 7, 1700098 CrossRef.
- Z. Jian, S. Hwang, Z. Li, A. S. Hernandez, X. Wang, Z. Xing, D. Su and X. Ji, Adv. Funct. Mater., 2017, 27, 1700324 CrossRef.
- K. Lei, F. Li, C. Mu, J. Wang, Q. Zhao, C. Chen and J. Chen, Energy Environ. Sci., 2017, 10, 552–557 RSC.
- Q. Deng, J. Pei, C. Fan, J. Ma, B. Cao, C. Li, Y. Jin, L. Wang and J. Li, Nano Energy, 2017, 33, 350–355 CrossRef CAS.
- D. Er, J. Li, M. Naguib, Y. Gogotsi and V. B. Shenoy, ACS Appl. Mater. Interfaces, 2014, 6, 11173–11179 CrossRef CAS PubMed.
- X. Ren, Q. Zhao, W. D. McCulloch and Y. Wu, Nano Res., 2017, 10, 1313–1321 CrossRef CAS.
- J. Han, M. Xu, Y. Niu, G. N. Li, M. Wang, Y. Zhang, M. Jia and C. M. Li, Chem. Commun., 2016, 52, 11274–11276 RSC.
- J. Zhou, L. Wang, M. Yang, J. Wu, F. Chen, W. Huang, N. Han, H. Ye, F. Zhao, Y. Li and Y. Li, Adv. Mater., 2017, 29, 1702061 CrossRef PubMed.
- C. Yang, J. Feng, F. Lv, J. Zhou, C. Lin, K. Wang, Y. Zhang, Y. Yang, W. Wang, J. Li and S. Guo, Adv. Mater., 2018, 30, 1800036 CrossRef PubMed.
- W. Wang, B. Jiang, C. Qian, F. Lv, J. Feng, J. Zhou, K. Wang, C. Yang, Y. Yang and S. Guo, Adv. Mater., 2018, 30, 1801812 CrossRef PubMed.
- G. He and L. F. Nazar, ACS Energy Lett., 2017, 2, 1122–1127 CrossRef.
- C. Zhang, Y. Xu, M. Zhou, L. Liang, H. Dong, M. Wu, Y. Yang and Y. Lei, Adv. Funct. Mater., 2017, 27, 1604307 CrossRef.
- R. Zhang, J. Bao, Y. Wang and C. F. Sun, Chem. Sci., 2018, 9, 6193–6198 RSC.
- B. Tian, W. Tang, K. Leng, Z. Chen, S. J. R. Tan, C. Peng, G. H. Ning, W. Fu, C. Su, G. W. Zheng and K. P. Loh, ACS Energy Lett., 2017, 2, 1835–1840 CrossRef CAS.
- L. Wang, J. Zou, S. Chen, G. Zhou, J. Bai, P. Gao, Y. Wang, X. Yu, J. Li, Y.-S. Hu and H. Li, Energy Storage Mater., 2018, 12, 216–222 CrossRef.
- Y. Wang, D. Kong, W. Shi, B. Liu, G. J. Sim, Q. Ge and H. Y. Yang, Adv. Energy Mater., 2016, 6, 1601057 CrossRef.
- K. Shiva, H. S. S. R. Matte, H. B. Rajendra, A. J. Bhattacharyya and C. N. R. Rao, Nano Energy, 2013, 2, 787–793 CrossRef CAS.
- X. Xu, W. Liu, Y. Kim and J. Cho, Nano Today, 2014, 9, 604–630 CrossRef CAS.
- D. Y. W. Yu, C. Fietzek, W. Weydanz, K. Donoue, T. Inoue, H. Kurokawa and S. Fujitani, J. Electrochem. Soc., 2007, 154, A253–A257 CrossRef CAS.
- W. Weppner and R. A. Huggins, J. Electrochem. Soc., 1977, 12, 1569–1578 CrossRef.
Footnotes |
| † Dedicated to Prof. Jin-Shun Huang on the occasion of his 80th birthday. |
| ‡ Electronic supplementary information (ESI) available. See DOI: 10.1039/c8sc04350g |
| § The authors contributed equally to this work. |
| This journal is © The Royal Society of Chemistry 2019 |