
 Open Access Article
 This Open Access Article is licensed under a Creative Commons Attribution-Non Commercial 3.0 Unported Licence
Finding intersections between electronic excited state potential energy surfaces with simultaneous ultrafast X-ray scattering and spectroscopy†
Kasper S.
Kjær
 *abc,
Tim B.
Van Driel
d,
Tobias C. B.
Harlang
bc,
Kristjan
Kunnus
a,
Elisa
Biasin
b,
Kathryn
Ledbetter
a,
Robert W.
Hartsock
a,
Marco E.
Reinhard
a,
Sergey
Koroidov
a,
Lin
Li
a,
Mads G.
Laursen
b,
Frederik B.
Hansen
b,
Peter
Vester
b,
Morten
Christensen
b,
Kristoffer
Haldrup
b,
Martin M.
Nielsen
b,
Asmus O.
Dohn
e,
Mátyás I.
Pápai
ef,
Klaus B.
Møller
e,
Pavel
Chabera
c,
Yizhu
Liu
cg,
Hideyuki
Tatsuno
c,
Cornelia
Timm
c,
Martin
Jarenmark
h,
Jens
Uhlig
c,
Villy
Sundstöm
c,
Kenneth
Wärnmark
g,
Petter
Persson
i,
Zoltán
Németh
f,
Dorottya Sárosiné
Szemes
f,
Éva
Bajnóczi
f,
György
Vankó
f,
Roberto
Alonso-Mori
d,
James M.
Glownia
d,
Silke
Nelson
d,
Marcin
Sikorski
d,
Dimosthenis
Sokaras
j,
Sophie E.
Canton
kl,
Henrik T.
Lemke
dm and
Kelly J.
Gaffney
*aj
*abc,
Tim B.
Van Driel
d,
Tobias C. B.
Harlang
bc,
Kristjan
Kunnus
a,
Elisa
Biasin
b,
Kathryn
Ledbetter
a,
Robert W.
Hartsock
a,
Marco E.
Reinhard
a,
Sergey
Koroidov
a,
Lin
Li
a,
Mads G.
Laursen
b,
Frederik B.
Hansen
b,
Peter
Vester
b,
Morten
Christensen
b,
Kristoffer
Haldrup
b,
Martin M.
Nielsen
b,
Asmus O.
Dohn
e,
Mátyás I.
Pápai
ef,
Klaus B.
Møller
e,
Pavel
Chabera
c,
Yizhu
Liu
cg,
Hideyuki
Tatsuno
c,
Cornelia
Timm
c,
Martin
Jarenmark
h,
Jens
Uhlig
c,
Villy
Sundstöm
c,
Kenneth
Wärnmark
g,
Petter
Persson
i,
Zoltán
Németh
f,
Dorottya Sárosiné
Szemes
f,
Éva
Bajnóczi
f,
György
Vankó
f,
Roberto
Alonso-Mori
d,
James M.
Glownia
d,
Silke
Nelson
d,
Marcin
Sikorski
d,
Dimosthenis
Sokaras
j,
Sophie E.
Canton
kl,
Henrik T.
Lemke
dm and
Kelly J.
Gaffney
*aj
aPULSE Institute, SLAC National Accelerator Laboratory, Stanford University, Menlo Park, California 94025, USA. E-mail: kaspersk@gmail.com; kgaffney@slac.stanford.edu
bDepartment of Physics, Technical University of Denmark, DK-2800, Lyngby, Denmark
cDepartment of Chemical Physics, Lund University, P.O. Box 124, 22100 Lund, Sweden
dLCLS, SLAC National Accelerator Laboratory, Menlo Park, California 94025, USA
eScience Institute, University of Iceland, 107 Reykjavík, Iceland
fWigner Research Centre for Physics, Hungarian Academy of Sciences, P.O. Box 49, H-1525 Budapest, Hungary
gCentre for Analysis and Synthesis, Department of Chemistry, Lund University, P.O. Box 124, 22100 Lund, Sweden
hDepartment of Geology, Department of Chemistry, Lund University, 223 62 Lund, Sweden
iTheoretical Chemistry Division, Department of Chemistry, Lund University, P.O. Box 124, 22100 Lund, Sweden
jSSRL, SLAC National Accelerator Laboratory, Menlo Park, California 94025, USA
kELI-ALPS, ELI-HU Non-Profit Ltd., Dugonics ter 13, Szeged 6720, Hungary
lFS-ATTO, Deutsches Elektronen-Synchrotron (DESY), Notkestrasse 85, D-22607 Hamburg, Germany
mSwissFEL, Paul Scherrer Institut, Villigen PSI 5232, Switzerland
First published on 22nd April 2019
Abstract
Light-driven molecular reactions are dictated by the excited state potential energy landscape, depending critically on the location of conical intersections and intersystem crossing points between potential surfaces where non-adiabatic effects govern transition probabilities between distinct electronic states. While ultrafast studies have provided significant insight into electronic excited state reaction dynamics, experimental approaches for identifying and characterizing intersections and seams between electronic states remain highly system dependent. Here we show that for 3d transition metal systems simultaneously recorded X-ray diffuse scattering and X-ray emission spectroscopy at sub-70 femtosecond time-resolution provide a solid experimental foundation for determining the mechanistic details of excited state reactions. In modeling the mechanistic information retrieved from such experiments, it becomes possible to identify the dominant trajectory followed during the excited state cascade and to determine the relevant loci of intersections between states. We illustrate our approach by explicitly mapping parts of the potential energy landscape dictating the light driven low-to-high spin-state transition (spin crossover) of [Fe(2,2′-bipyridine)3]2+, where the strongly coupled nuclear and electronic dynamics have been a source of interest and controversy. We anticipate that simultaneous X-ray diffuse scattering and X-ray emission spectroscopy will provide a valuable approach for mapping the reactive trajectories of light-triggered molecular systems involving 3d transition metals.
Introduction
Potential energy surfaces dictate molecular and chemical dynamics. For chemical reactions on the electronic ground state potential, transition state theory usually provides a strong foundation for understanding chemical reactivity because intra-well equilibration precedes chemical reaction and reactive trajectories proceed along adiabatic trajectories through the transition state with minimal damping.1–3 Chemical reactions on electronic excited state potentials differ fundamentally from those on the electronic ground state potential. Reactions can proceed faster than excited state equilibration and reaction dynamics often depend critically on the location of intersections between potential energy surfaces (PES) where non-adiabatic effects govern the transition probabilities between distinct electronic state potential energy surfaces.4–7 These points of intersection can be seen as the analog of the transition state for electronic excited state chemical reactions and understanding the reaction mechanism of electronic excited states entails identifying the location of these intersections.Robustly identifying the location of intersections and weakly avoided crossings that control the relaxation dynamics of electronic excited states has long been a goal and challenge of ultrafast photochemical studies.7–9 Landmark studies by Zewail and co-workers on the photodissociation of NaI8,10 and Fleming and co-workers on the photodissociation of I2 in solution11 demonstrated the ability of femtosecond spectroscopy in the visible and UV to identify the diatomic bond length where population transfer between distinct electronic states occurred. The extension of these methods to more complex photochemical reaction mechanisms and molecular systems has been widely successful, but the extraction of quantitative information about excited state reactive trajectories has proven much more challenging. Addressing this challenge requires the development of more direct and differentiated probes of electronic and nuclear dynamics. With the advent of ultrafast X-ray laser sources,12 for which the time-resolution of solution-state experiments was recently pushed below 30 femtoseconds,13 powerful X-ray scattering and spectroscopy tools for characterizing steady state nuclear and electronic structure can now be extended to measure ultrafast electronic transitions and nuclear dynamics.13–22
This work uses simultaneous Fe 3p–1s (Kβ) X-ray emission spectroscopy (XES) and X-ray diffuse scattering (XDS) measurements (Fig. 1C), first demonstrated by Canton et al.,20 to quantify the electronic excited state trajectories of [Fe(bpy)3]2+. For 3d transition metal centered molecular systems, time-resolved Kβ XES accesses the electronic spin moment on the metal center1,23,24 and time-resolved XDS accesses the dominant changes in intramolecular nuclear structure around the metal center,2,3,25,26 respectively. Fits of the XES and XDS data enable explicit quantification of electronic and structural degrees of freedom. Fitting the dynamics of these quantified parameters makes it possible to retrieve unambiguous mechanistic information on the ensemble of electronic excited state trajectories. By optimizing a model-description for the excited state relaxation on multiple potential energy surfaces, against the quantified electronic and structural parameters, it becomes possible to identify the dominant trajectory followed during electronic excited state relaxation and the relevant loci of intersections between electronic states from the experimental results. If the excited state cascade transitions between two surfaces more than once with different loci of intersection, these start revealing the seam of intersection in multidimensional reaction coordinate space.
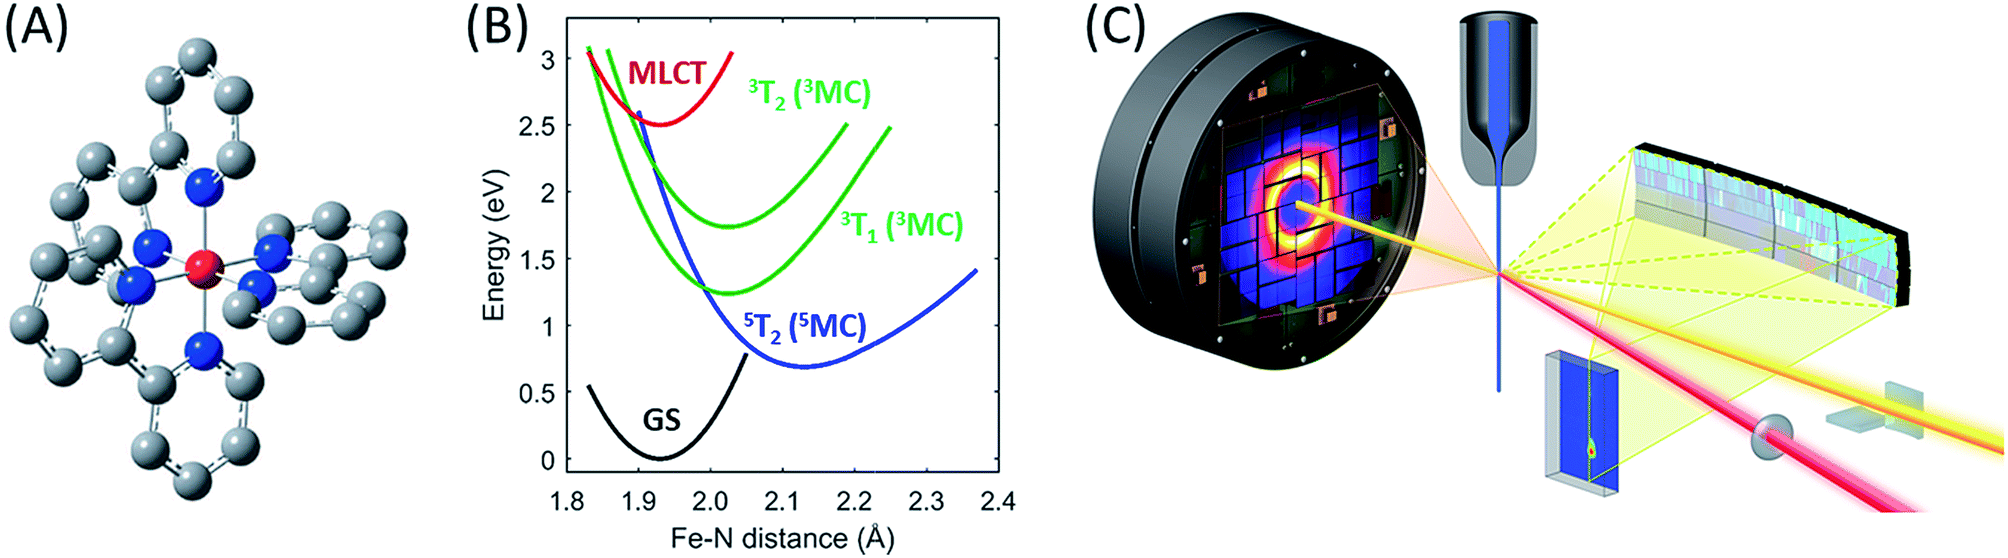 | ||
| Fig. 1 The [Fe(bpy)3]2+ complex under investigation, Fe (red), N (blue), C (grey), H not shown (A), its most important ground and excited state potential energies as a function of Fe–N bond length (B) from Sousa et al.35 and the experimental setup (C). | ||
To showcase this methodology, we have characterized the ensemble of electronic excited state trajectories and quantified key parameters for the excited state potential energy surfaces governing the photo-induced spin crossover process in the prototypical Fe(II) low-spin complex [Fe(2,2′-bipyridine)3]2+ ([Fe(bpy)3]2+). Photo-induced spin crossover in [Fe(bpy)3]2+ provides a system well-suited to demonstrating the power of this experimental approach. Photo-excitation of the singlet ground state of [Fe(bpy)3]2+ generates a singlet metal-to-ligand charge-transfer (1MLCT) that undergoes intersystem crossing to the 3MLCT state in 20 fs.27 This 3MLCT then relaxes to a high spin metal centered quintet state (5MC) within 200 fs (ref. 4, 14, 19 and 28–30) and coherently excites the Fe–N symmetric stretching mode of the 5MC state.11,13 What remains under dispute is the mechanism for transforming the MLCT excitation into the high spin 5MC state, as demonstrated by the different, and incompatible, models used in the interpretation of three recent experimental investigations.13,15,31 Theoretical calculations have assisted in assessing the viability of alternative relaxation mechanisms.32–36 Initial studies concluded that a sequential relaxation mechanism involving a 3MC should dominate,35 but more recent studies indicate direct 3MLCT relaxation to the 5MC excited state may compete with the sequential mechanism.32,33 The sensitivity of the second-order spin–orbit coupling magnitude to the specific geometry of the [Fe(bpy)3]2+ in the 3MLCT excited state found by Sousa and co-workers32,33 demonstrates the need for direct dynamics simulations to theoretically determine the relative importance of the direct and sequential mechanisms. Experimentally, we have chosen to determine the relative importance of these alternative mechanisms for photo-induced spin crossover by combining XES and XDS measurements. From this study we conclude the sequential mechanism dominates. More importantly, we demonstrate the ability of simultaneous XES and XDS measurements to map reactive trajectories in transition metal complexes and identify the Fe–N bond lengths that form a seam of crossings between the 3MC and 5MC states.
Results and discussion
For the combined X-ray Emission Spectroscopy (XES) and X-ray Diffuse Scattering (XDS) experiment, we implemented parallel detection of the XES and XDS signal at the X-ray pump–probe (XPP) end station of the Linear Coherent Light Source (LCLS). A schematic of the setup is presented in Fig. 1C. The parallel implementation of XES and XDS ensures that the experimental parameters such as time-zero (t0), instrument response function (σIRF) and excitation fraction (α) are identical for the data measured for the two techniques. Having identical experimental parameters facilitate parallel modeling of the data from the two techniques, allowing us to include both electronic configuration and nuclear structure in our model of the excited state relaxation. Additionally, we have separated the XDS signal into isotropic and anisotropic difference scattering components.37 Due to the quasi-octahedral symmetry of the [Fe(bpy)3]2+ system, we expect neither the solute structural dynamics nor the solvation dynamics associated with photo-induced spin crossover to exhibit anisotropy with respect to the polarization of the excitation pulses. Indeed, we show that the anisotropic XDS signal can be described solely from the nuclear-coordinate impulse-response of the water solvent molecules in the pump laser field. This solvent impulse-response allows us to explicitly determine the time-zero of the experiment and the instrument response function16 as described in the ESI.†In the present experiment, a 75 mM aqueous solution of [Fe(bpy)3]2+ was pumped through a 30 μm diameter nozzle producing a cylindrical liquid jet. The sample was excited with 400 nm optical laser pulses with a 120 μm focal diameter (FWHM), and 12.5 μJ per pulse energy, delivering a pulse fluence of 85 mJ cm−2, predominantly within the linear absorption regime of [Fe(bpy)3]2+,13,38,39 and before the onset of multiphoton absorption of the water solvent, as discussed in ESI Note 10.† The sample was probed by 8.5 keV X-ray laser pulses of 10 μm focal diameter. The Fe 3p–1s (Kβ) fluorescence XES signal was detected on a 140k Cornell-SLAC Pixel Array Detector (CSPAD) located above the liquid jet using four dispersive Ge(620) crystal analyzers with a central Bragg angle of 79.1 degrees. The diffuse X-ray scattering was recorded on an area detector located behind the sample. The relative timing between optical laser pump and X-ray laser probe pulses was measured for each pump–probe event through optical detection of X-ray generated carriers in a Si3N4 thin film located before the liquid jet. X-ray and optical laser pulse lengths were estimated as 30 fs and 45 fs, respectively.40
The full 2D images of the XES and XDS detectors were read out for each pump–probe event, these images were normalized and corrected,41 and an unpumped reference signal was subtracted.25 The XDS difference images were decomposed into isotropic and anisotropic difference scattering curves (S0 and S2) according to the zeroth and second order Legendre polynomials as described by Biasin et al.37 We used the anisotropic S2 XDS signal to identify time zero and the instrument response function, t0 = 0 ± 10 fs and σIRF = 27 ± 7 fs rms or 64 ± 7 fs FWHM, as described in the ESI.† The isotropic XDS signal (S0) was used for determining the structural dynamics.
The difference images of each pump/probe event were then sorted into ∼430 individual 2.5 fs time bins according to their time stamp and averaged. The resultant XES and isotropic XDS signals are shown in Fig. 2A and B, respectively. All XDS data are scaled to one liquid unit cell,25 and all XES spectra are scaled such that the integral of the Kβ emission line is 1 keV.
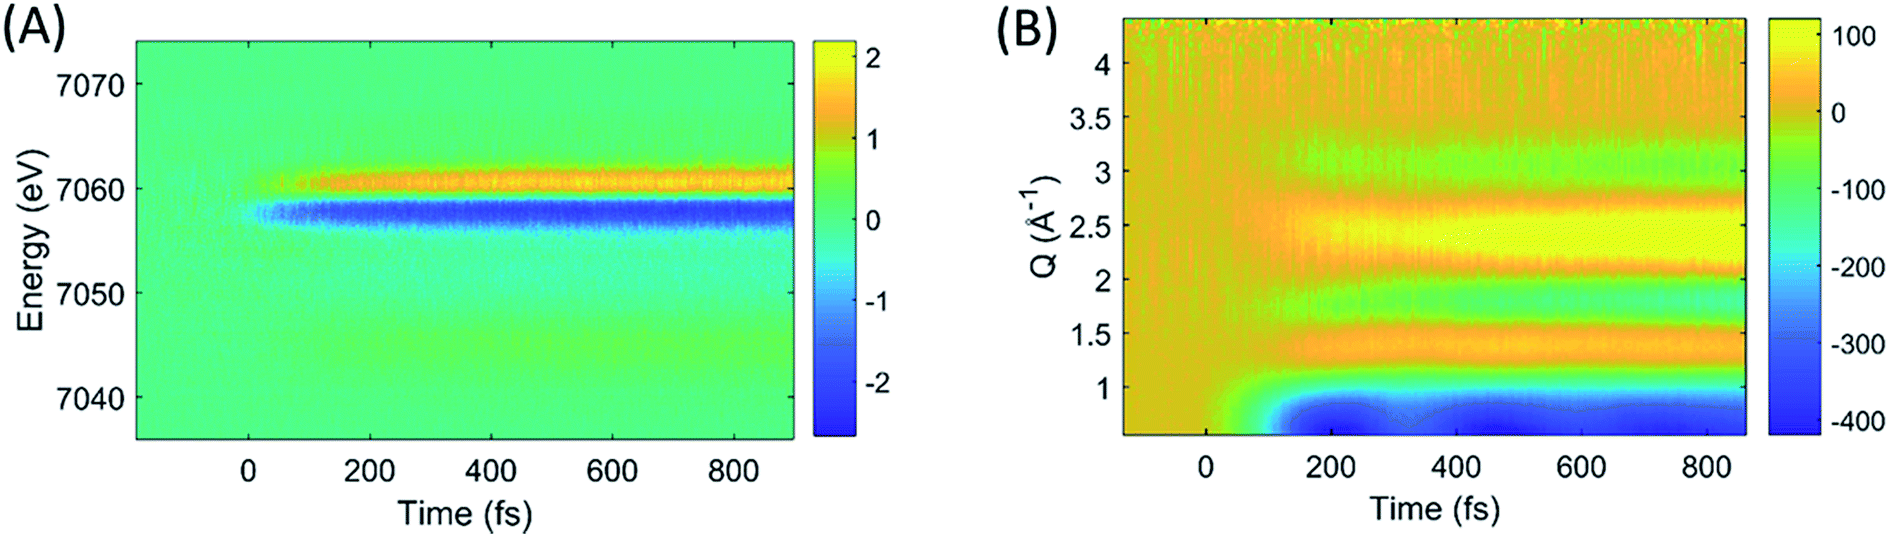 | ||
| Fig. 2 The time-resolved difference XES (A) and XDS (B) signals generated by photoexcitation of [Fe(bpy)3]2+ at 400 nm. | ||
XES
We describe the XES signal of excited states of [Fe(bpy)3]2+ using ground state spectra of Fe-centered complexes with identical charge- and spin-state multiplicities. By selecting reference compounds with ligand bond covalency similar to [Fe(bpy)3]2+, good agreement between the reference spectra and the measured data is expected.15,24,42 The relevant reference difference spectra of the excited states are constructed by subtracting the ground state spectrum of [Fe(bpy)3]2+ from these reference signals. The reference difference spectra of the MLCT, 3MC, and 5MC states are shown in Fig. 3B.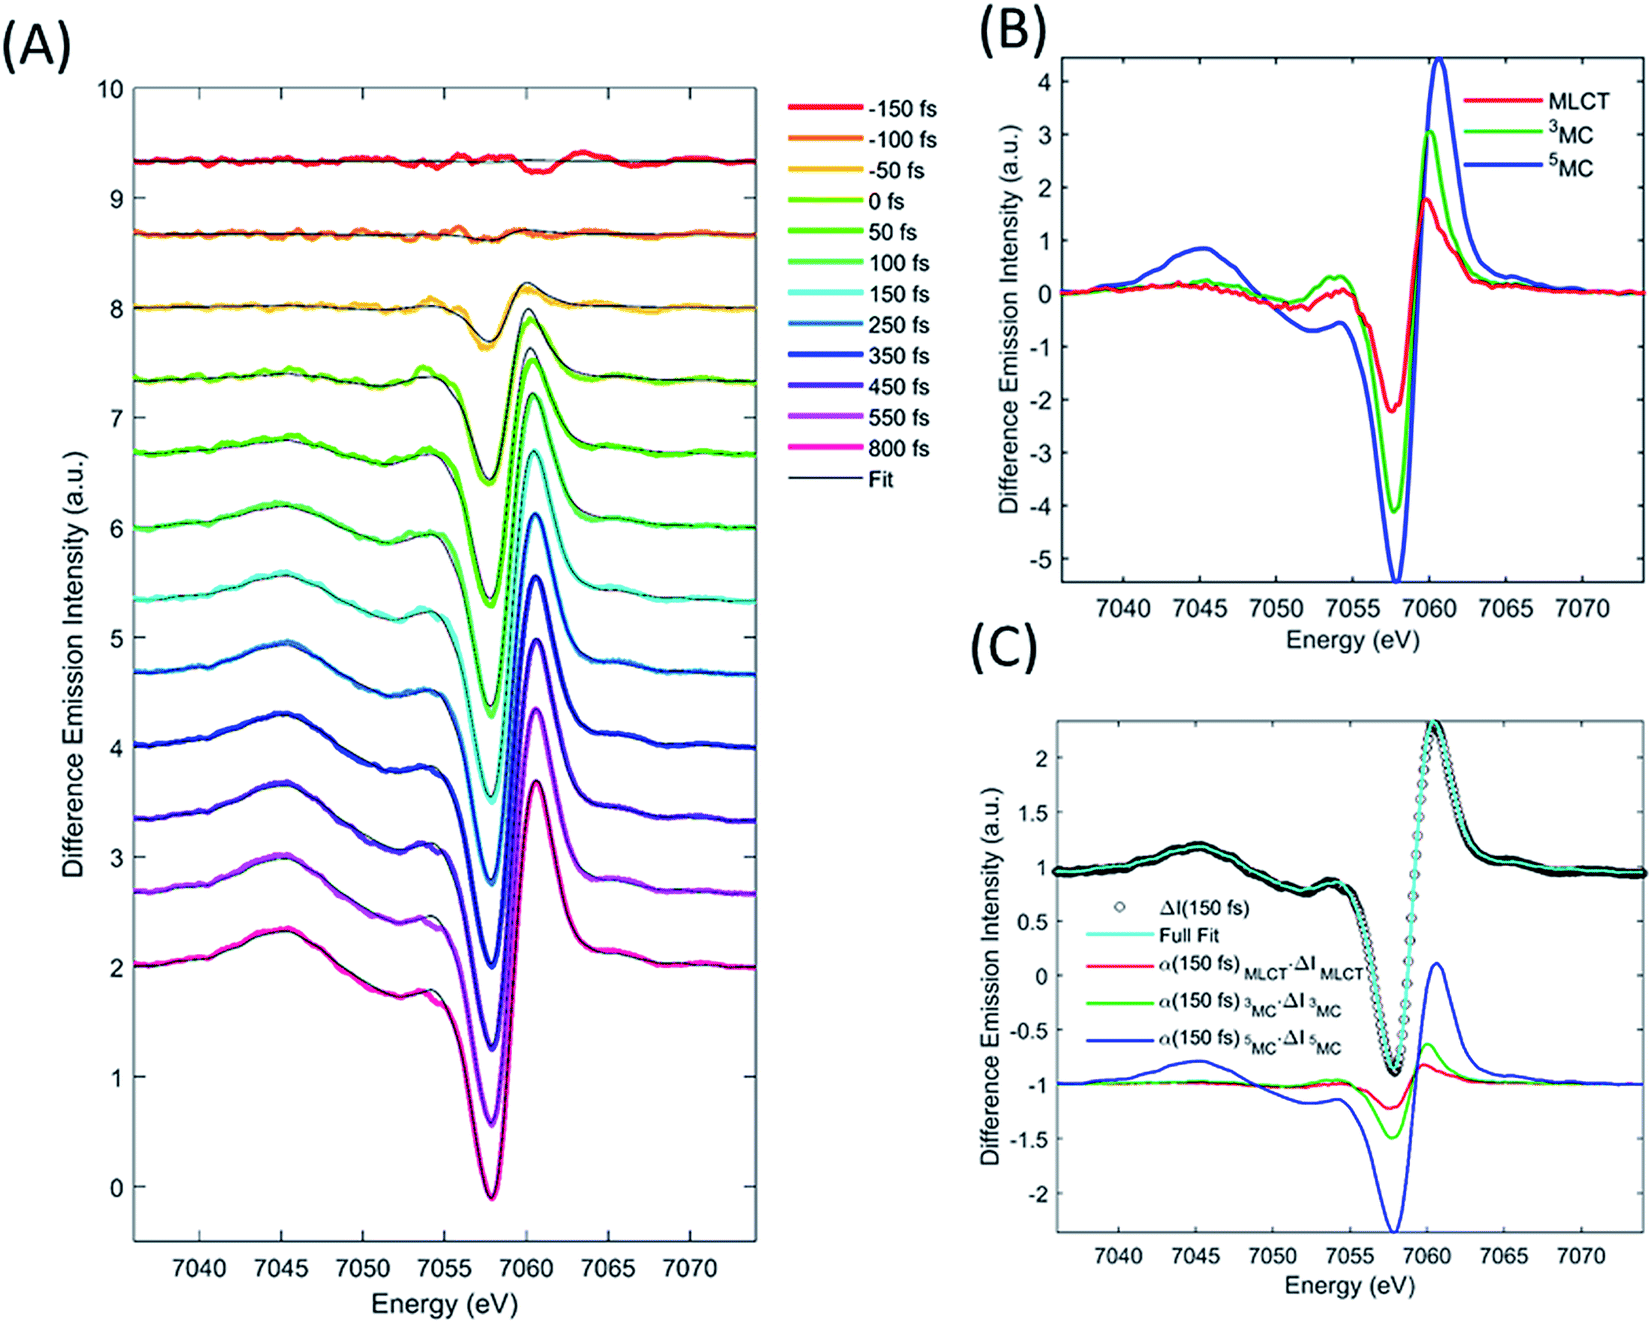 | ||
| Fig. 3 Fit of the transient XES signal by model described in text. XES data recorded at selected time delays (colored curves) and model fit (grey curves) (A). Reference difference curves used to fit the data (B). The model spectra are constructed from ground-state iron complexes with different spin moments; singlet: [Fe(bpy)3]2+, doublet: [Fe(bpy)3]3+, triplet: iron(II)phthalocyanine, quartet: iron(III) phthalocyanine, and quintet [Fe(phenanthroline)2(NCS)2]. Data, fit and fit components for the 150 fs time-delay data (C). | ||
We used the XES signal to quantify the excitation fraction, and subsequently, to determine the evolution of the excited electronic states. The excitation fraction, defined as the total fraction of [Fe(bpy)3]2+ in any of the excited states (α(t) = α(t)MLCT + α(t)3MC + α(t)5MC) was determined by scaling the 5MC reference difference signal to the difference data recorded at times >800 fs, assuming complete conversion to the quintet state (α(800 fs) = α(800 fs)5MC), providing a total excitation fraction of 42%. Combining t0 and σIRF with the known unitary quantum yield for 5MC state formation, the excitation fraction can be determined as a function of time. We used the transient excitation fraction extracted from XES analysis to constrain the analysis of the isotropic XDS data.
The difference XES signal at each time delay, ΔI(E,t), was then fitted by a sum of the MLCT, 3MC, and 5MC reference difference spectra (ΔI(E)MLCT, ΔI(E)3MC, ΔI(E)5MC, respectively) such that,
| ΔI(E,t) = α(t)MLCTΔI(E)MLCT + α(t)3MCΔI(E)3MC + α(t)5MCΔI(E)5MC, | (1) |
Finally, we imposed the constraint that the MLCT state population decays exponentially, as seen clearly in the studies of Lemke et al., Auböck et al., and all previous ultrafast studies.13,15,27–29,31 By applying this exponential decay constraint to the MLCT decay, the MLCT and 3MC state populations are robustly differentiated, as described in the ESI.† Convolution with the known time-zero and IRF results in the following expression for the transient population of MLCT states:
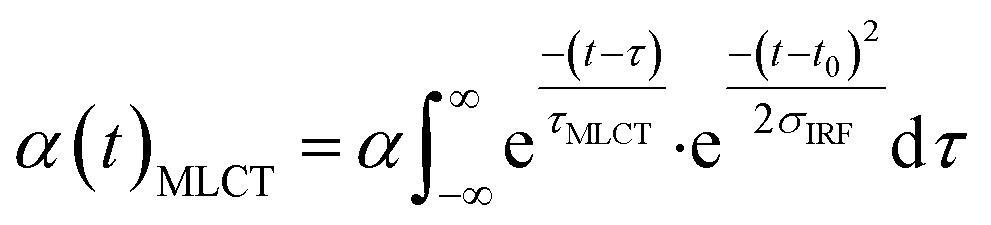 | (2) |
The MLCT lifetime (τMLCT) returning the lowest residual in the excited state extraction is 110 ± 11 fs, similar to the 120 ± 10 fs lifetime extracted from the most recent XANES study.13Fig. 3A shows the fit of the full model to the data at selected time delays. The reference difference spectra are shown in Fig. 3B, and the full fit of the three components to the difference signal recorded at 150 fs time delay is shown in Fig. 3C. The excited state distribution for all recorded time delays is presented in Fig. 5 (colored circles).
XDS
The XDS signal ΔS(Q,t), arises from all structural dynamics induced by the excitation event. In the standard analysis formalism,25,43 the isotropic XDS signal is modeled as a sum of three contributions arising from changes in solute structure, changes in solvation cage structure, and changes in the bulk solvent structure:| ΔS(Q,t) = ΔSsolute(Q,t) + ΔSsolvation cage(Q,t) + ΔSbulk solvent(Q,t) | (3) |
Each of these contributions can be further separated into specific molecular structural distortions and solvation processes. The XDS signal is analyzed by simulating the contribution from each of these contributions and comparing the sum of these to experiment.
As discussed by Haldrup et al.,19,44 the XDS signal from [Fe(bpy)3]2+ on sub-nanosecond time scales can be described using three main components. (1) A single solute component for the structural dynamics quantifying a symmetric expansion of the Fe–N bond lengths ΔSd(Fe–N)(Q,t). (2) A solvation cage component describing the change in the solute–solvent cross correlation induced by the structural difference between low- and high-spin [Fe(bpy)3]2+ ΔScage(Q) multiplied by a time-dependent scaling factor, β(t), that represents the time required for the solvent cage to equilibrate to [Fe(bpy)3]2+ in the 5MC excited state. (3) A component from a transient increase in the thermal energy of the solvent ΔT(t) following transfer of excess excitation energy from [Fe(bpy)3]2+, modelled by the difference scattering signal from a bulk solvent temperature increase ΔST(Q). In this previous work on [Fe(bpy)3]2+ it was found that the fit quality was improved if a transient density increase Δρ(t), modeled by the difference signal of increased bulk solvent density ΔSρ(Q), was included as well. Density changes normally arise from thermal expansion on 10–100 ns time scales, but for [Fe(bpy)3]2+ a fast increase in solvent density has previously been observed19 and assigned to an expulsion of water molecules from the solvent cage into the bulk solvent as predicted from simulations.45 However, recent computational studies46 suggest a reinterpretation of the difference signal contribution previously interpreted as arising from a density change as discussed in the ESI.† Critical to the current study, the extracted time dependent Fe–N bond length does not depend upon the inclusion, or exclusion, of the density term.
As ΔSd(Fe–N)(Q,t) and ΔScage(Q) depend linearly on the excitation fraction (α(t)) the final expression used to model the difference scattering signal becomes,
| ΔS(Q,t) = α(t)(ΔSd(Fe–N)(Q,t) + β(t)ΔScage(Q)) + ΔT(t)ΔST(Q) + Δρ(t)ΔSρ(Q) | (4) |
We calculate the solute contribution to the XDS signal, ΔSd(Fe–N)(Q,t), from the DFT-optimized molecular structures of [Fe(bpy)3]2+ in the lowest energy singlet electronic state by linearly interpolating the Fe–N bond distances in steps of 0.001 Å by moving the bipyridine ligands with respect to the Fe center such that all Fe–N distances and N–Fe–N bond angles remain equal. We do not use optimized structures for each symmetric Fe–N bond length because not all molecular coordinates will remain in equilibrium with the underdamped symmetric Fe–N bond oscillations and the subtle changes in ligand bonding that occur between the low- and high-spin states do not measurably change the intramolecular structure factor. The solute difference scattering signal is calculated for each structural configuration (each Fe–N bond length) using the Debye equation,25 followed by subtraction of the scattering signal calculated for the ground state. The cage signal ΔScage(Q,t), is identical to the one used by Haldrup et al.19 and calculated from the solute–solvent radial distribution function (RDF) generated from equilibrated MD trajectories of the GS and 5MC states in aqueous solution.47 This model of the cage signal does not account for the solvent reorganization that will occur in response to MLCT excitation. This may explain, in part, the discrepancies between the model and the XDS experiment during the first 150 fs. We treat the time dependent transition in the solvation cage as the time dependent scaling, β(t), of the difference signal created by the subtraction of the solvation cage for the low- and high-spin equilibrated cage signals. This conforms to the widely observed trend in time resolved XDS measurements that fractional changes in intermolecular distances of up to 10% appear as changes in a Q-independent amplitude.48 The density and temperature components ΔSρ(Q) and ΔST(Q), are taken from reference measurements (https://sites.google.com/site/trwaxs/home/TRWAXS-data).49 As such, the difference scattering signal from each time delay is fit with the Fe–N bond length distance (dFe–N), the cage response amplitude β(t), ΔT(t) and Δρ(t) as free parameters, with α(t) determined from the XES analysis described above.
The difference scattering signal and corresponding fit is shown for selected time delays in Fig. 4A. The four difference scattering components used to fit the data are shown in Fig. 4B–E. Fig. 4F shows the difference scattering signal at 150 fs (gray circles), the full fit of the model (cyan curve) and the contribution from each component of the fit (black, magenta, red and blue). The time dependent Fe–N bond length dynamics (mapped by the Fe–N distance) are shown in Fig. 5 and the time evolution of all parameters are shown in the ESI.† The time dependent Fe–N bond length dynamics display clear oscillations for t < 1 ps, which are fitted in the ESI.† From the fit, we retrieve a period for the Fe–N oscillations of 235 ± 14 fs matching the 236 fs Fe–N stretch oscillation observed in both TA and XANES experiments,13,31 a dephasing lifetime of 340 ± 80 fs matching the XANES experiments,13 and we retrieve a lifetime for the vibrational cooling of 1.4 ± 0.3 ps, similar to the 1.6 ± 0.1 ps lifetime of vibrational cooling retrieved from the XANES experiments.13 Additionally, the time dependent bond length extracted from the XDS measurement has an asymptotic change in the Fe–N bond length of 0.2 Å, as shown in ESI Fig. S2,† equal to that seen previously with ultrafast XANES measurements.13,50
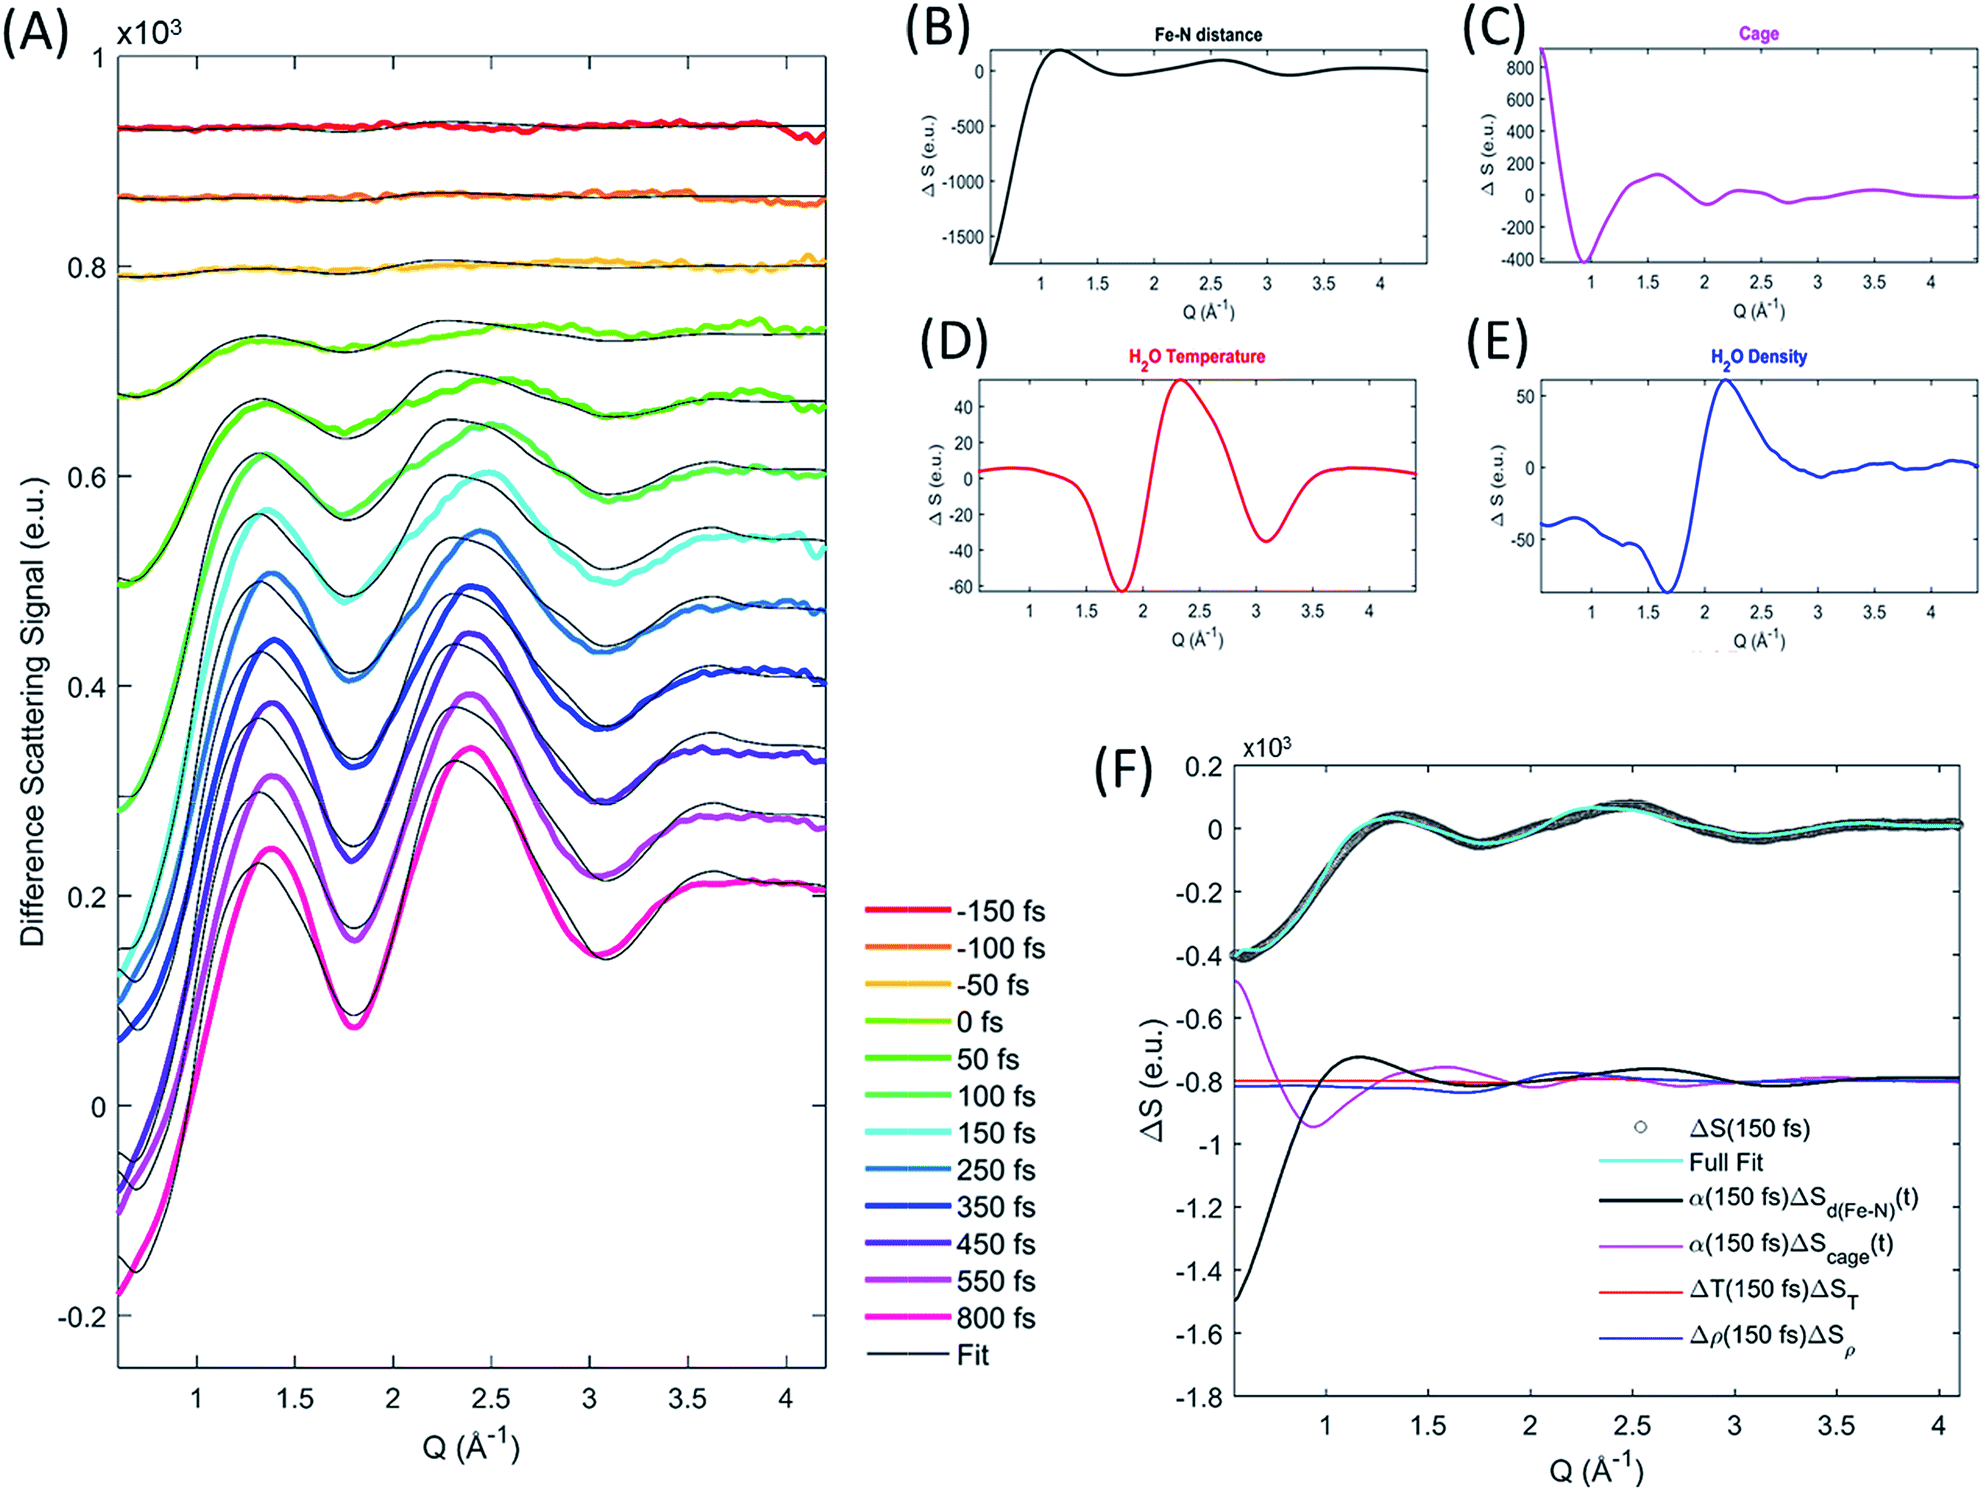 | ||
| Fig. 4 Extracting the excited state structural dynamics from XDS measurements. XDS data (colored curves) and fit (grey curves) at selected time delays (A). Examples of the difference scattering components used to describe the XDS signal, the solute signal (B) is shown for a 0.2 Å bond-length expansion at an excitation fraction of 1, the cage term (C) is shown for the solvation change between ground state and quintet excited state for an excitation fraction of 1, and the solvent signals are shown for a 1 kg m−3 density (D) and 1 K temperature (E) increase respectively. Data, fit and fit components for the 150 fs time-delay data (F). | ||
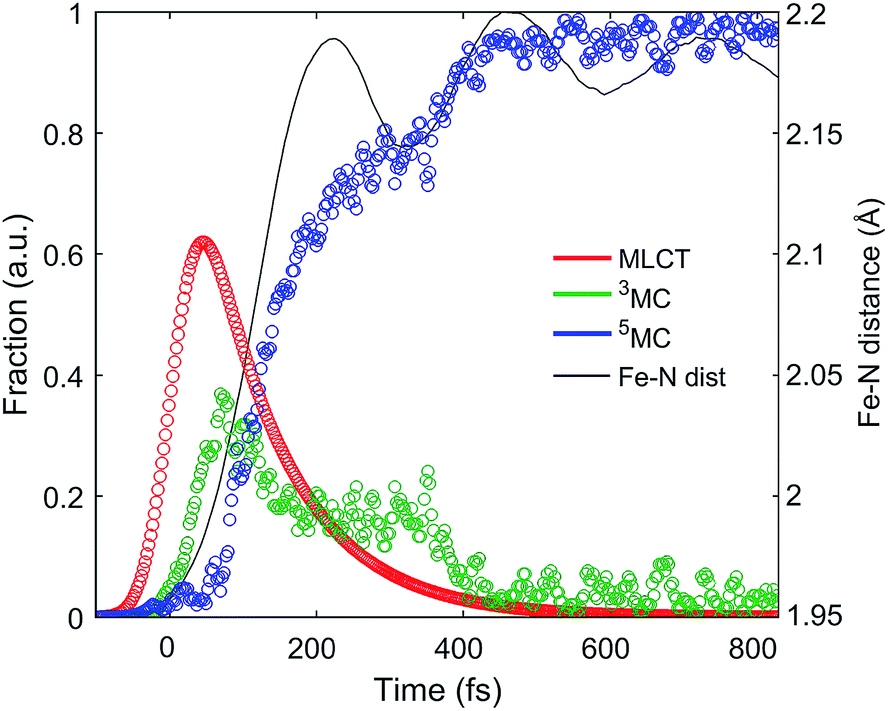 | ||
| Fig. 5 Excited state electronic dynamics extracted from the XES and dynamics of the Fe–N bond length distance extracted from XDS. | ||
Excited state relaxation dynamics
The excited state populations and average Fe–N bond length dynamics of [Fe(bpy)3]2+ extracted from the combined XES and XDS experiment are summarized in Fig. 5.The improvement in XES data quality and time resolution compared to our previous measurements demonstrate that the 3MC → 5MC transition is governed by non-exponential dynamics. This is readily visible from the plateau in the 3MC population at time delays between 200 fs and 350 fs, concurrent with a shoulder in the 5MC population, which can be seen directly from the recorded XES difference data (Fig. S5†). Note the small population of the 3MC state beyond 400 fs does not exceed the uncertainty in the analysis and likely reflects the limitations of the model spectra used in the analysis. The XES clearly shows a recurrence in the 3MC population coincident with the vibrational wave packet on the 5MC PES, tracked by the XDS, arriving at the inner turning point at roughly 350 fs. This demonstrates that the evolution of the 3MC state and the 5MC state populations formed from the MLCT relaxation depend directly on the underdamped oscillation along the Fe–N symmetric stretching coordinate. This leads to both forward and back transfer of population between the 3MC and 5MC states occurring over a narrow range of Fe–N bond lengths. A model description of such excited state dynamics, with a strong interplay between excited state electronic and structural dynamics, can be achieved by describing the dynamics directly on one-dimensional potential energy curves for the MLCT, 3MC, and 5MC electronic excited states (see Fig. 6C).
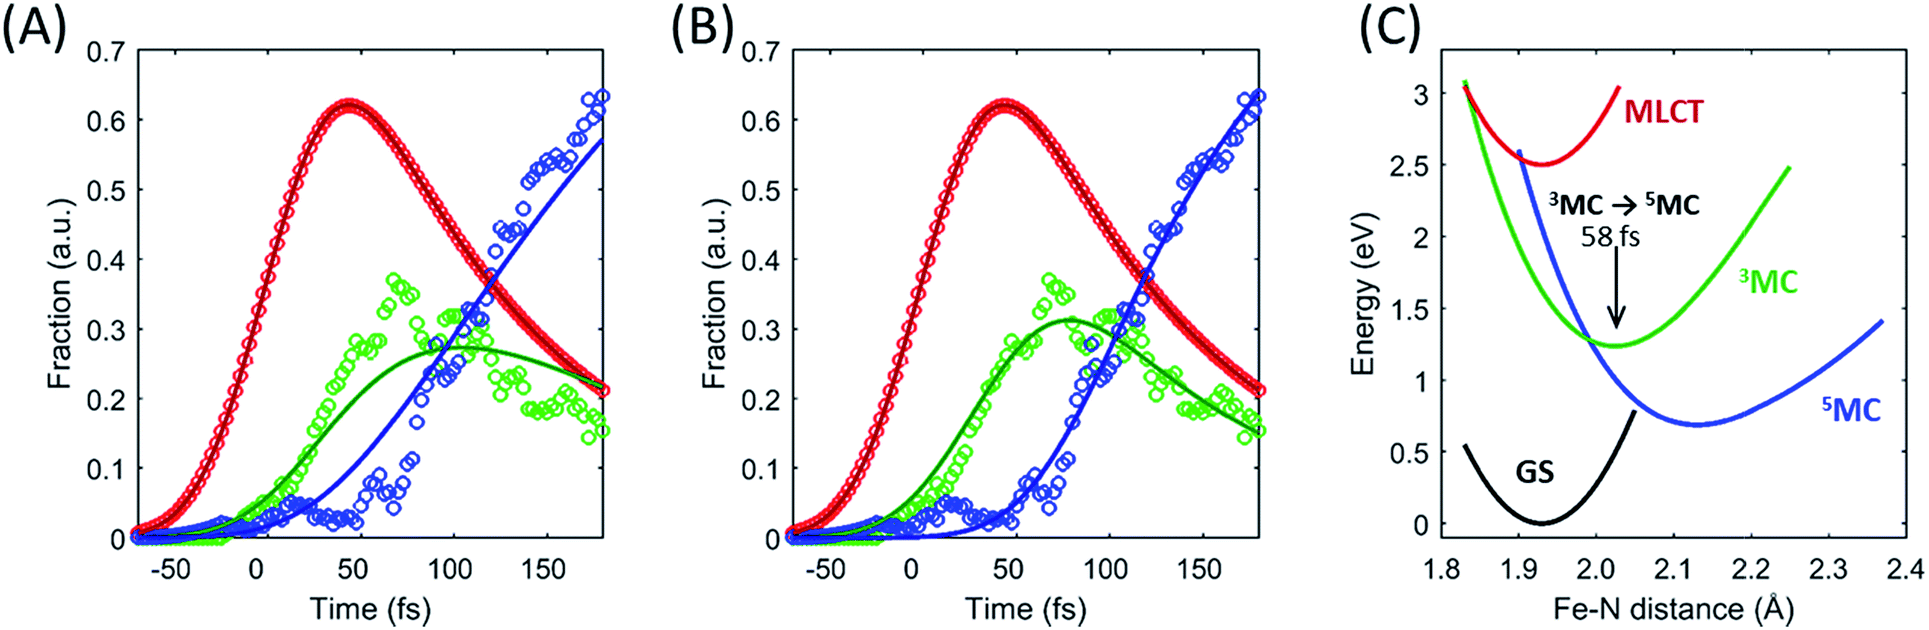 | ||
| Fig. 6 Fitting the excited state electronic kinetics with exponential or ballistic transport through the 3MC state. The transit of the excited state cascade through the 3MC state has been fitted with (A) an exponential lifetime of the 3MC state, and (B) a wait time for the 3MC → 5MC transition (following the MLCT → 3MC transition). The model used in (B) describes a situation where the 3MC → 5MC transition happens in a very narrow range on the optimized PES used in the model and illustrated by the black arrow in (C), with the best fit returning a 58 fs wait time. | ||
Within this one-dimensional Fe–N symmetric bond length description of motion on multiple PES, the molecules transitioning into the 3MC from the MLCT state see a very steep gradient along the Fe–N bond length coordinate. The gradient generates a ballistic bond expansion bringing the system towards the intersection between the 3MC and 5MC excited states where transitions to the 5MC state occur with a very high probability. The simplest way to implement a model with such a structure-dependent transition probability is to describe the 3MC → 5MC transition of each molecule as a unitary probability transition that occurs after a fixed ‘wait time’ following the initial MLCT → 3MC transition. This would correspond to each molecular trajectory undergoing 3MC → 5MC transition with unitary probability near a well-defined Fe–N symmetric bond length on the 3MC potential energy surface as indicated by the black arrow in Fig. 6C. Fig. 6A and B show the best fits to the initial electronic state kinetics within the first 200 fs with the 3MC → 5MC transition being assigned either an exponential decay (Fig. 6A) or a wait time following the MLCT → 3MC transition (Fig. 6B). For the exponential dynamics, we obtain the best fit with a 72 fs 3MC lifetime, and for the ballistic dynamics we obtain the best fit for a 3MC residence time of 58 fs. As seen from Fig. 6A and B, the model describing the transition by a wait time better matches both the amplitude of the 3MC maximum, the onset of the 5MC population growth, and the shape of the 3MC decay. Including a direct transition between the MLCT and 5MC states in the model do not improve the fit, indicating that nearly all of the excited state ensemble passes through the 3MC state on the way to the 5MC excited state.
A 58 fs residence time on the 3MC potential energy surface is slightly shorter than a quarter period of the coherent oscillations on the 5MC PES. The period of oscillations on the 3MC surface are expected to be in between the 230 fs and 265 fs identified for the breathing modes of the GS and 5MC states respectively.13,35 Therefore, a wait time of 58 fs indicates that the excited state 3MC → 5MC transition occurs over a narrow range of Fe–N symmetric stretch bond lengths near the minimum of the 3MC potential.
This analysis also resolves the apparent contradiction between previous studies13,15,31 of the photo-induced spin crossover dynamics of [Fe(bpy)3]2+. XES robustly observes the presence of the 3MC transient, but does not characterize the Fe–N bond length expansion. By simultaneously measuring the spin state dynamics with XES and Fe–N bond length dynamics with XDS, we have the necessary electronic state and nuclear dynamics constraints needed to confirm the presence of a 3MC transient and the ballistic expansion of the Fe–N symmetric bond length seen with XANES and optical transient absorption measurements. The factor of two difference between the MLCT lifetime measured in this study compared to that of Auböck and Chergui warrants comment.31 Auböck and Chergui use the 50 fs phase shift in the Fe–N symmetric stretching oscillation to indicate the time scale for MLCT excited state decay. In the present study a similar phase shift is observed in the XDS, but the ultrafast XES provides a clear signature for the MLCT excited state and indicates that the phase of the vibration provides a less robust method for determining the MLCT decay time.
Excited state modeling
The success of the coarse grained model description of photo-induced spin crossover dynamics shown in Fig. 6B indicates that the experimental correlation between electronic state and nuclear structural dynamics provides direct access to a one-dimensional projection of the excited state relaxation dynamics on the 3MC and 5MC potential energy surfaces onto the Fe–N symmetric stretching vibrational coordinate. In order to account for 5MC → 3MC back transfer, we require a model for the excited state cascade that simultaneously describes both electronic and structural dynamics. In the following section, we will describe the results obtained by directly modeling the dynamics of the excited state relaxation on the calculated potential energy surfaces of the system and quantitatively optimizing this model description against the recorded excited state dynamics.Our model framework for the excited state relaxation builds on the model established to describe ultrafast XANES13 measurements of [Fe(bpy)3]2+ and the calculated PES of Sousa et al.35 A detailed description of the model can be found in ESI Note 8.† The model describes both the electronic transitions extracted from the fit of the XES data, and the Fe–N bond-length distance dynamics extracted from the XDS data. The model returns the simulated electronic and structural dynamics of an ensemble of 105 molecules each having a well-defined Fe–N distance and electronic state for each time delay. The Fe–N distance of each molecule is propagated classically on the excited state potential energy surface on which they reside (experiencing a force given by the slope of the PES). The XANES measurements of Lemke et al.13 provide a handle on the width of Fe–N bond length distribution, a parameter that cannot be readily extracted from XDS data. We have therefore used the structural distribution of the MLCT state, as well as the dephasing, dampening, and thermostat terms presented by Lemke et al. to describe the solvent collisions and intramolecular vibrational redistribution processes. The simulation is initialized at time-zero, with all excited state systems being moved to the MLCT surface. From the MLCT surface, each system has a time-independent transition probability to the 3MC surface, such that the MLCT ensemble decays with the 110 fs exponential lifetime identified in the XES experiments. The systems are then propagated classically on the 3MC potential energy surface, until they reach a Fe–N distance defining the intersection point between the 3MC and 5MC surfaces. At the point of intersection, the system trajectories are shifted to the 5MC surface with a given transition probability, and are then propagated on the resultant PES. After reaching the outer turning point of the 5MC potential, the trajectories can revisit the 5MC/3MC intersection at which they have a probability of transitioning back to the 3MC potential. The simulation explicitly quantifies the excited electronic state and the Fe–N bond length of each molecule and reproduces the experimental observables from an ensemble average of simulated trajectories. The model description provided by the simulation can therefore be quantitatively compared to the experimental results and incorporated into a χ2 analysis that allow us to optimize the shape and position of the potential energy surfaces directly against the data.
The model has nine parameters. Three parameters, t0, σIRF, and τMLCT, are determined by alternative analyses and fixed in the simulation. We use the Fe–N bond-length distribution in the MLCT state and vibrational cooling dynamics extracted from the XANES analysis presented by Lemke et al.13 due to the higher sensitivity of XANES, than XDS, to the Fe–N bond length distribution. We explicitly extract the final four parameters directly from the simulation: the location of the initial 3MC → 5MC intersection, the location of the back transfer 3MC → 5MC intersection, the transition probability between the 3MC and 5MC excited states at these intersections, and a scaling parameter for the shape of the potential energy surfaces.
Two of the optimized parameters, the transition probability and the curvature scaling of the Fe–N stretching potential, can be optimized independently from the remaining parameters. The best fits are achieved with a transition probability of 1, with the quality of the fit becoming significantly worse for transition probabilities below 0.8. The curvature of the Fe–N symmetric stretching potential energy surfaces calculated by Sousa et al.35 have to be reduced by a factor of 0.89 ± 0.05 to match the observed oscillation frequency in the 5MC electronic state. The best description of the data is provided when the initial 3MC → 5MC intersection occurs near the 3MC potential energy minimum 2.05 ± 0.01 Å, whereas the subsequent 5MC → 3MC back transfer occurs very close to the calculated intersection for isotropic bond length changes at 1.98 ± 0.02 Å. The simulated dynamics for this model, which provides the best description of the experimental dynamics, is compared to the experimental dynamics in Fig. 7A. Fig. 6C shows the experimentally optimized potential energy surfaces and the points of intersection between the 3MC and 5MC states projected onto the Fe–N symmetric bond length. The resulting Fe–N bond length distribution can be seen in Fig. 7B. With this parametrization, the mean residence time for the initial passage through the 3MC state is 55 fs, matching well with the 58 fs derived with the waiting time model fit to the XES data.
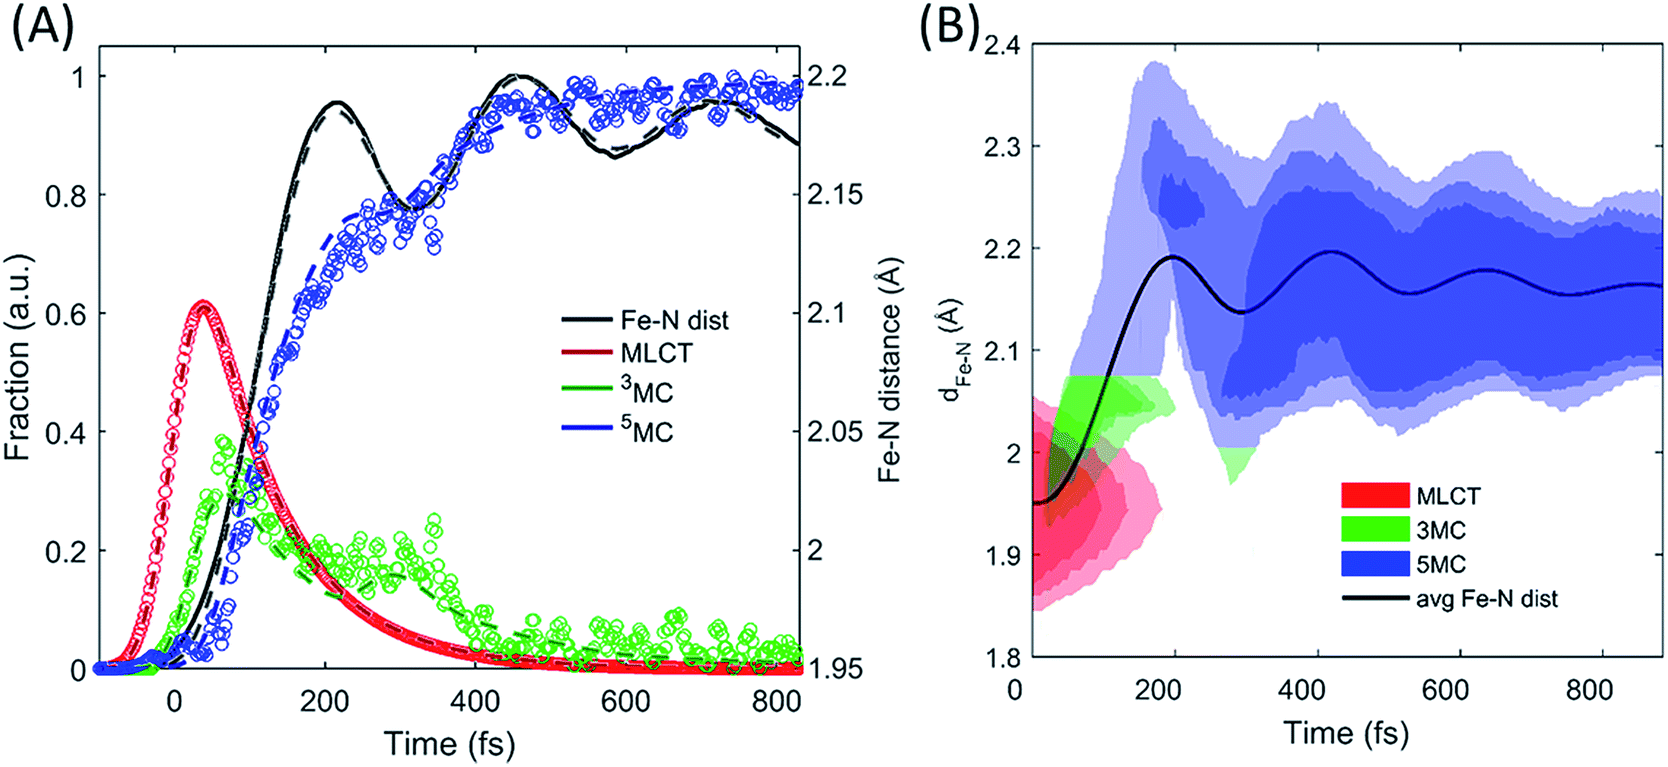 | ||
| Fig. 7 Simulating the experimentally determined excited state dynamics. Using the potential energy surfaces in Fig. 6C and the modelling described in the text, an accurate fit (dashed lines) of the excited state population dynamics extracted from the XES measurement (circles) and Fe–N ensemble average bond length (line) has been achieved (A). The distribution of Fe–N distances and the electronic state occupied by the simulated excited state ensemble are shown in (B). | ||
The results of the model in Fig. 7B show that both the electronic and the structural dynamics of the system can be modeled by optimization of four free parameters, with two of these being uncorrelated with the others. Inspection of the best fit and the experimental populations shows that the model shows faster population transfer from the 3MC to the 5MC state, though not significantly outside the uncertainty in the measurement. This may indicate that the transitions between 3MC and 5MC occur over a narrow range of Fe–N bond lengths, rather than a single bond length. This would be expected, but the experimental measurement does not warrant a more complex model than the one utilized. Moving beyond the level of detail we present here would require robust theoretical support.
The different location for the intersection between the 3MC and 5MC states for the forward (3MC → 5MC) and back (5MC → 3MC) reactions represents the most significant finding of the analysis of the experimental data. This could not occur if only one vibrational degree of freedom and one 3MC state participated in the transition between the 3MC and 5MC excited states. As shown in Fig. 1B, both a 3T1 and 3T2 electronic state could participate in the photo-induced spin crossover and these distinct triplet states intersect with the 5T2 state at different Fe–N bond lengths. Constraining the dynamics to one dimensional curves shown in Fig. 1B, a circumstance where the back transfer occurred for a shorter Fe–N bond length than the forward transfer cannot be easily rationalized. The inability of one-dimensional surfaces to describe the relevant dynamics provides a more likely explanation, highlighting the broader significance of understanding multidimensional potential energy surface properties for understanding ultrafast dynamics processes.51 Most critically, the 3MC state will have a single electron in a 3d-dominated eg orbital making the molecule pseudo-Jahn–Teller active. When molecules propagate on the 3MC PES, they will experience a tetragonal distortion gradient in addition to the Fe–N bond expansion gradient. This should be contrasted with the 5MC state which has a near octahedral coordination sphere with no tetragonal distortion. Consequently, the initial 3MC → 5MC transition should occur along a trajectory involving Fe–N bond expansion and tetragonal Fe–N bond distortion, while the 5MC → 3MC back transfer will involve trajectories dominated by oscillations in the Fe–N symmetric bond length. A schematic representation of these dynamics and how they could lead to distinct points of intersection for the forward and back reactions can be found in Fig. 8. Ambiguity remains because we observe the projection of trajectories on the multi-dimension potential energy surfaces onto the symmetric Fe–N stretching coordinate; we do not directly resolve any other intramolecular structural degrees of freedom.
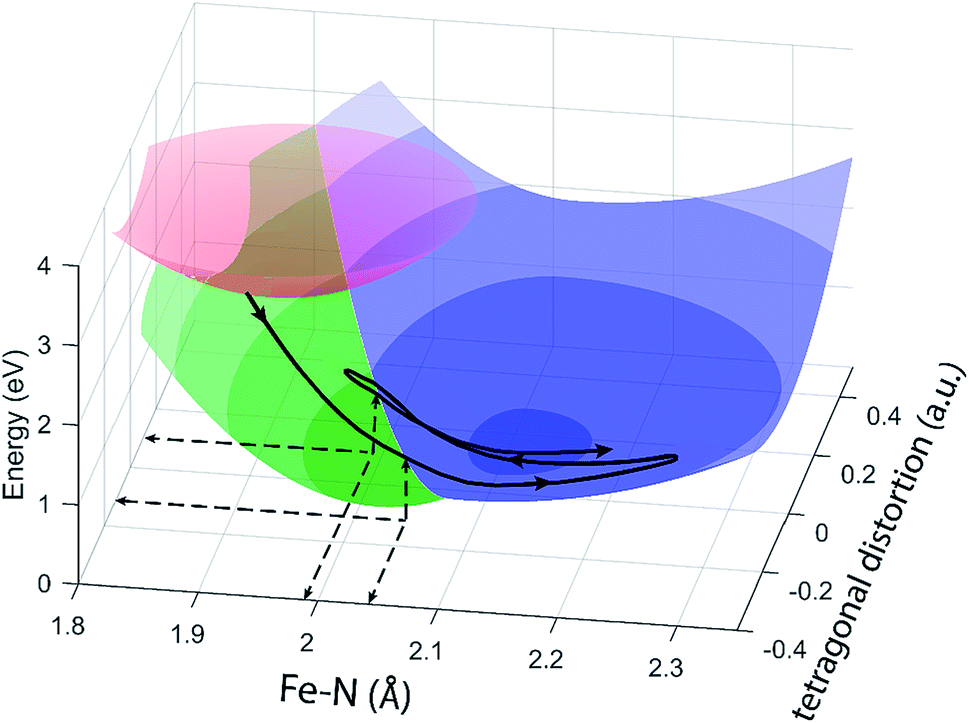 | ||
| Fig. 8 Schematic of the excited state trajectory of [Fe(bpy)3]2+ through its excited state potential energy landscape. Colored surfaces are the potential energy surfaces of the MLCT (red), 3MC (green), and 5MC (blue) drawn around the calculated minimum positions seen from two different angles, note than the 3MC and 5MC potential energy surfaces are only drawn where they are the lowest lying surface. The black line represents the initial part of a trajectory through the potential energy landscape for an [Fe(bpy)3]2+ system undergoing back-transfer onto the 3MC potential energy surface. | ||
Closing remarks
We have shown that robust analysis of simultaneously recorded X-ray diffuse scattering and X-ray emission spectroscopy enables the electronic and nuclear trajectory of electronic excited states on multiple potential energy surfaces to be extracted from measurement. The method has been used to provide a clear mechanistic picture for light-induced spin crossover in [Fe(bpy)3]2+. We conclude that the dominant trajectory involves transit through a 3MC state, and that the light-induced spin crossover occurs as a cascade of single-electron transitions strongly coupled to large-scale structural dynamics along the metal–ligand stretch reaction coordinate. Transitions between the MC states occur through points of intersection with near unity transition probability, clearly visible as non-exponential dynamics exemplified by the observation that a subset of the excited states revisit the 3MC state at the first inner turning point of the activated metal–ligand stretch vibration. Using a model to simultaneously fit both electronic state and nuclear structural dynamics provides quantification of the loci of intersections between the metal-centered excited state potential energy surfaces. The quantification reveals a small but significant difference in the position of intersections along the metal–ligand stretch reaction coordinate for the forward 3MC → 5MC reaction and the back 5MC → 3MC reaction. This may result from the expected tetragonal distortion of the Fe–N bonds on the 3MC potential, illustrating that intersystem crossing and internal conversion happens along a seam between the potential energy surfaces spanned by the Fe–N stretch coordinate, and the Fe–N tetragonal distortion coordinate.The intersections and seams between the excited state potential energy surfaces govern electronic excited state reaction mechanisms in analogy with the transition state for electronic ground state reaction mechanisms. Robust parametrization of such intersections and seams has long been a key objective for ultrafast studies of chemical dynamics and these measurements demonstrate the clear value of joint ultrafast X-ray spectroscopy and diffuse scattering measurements for characterizing the complex reaction dynamics of electronically excited 3d transition metal complexes in solution, particularly when these dynamics involve changes in the charge and spin state of the metal-center strongly coupled to changes in the metal–ligand bond lengths, ligand number, and symmetry. These measurements may also assist the development of quantum dynamics simulations for 3d transition metal systems, which in turn will be critical to developing a deeper understanding of the molecular properties that control the excited state dynamics of these complexes.
Conflicts of interest
There are no conflicts to declare.Acknowledgements
Use of the Linac Coherent Light Source (LCLS), SLAC National Accelerator Laboratory, is supported by the U.S. Department of Energy, Office of Science, Office of Basic Energy Sciences under Contract No. DE-AC02-76SF00515. Work by KK, MER, and KJG was supported by the U.S. Department of Energy, Office of Science, Basic Energy Sciences, Chemical Sciences, Geosciences, and Biosciences Division. KL acknowledges a Melvin and Joan Lane Stanford Graduate Fellowship. KSK, KH, MMN, MGL, PV, EB, FBH, MC gratefully acknowledge DANSCATT support for the beamtime efforts. TCBH, EB, MGL, MIP, KBM, and MMN gratefully acknowledge support by the Danish Council for Independent Research under grant no. DFF-4002-00272B. MIP, MMN, and KBM acknowledge support by the Danish Council for Independent Research under grant no. DFF-8021-00347B. KSK gratefully acknowledge the support of the Carlsberg Foundation and the Danish Council for Independent Research. MIP, DSS, EB, and GV acknowledge support from the ‘Lendület’ (Momentum) Program of the Hungarian Academy of Sciences (LP2013-59), the Government of Hungary and the European Regional Development Fund under grant No. VEKOP-2.3.2-16-2017-00015, the European Research Council via contract ERC-StG-259709 (X-cited!), the Hungarian Scientific Research Fund (OTKA) under contract K 109257, and the National Research, Development and Innovation Fund (NKFIH FK 124460). ZN acknowledges support from the Bolyai Fellowship of the Hungarian Academy of Sciences. SC acknowledges the ELI-ALPS project (GINOP-2.3.6-15-2015-00001) which is supported by the European Union and co-financed by the European Regional Development Fund. VS, JU, and PP acknowledge support from the Knut and Alice Wallenberg Foundation (KAW). SK acknowledges the support from Knut & Alice Wallenberg foundation (KAW 2014.0370). AOD acknowledges support by the Icelandic Research Fund (Grant# 196279-051).References
- G. Vanko, P. Glatzel, V. T. Pham, R. Abela, D. Grolimund, C. N. Borca, S. L. Johnson, C. J. Milne and C. Bressler, Angew. Chem., Int. Ed., 2010, 49, 5910–5912 CrossRef CAS PubMed.
- K. H. Kim, J. G. Kim, S. Nozawa, T. Sato, K. Y. Oang, T. Kim, H. Ki, J. Jo, S. Park, C. Song, T. Sato, K. Ogawa, T. Togashi, K. Tono, M. Yabashi, T. Ishikawa, J. Kim, R. Ryoo, J. Kim, H. Ihee and S. Adachi, Nature, 2015, 518, 385–389 CrossRef CAS PubMed.
- H. Ihee, M. Wulff, J. Kim and S.-i. Adachi, Int. Rev. Phys. Chem., 2010, 29, 453–520 Search PubMed.
- J. E. Monat and J. K. McCusker, J. Am. Chem. Soc., 2000, 122, 4092–4097 CrossRef CAS.
- T. J. Martinez, Nature, 2010, 467, 412–413 CrossRef CAS PubMed.
- W. Domcke and D. R. Yarkony, in Annual Review of Physical Chemistry, ed. M. A. Johnson and T. J. Martinez, 2012, vol. 63, pp. 325–352 Search PubMed.
- A. H. Zewail, J. Phys. Chem. A, 2000, 104, 5660–5694 CrossRef CAS.
- A. H. Zewail, Science, 1988, 242, 1645–1653 CrossRef CAS PubMed.
- D. R. Yarkony, Rev. Mod. Phys., 1996, 68, 985–1013 CrossRef CAS.
- T. S. Rose, M. J. Rosker and A. H. Zewail, J. Chem. Phys., 1989, 91, 7415–7436 CrossRef CAS.
- N. F. Scherer, D. M. Jonas and G. R. Fleming, J. Chem. Phys., 1993, 99, 153–168 CrossRef CAS.
- M. Chergui and E. Collet, Chem. Rev., 2017, 117, 11025–11065 CrossRef CAS PubMed.
- H. Lemke, K. S. Kjær, R. W. Hartsock, T. B. van Driel, M. Chollet, J. M. Glownia, S. H. Song, D. L. Zhu, E. Pace, S. F. Matar, M. M. Nielsen, M. Benfatto, K. J. Gaffney, E. Collet and M. Cammarata, Nat. Commun., 2017, 8, 15342 CrossRef CAS PubMed.
- H. T. Lemke, C. Bressler, L. X. Chen, D. M. Fritz, K. J. Gaffney, A. Galler, W. Gawelda, K. Haldrup, R. W. Hartsock, H. Ihee, J. Kim, K. H. Kim, J. H. Lee, M. M. Nielsen, A. B. Stickrath, W. K. Zhang, D. L. Zhu and M. Cammarata, J. Phys. Chem. A, 2013, 117, 735–740 CrossRef CAS PubMed.
- W. Zhang, R. Alonso-Mori, U. Bergmann, C. Bressler, M. Chollet, A. Galler, W. Gawelda, R. G. Hadt, R. W. Hartsock, T. Kroll, K. S. Kjaer, K. Kubicek, H. T. Lemke, H. W. Liang, D. A. Meyer, M. M. Nielsen, C. Purser, J. S. Robinson, E. I. Solomon, Z. Sun, D. Sokaras, T. B. van Driel, G. Vanko, T.-C. Weng, D. Zhu and K. J. Gaffney, Nature, 2014, 509, 345–348 CrossRef CAS PubMed.
- E. Biasin, T. B. van Driel, K. S. Kjaer, A. O. Dohn, M. Christensen, T. Harlang, P. Chabera, Y. Z. Liu, J. Uhlig, M. Papai, Z. Nemeth, R. Hartsock, W. Liang, J. X. Zhang, R. Alonso-Mori, M. Chollet, J. M. Glownia, S. Nelson, D. Sokaras, T. A. Assefa, A. Britz, A. Galler, W. Gawelda, C. Bressler, K. J. Gaffney, H. T. Lemke, K. B. Moller, M. M. Nielsen, V. Sundstrom, G. Vanko, K. Warnmark, S. E. Canton and K. Haldrup, Phys. Rev. Lett., 2016, 117, 013002 CrossRef PubMed.
- T. B. van Driel, K. S. Kjær, R. W. Hartsock, A. O. Dohn, T. Harlang, M. Chollet, M. Christensen, W. Gawelda, N. E. Henriksen, J. G. Kim, K. Haldrup, K. H. Kim, H. Ihee, J. Kim, H. Lemke, Z. Sun, V. Sundström, W. Zhang, D. Zhu, K. B. Møller, M. M. Nielsen and K. J. Gaffney, Nat. Commun., 2016, 7, 13678 CrossRef CAS PubMed.
- K. S. Kjaer, Z. Wenkai, R. Alonso-Mori, U. Bergmann, M. Chollet, R. G. Hadt, R. W. Hartsock, T. Harlang, T. Kroll, K. Kubicek, H. T. Lemke, H. W. Liang, L. Yizhu, M. M. Nielsen, J. S. Robinson, E. I. Solomon, D. Sokaras, T. B. van Driel, W. Tsu-Chien, Z. Diling, P. Persson, K. Warnmark, V. Sundstrom and K. J. Gaffney, Struct. Dyn., 2017, 4, 044030 CrossRef PubMed.
- K. Haldrup, W. Gawelda, R. Abela, R. Alonso-Mori, U. Bergmann, A. Bordage, M. Cammarata, S. E. Canton, A. O. Dohn, T. B. van Driel, D. M. Fritz, A. Galler, P. Glatzel, T. Harlang, K. S. Kjaer, H. T. Lemke, K. B. Moller, Z. Nemeth, M. Papai, N. Sas, J. Uhlig, D. L. Zhu, G. Vanko, V. Sundstrom, M. M. Nielsen and C. Bressler, J. Phys. Chem. B, 2016, 120, 1158–1168 CrossRef CAS PubMed.
- S. E. Canton, K. S. Kjær, G. Vankó, T. B. van Driel, S.-i. Adachi, A. Bordage, C. Bressler, P. Chabera, M. Christensen, A. O. Dohn, A. Galler, W. Gawelda, D. Gosztola, K. Haldrup, T. Harlang, Y. Liu, K. B. Møller, Z. Németh, S. Nozawa, M. Pápai, T. Sato, T. Sato, K. Suarez-Alcantara, T. Togashi, K. Tono, J. Uhlig, D. A. Vithanage, K. Wärnmark, M. Yabashi, J. Zhang, V. Sundström and M. M. Nielsen, Nat. Commun., 2015, 6, 6359 CrossRef CAS PubMed.
- M. Levantino, G. Schiro, H. T. Lemke, G. Cottone, J. M. Glownia, D. L. Zhu, M. Chollet, H. Ihee, A. Cupane and M. Cammarata, Nat. Commun., 2015, 6, 6772 CrossRef CAS PubMed.
- E. Malmerberg, P. H. M. Bovee-Geurts, G. Katona, X. Deupi, D. Arnlund, C. Wickstrand, L. C. Johansson, S. Westenhoff, E. Nazarenko, G. F. X. Schertler, A. Menzel, W. J. de Grip and R. Neutze, Sci. Signaling, 2015, 8, ra26 CrossRef PubMed.
- G. Vanko, T. Neisius, G. Molnar, F. Renz, S. Karpati, A. Shukla and F. M. F. de Groot, J. Phys. Chem. B, 2006, 110, 11647–11653 CrossRef CAS PubMed.
- G. Vanko, A. Bordage, P. Glatzel, E. Gallo, M. Rovezzi, W. Gawelda, A. Galler, C. Bressler, G. Doumy, A. M. March, E. P. Kanter, L. Young, S. H. Southworth, S. E. Canton, J. Uhlig, G. Smolentsev, V. Sundstrom, K. Haldrup, T. B. van Driel, M. M. Nielsen, K. S. Kjaer and H. T. Lemke, J. Electron Spectrosc. Relat. Phenom., 2013, 188, 166–171 CrossRef CAS.
- K. Haldrup, M. Christensen and M. M. Nielsen, Acta Crystallogr., Sect. A: Found. Crystallogr., 2010, 66, 261–269 CrossRef CAS PubMed.
- D. Leshchev, T. C. B. Harlang, L. A. Fredin, D. Khakhulin, Y. Z. Liu, E. Biasin, M. G. Laursen, G. E. Newby, K. Haldrup, M. M. Nielsen, K. Warnmark, V. Sundstrom, P. Persson, K. S. Kjaer and M. Wulff, Chem. Sci., 2018, 9, 405–414 RSC.
- W. Gawelda, A. Cannizzo, V. T. Pham, F. van Mourik, C. Bressler and M. Chergui, J. Am. Chem. Soc., 2007, 129, 8199–8206 CrossRef CAS PubMed.
- C. Bressler, C. Milne, V. T. Pham, A. ElNahhas, R. M. van der Veen, W. Gawelda, S. Johnson, P. Beaud, D. Grolimund, M. Kaiser, C. N. Borca, G. Ingold, R. Abela and M. Chergui, Science, 2009, 323, 489–492 CrossRef CAS PubMed.
- C. Consani, M. Premont-Schwarz, A. ElNahhas, C. Bressler, F. van Mourik, A. Cannizzo and M. Chergui, Angew. Chem., Int. Ed., 2009, 48, 7184–7187 CrossRef CAS PubMed.
- N. Huse, H. Cho, K. Hong, L. Jamula, F. M. F. de Groot, T. K. Kim, J. K. McCusker and R. W. Schoenlein, J. Phys. Chem. Lett., 2011, 2, 880–884 CrossRef CAS PubMed.
- G. Auböck and M. Chergui, Nat. Chem., 2015, 7, 629–633 CrossRef PubMed.
- C. Sousa, M. Llunell, A. Domingo and C. de Graaf, Phys. Chem. Chem. Phys., 2018, 20, 2351–2355 RSC.
- C. Sousa, A. Domingo and C. de Graaf, Chem.–Eur. J., 2018, 24, 5146–5152 CrossRef CAS PubMed.
- C. Sousa, M. Alias, A. Domingo and C. de Graaf, Chem.–Eur. J., 2019, 25, 1152–1164 CrossRef CAS PubMed.
- C. Sousa, C. de Graaf, A. Rudavskyi, R. Broer, J. Tatchen, M. Etinski and C. M. Marian, Chem.–Eur. J., 2013, 19, 17541–17551 CrossRef CAS PubMed.
- C. de Graaf and C. Sousa, Chem.–Eur. J., 2010, 16, 4550–4556 CrossRef CAS PubMed.
- E. Biasin, T. B. van Driel, G. Levi, M. G. Laursen, A. O. Dohn, A. Moltke, P. Vester, F. B. K. Hansen, K. S. Kjaer, T. Harlang, R. Hartsock, M. Christensen, K. J. Gaffney, N. E. Henriksen, K. B. Moller, K. Haldrup and M. M. Nielsen, J. Synchrotron Radiat., 2018, 25, 306–315 CrossRef CAS PubMed.
- W. Gawelda, Doctor of Philosophy, Ecole Polytechnique Federale de Lausanne, 2006.
- W. Gawelda, V. T. Pham, R. M. van der Veen, D. Grolimund, R. Abela, M. Chergui and C. Bressler, J. Chem. Phys., 2009, 130, 124520 CrossRef CAS PubMed.
- M. Chollet, R. Alonso-Mori, M. Cammarata, D. Damiani, J. Defever, J. T. Delor, Y. P. Feng, J. M. Glownia, J. B. Langton, S. Nelson, K. Ramsey, A. Robert, M. Sikorski, S. Song, D. Stefanescu, V. Srinivasan, D. L. Zhu, H. T. Lemke and D. M. Fritz, J. Synchrotron Radiat., 2015, 22, 503–507 CrossRef CAS PubMed.
- T. B. van Driel, K. S. Kjaer, E. Biasin, K. Haldrup, H. T. Lemke and M. M. Nielsen, Faraday Discuss., 2015, 177, 443–465 RSC.
- W. Zhang, K. S. Kjaer, R. Alonso-Mori, U. Bergmann, M. Chollet, L. A. Fredin, R. G. Hadt, R. W. Hartsock, T. Harlang, T. Kroll, K. Kubicek, H. T. Lemke, H. W. Liang, Y. Liu, M. M. Nielsen, P. Persson, J. S. Robinson, E. I. Solomon, Z. Sun, D. Sokaras, T. B. van Driel, T.-C. Weng, D. Zhu, K. Warnmark, V. Sundstrom and K. J. Gaffney, Chem. Sci., 2017, 8, 515–523 RSC.
- T. K. Kim, J. H. Lee, M. Wulff, Q. Y. Kong and H. Ihee, ChemPhysChem, 2009, 10, 1958–1980 CrossRef CAS PubMed.
- K. Haldrup, G. Vanko, W. Gawelda, A. Galler, G. Doumy, A. M. March, E. P. Kanter, A. Bordage, A. Dohn, T. B. van Driel, K. S. Kjaer, H. T. Lemke, S. E. Canton, J. Uhlig, V. Sundstrom, L. Young, S. H. Southworth, M. M. Nielsen and C. Bressler, J. Phys. Chem. A, 2012, 116, 9878–9887 CrossRef CAS PubMed.
- L. M. L. Daku and A. Hauser, J. Phys. Chem. Lett., 2010, 1, 1830–1835 CrossRef.
- L. M. L. Daku, Phys. Chem. Chem. Phys., 2018, 20, 6236–6253 RSC.
- A. O. Dohn, E. Biasin, K. Haldrup, M. M. Nielsen, N. E. Henriksen and K. B. Moller, J. Phys. B: At., Mol. Opt. Phys., 2015, 48, 244010 CrossRef.
- K. Haldrup, G. Levi, E. Biasin, P. Vester, M. G. Laursen, F. Beyer, K. S. Kjaer, T. B. van Driel, T. Harlang, A. O. Dohn, R. J. Hartsock, S. Nelson, J. M. Glownia, H. T. Lemke, M. Christensen, K. J. Gaffney, N. E. Henriksen, K. B. Moller and M. M. Nielsen, Phys. Rev. Lett., 2019, 122, 063001 CrossRef CAS PubMed.
- K. S. Kjaer, T. B. van Driel, J. Kehres, K. Haldrup, D. Khakhulin, K. Bechgaard, M. Cammarata, M. Wulff, T. J. Sorensen and M. M. Nielsen, Phys. Chem. Chem. Phys., 2013, 15, 15003–15016 RSC.
- W. Gawelda, V. T. Pham, M. Benfatto, Y. Zaushitsyn, M. Kaiser, D. Grolimund, S. L. Johnson, R. Abela, A. Hauser, C. Bressler and M. Chergui, Phys. Rev. Lett., 2007, 98, 057401 CrossRef PubMed.
- C. S. Ponseca, P. Chabera, J. Uhlig, P. Persson and V. Sundstrom, Chem. Rev., 2017, 117, 10940–11024 CrossRef CAS PubMed.
Footnote |
| † Electronic supplementary information (ESI) available. See DOI: 10.1039/c8sc04023k |
| This journal is © The Royal Society of Chemistry 2019 |