Analysis of student reasoning about Michaelis–Menten enzyme kinetics: mixed conceptions of enzyme inhibition†
Jon-Marc G.
Rodriguez
 and
Marcy H.
Towns
 *
*
Department of Chemistry, Purdue University, West Lafayette, Indiana 47907, USA. E-mail: rodri461@purdue.edu
First published on 9th March 2019
Abstract
Student understanding regarding topics in upper-division courses, such as biochemistry, is not well represented in the literature. Herein we describe a study that investigated students’ reasoning about Michaelis–Menten enzyme kinetics and enzyme inhibition. Our qualitative study involved semistructured interviews with fourteen second-year students enrolled in an introductory biochemistry course. During the interviews students were provided an enzyme kinetics graph, which they were prompted to describe. Students were asked to look for patterns and trends in the data and interpret the graph to draw conclusions regarding the types of enzyme inhibition observed, providing the opportunity for the students to engage in the science practice analyzing and interpreting data. Findings indicate students were able to attend to the relevant parameters (Vmax and Km) in the graph and subsequently associate changes in Vmax and Km to different types of enzyme inhibitors. However, students expressed difficulty explaining why a specific type of inhibition caused the observed change in the kinetic parameters and there was confusion regarding the distinction between noncompetitive and uncompetitive inhibition. Based on our results, we suggest instruction on enzyme kinetics should emphasize qualitative descriptions of the particulate-level mechanisms related to competitive and noncompetitive inhibition, with less emphasis on discussions of uncompetitive and mixed inhibition in introductory biochemistry courses.
Introduction
Biochemistry represents a field that is inherently cross-disciplinary in nature, which brings its own challenges for instruction. A recent study that investigated the beliefs and perceptions of instructors teaching biochemistry courses indicated faculty feel there is a lack of consensus and direction regarding what topics should be taught in a biochemistry course (Lang, 2018). Recent work by the American Chemical Society's Exam Institute (ACS-EI) involves an ongoing project to systematically outline the important ideas and concepts in the undergraduate chemistry curriculum (Murphy et al., 2012). The ACS-EI describes the compilation of all the undergraduate chemistry concepts as the “Anchoring Concepts Content Map” (ACCM), and currently general chemistry, organic chemistry, inorganic chemistry, and physical chemistry have been completed; however, at present there is no corresponding map for biochemistry (Holme and Murphy, 2013; Holme et al., 2015; Holme et al., 2018; Marek et al., 2018; Murphy et al., 2012; Raker et al., 2012).From the perspective of the biology community, “threshold concepts” have been identified for biochemistry, which are analogous to “core ideas” that are intended to be foundational for any topic in chemistry (Loertscher et al., 2014; Cooper et al., 2017). The biochemistry threshold concepts include: (1) steady state, (2) biochemical pathway dynamics and regulation, (3) the physical basis of interactions, (4) thermodynamics of macromolecular structure formation, and (5) free energy (Loertscher et al., 2014). These threshold concepts are intended to be used as foundational principles that can be related back to ideas discussed throughout the curriculum, not to provide recommendations regarding the specific topics that should be taught in biochemistry courses.
Chemistry education research provides the opportunity to not only investigate how concepts should be taught, but it can also be used to inform what topics should be taught—in a way that allows us to move beyond personal empiricism and make decisions based on evidence (Cooper and Stowe, 2018). Although recent work has used advanced chemistry courses as a context, chemistry education research has frequently been carried out in general chemistry, indicating the need to investigate how the teaching and learning of advanced topics—in biochemistry, for example—can be improved (Bodner and Weaver, 2008). In the context of this study, we focus specifically on student understanding of enzyme kinetics, a topic that has been previously identified as understudied (Bain and Towns, 2016). A review of the literature indicates there are a variety of resources and suggestions available for instructors teaching biochemistry courses (e.g., alternatives for framing content, the use of analogies, software, laboratory experiments), and although these instructional resources are of value to the community, they tend to be commentaries and related papers that would not be formally characterized as chemistry education research. Therefore, in this study we seek to formally investigate how students reason about enzyme kinetics, building on our previous work in chemical kinetics, which emphasized the importance of integrating conceptual ideas with mathematical reasoning (Bain et al., 2018a, 2018b, 2019a, 2019b; Rodriguez et al., 2018, 2019a, 2019b, 2019c, 2019d).
Here we focus on how students analyze and interpret data, operationalizing the description of science practices provided by the National Research Council (2012), which frames science practices as a set of tools that involve a combination of skill and knowledge, which are used by scientists to approach problems and provide explanations for phenomena. We are interested in how students interpret the data provided (i.e., graph) and the connections they make to the relevant chemistry ideas. This study was guided by the following research questions:
(1) How do students interpret enzyme inhibition graphs?
(2) How do students reason about the particulate-level mechanism associated with competitive, noncompetitive, and uncompetitive inhibition?
Review of related literature
Instructional resources for practitioners
There is a clear effort made in the literature to provide suggestions to improve enzyme kinetics, evidenced by the plethora of papers discussed related to this topic. Our intention here is not to evaluate these resources, but to make the community aware that these resources exist, drawing connections to relevant research when applicable.Catalysts, enzymes, and proteins
Previous work that focused on students’ understanding of catalysts indicated students’ conceptions of catalysts were limited to broad definitions related to increasing the speed of a reaction and lowering activation energy, but students had difficulty reasoning about the mechanism and physical interaction that occurs when a catalyst is involved in a reaction (Cakmakci, 2010; Tastan and Boz, 2010; Cakmakci and Aydogdu, 2011; Bain et al., 2018a, 2018b), which is problematic because the physical interaction between enzymes and other molecules is a key tenet of understanding enzyme inhibition. Focusing specifically on interactions between enzymes and substrates, work by Linenberger and Bretz indicated students needed more support regarding making distinctions between different enzyme binding sites and understanding the role of charge and shape in enzyme–substrate interactions (Bretz and Linenberger, 2012; Linenberger and Bretz, 2014, 2015). Moreover, Harle and Towns (2012a, 2012b, 2013) have discussed implications for the presentation of proteins, emphasizing the important role instructors have in indicating the limitations and advantages associated with different representation types—ribbon, vines (wireframe), hydrophobic/polar space-filling—and providing the space for students to draw their own diagrams.Chemical kinetics and graphical reasoning
Research on chemical kinetics has primarily been contextualized in first-year introductory chemistry courses (Justi, 2002; Bain and Towns, 2016); however, many of the findings in this growing body of literature can inform the study discussed herein. For example, decoding the information represented in graphical depictions of rate is a challenging task for students (Cakmakci et al., 2006; Cakmakci, 2010; Tastan et al., 2010; Cakmakci and Aydogdu, 2011; Kolomuc and Tekin, 2011), and unfortunately, the presentation of chemical kinetics in textbooks may contribute to student difficulties with drawing connections between ideas (Quisenberry and Tellinghuisen 2006a, 2006b; Gegios et al., 2017; Seethaler et al., 2018). Furthermore, it is worth stating the importance of assessments that probe students’ reasoning in relation to graphs, because students may simply be associating ideas with a particular graphical shape, rather than considering chemical processes that could give rise to the observed data (Rodriguez et al., 2019d).Science practices
Science practices reflect the set of tools used by scientists to answer questions and engage in inquiry, including: asking questions; developing and using models; planning and carrying out investigations; analyzing and interpreting data; using mathematics and computational thinking; constructing explanations; engaging in argument from evidence; obtaining, evaluating, and communicating information (National Research Council, 2012). This description of what it means to engage in the process of science is particularly useful because of the clearly defined nature of the science practices, which readily lends itself to assessment (Cooper, 2013; National Research Council, 2014; Osborne, 2014; Stowe and Cooper, 2017).Using science practices as a way to define what it means to engage in “critical thinking” (Stowe and Cooper, 2017), recent work has provided practical considerations for designing practice-centered exams (Underwood et al., 2018) and laboratory experiments (Rodriguez and Towns, 2018). As discussed by Underwood et al. (2018) and Rodriguez and Towns (2018), rather than designing completely new exams and laboratory experiments, current instructional materials can simply be modified using Laverty et al.'s (2016) “Three-Dimensional Learning Assessment Protocol” (3D-LAP). The 3D-LAP outlines the criteria needed for a task to elicit engagement in science practices to help instructors develop “three-dimensional” tasks and assessments that engage students in critical thinking (the “three-dimensions” are a reference to disciplinary core ideas, cross-cutting concepts, and science practices, which constitute the Next Generation Science Standards framework) (Laverty et al., 2016).
In this study, we are particularly interested in how students analyze and interpret data. To this end we have provided the criteria needed for a task to elicit engagement in analyzing and interpreting data according to Laverty et al.'s (2016) 3D-LAP (see Table 1). In the context of our study, the question to be investigated is the prompt that asks students about enzyme inhibition types, the data provided for the students is a graph, and the students are prompted to interpret the graph to draw conclusions regarding the type of inhibitors represented. More information regarding the prompt used in this study is provided in the Methods section.
| Description |
|---|
| Student is given a question, claim, or hypothesis and data collected from an experiment or observation and is asked to analyze the resulting data and interpret their meaning. |
| Criteria |
|---|
| (1) Question gives a scientific question, claim, or hypothesis to be investigated. |
| (2) Question gives a representation of the data (e.g., table or graph, or list of observations) provided to answer the question or test the claim or hypothesis. |
| (3) Question gives an analysis of the data or asks student to analyze the data. |
| (4) Question asks student to interpret the results or assess the validity of the conclusions in the context of the scientific question, claim, or hypothesis. |
Theoretical perspectives
Our approach to understanding student reasoning is based on the resources framework, which emphasizes the manifold structure of cognition (Hammer and Elby, 2003). Within this framework, resources can be conceptualized as fine-grained cognitive units that represent a variety of different types of knowledge, such as conceptual resources (e.g., ideas about the interaction between an enzyme and a competitive inhibitor), procedural resources (e.g., information regarding the process of estimating the value of Km given a Michaelis–Menten plot) and epistemological resources (e.g., beliefs regarding the extent in which new knowledge or conclusions can be generated from provided data) (Heisterkamp and Talanquer, 2015; Becker et al., 2017). Resources can also be mathematical in nature, such as intuitive ideas about the information encoded in an equation or graph (Sherin, 2001; Becker and Towns, 2012; Rodriguez et al., 2018), and in a forthcoming manuscript, we discuss the mathematical resources used by students from this dataset to reason about enzyme kinetics (Rodriguez et al., 2019b).One of the key features of the resource-based model of cognition is the notion that the utility associated with the activation and use of a resource (or cluster of resources) depends on the context (Hammer, Elby, Scherr, and Redish, 2005). For example, the technical definition of Km (i.e., the substrate concentration at half of the maximum velocity) is productive when considering how the kinetic parameters in a Michaelis–Menten plot change in the presence of an inhibitor; however, this conceptualization of Km is less productive when considering why a noncompetitive inhibitor does not influence the Km value—in this context it may be more useful to view Km as providing information regarding enzyme–substrate binding affinity. Part of the utility of the resources perspective is the extent that it lends itself to consider the context-dependence of students’ knowledge and the extent in which students draw connections between ideas, “Conceptualizing student knowledge as a dynamic complex system allows us to explain both the existence of naïve frameworks in some areas and the fragmented nature of student knowledge in others.” (Heisterkamp and Talanquer, 2015). Thus, part of our aim is to analyze the resources utilized by students to determine how we can better support students in developing a coherent network of meaningfully connected ideas.
Methods
Participants
Participants for this study were second-year undergraduates sampled from an introductory biochemistry course intended for life science majors at a large institution in the midwestern United States. Prerequisite coursework required to take this course includes general chemistry, two semesters of organic chemistry, and because of the demographics (life science majors), most students have already taken an introductory biology course. The biochemistry course met three times a week (50 min each) and used Biochemistry: Concepts and Connections by Appling et al. (2016) as the assigned textbook (commercially available). Students were interviewed following instruction and assessment on enzyme kinetics, and for their participation, students were compensated with a $20 iTunes or Amazon gift card. After initially piloting this study with four students, it was determined the data allowed us to address the research questions, thus, no changes were made to the protocol, and ten additional students were interviewed—yielding a final sample of fourteen students. All aspects of this project were completed in accordance with the regulations outlined by our Institutional Review Board, which included recruiting participants on a voluntary basis, obtaining informed consent from students, and providing no penalty for not participating in the study.Interviews
Our primary data source for this study involved semi-structured interviews using a Livescribe™ smartpen, which digitally synchronizes audio and written work (Linenberger and Bretz, 2012; Harle and Towns, 2013; Cruz-Ramirez de Arellano and Towns, 2014). Using a think-aloud protocol, during the interviews, students were prompted to describe enzyme kinetics graphs and asked follow-up questions to make their reasoning more explicit (Becker and Towns, 2012). The graph provided to the students is presented in Fig. 1 and contains three curves: No Inhibitor (top curve, blue), Inhibitor #1 (middle curve, red), and Inhibitor #2 (bottom curve, green). In the interview prompt, the students were provided a graph and asked to draw conclusions about enzyme inhibition (as discussed previously, note that the interview prompt meets the criteria for a task that has the potential to elicit engagement in the science practice analyzing and interpreting data, see Table 1 to reference the relevant criteria). This prompt was used as an opportunity to ask students more general questions about the different types of inhibition (competitive, noncompetitive, uncompetitive) and how these inhibitors interact with the enzyme and influence Km and Vmax.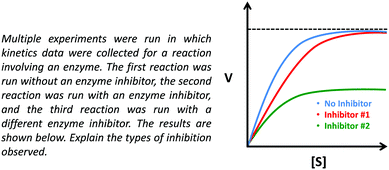 | ||
| Fig. 1 Interview prompt used in this study, which asks students to consider the types of inhibition observed in the graph. | ||
In addition, the lectures related to instruction on enzymes and enzyme kinetics were attended in order to confirm that the content discussed in the prompt was appropriate and reasonable (in terms of difficulty) for students sampled from the course. Lastly, prior to interviewing students, in order to help establish content validity, the interview prompts were discussed with two biochemistry professors that had experience teaching enzyme kinetics in undergraduate and/or graduate-level courses. For clarification, the intention was for students to recognize that Inhibitor #1 increases the Km value but does not affect the Vmax (suggesting Inhibitor #1 is a competitive inhibitor), whereas Inhibitor #2 decreases the Vmax but does not affect the Km (suggesting Inhibitor #2 is a noncompetitive inhibitor). Discussion of the prompt with the two biochemistry professors helped establish the feasibility of drawing these conclusions based on the data provided in the prompt, which was confirmed with the pilot study and more generally across the sample, since it was observed that most students were able to attend to the relevant parameters and make appropriate conclusions (as discussed later in the Findings section). We would also like to note that unless otherwise indicated, our use of the phrase noncompetitive inhibition is in reference to pure noncompetitive inhibition (i.e., the inhibitor non-preferentially binds both the free enzyme and the enzyme–substrate complex).
Data analysis
Immediately following each interview, initial notes were taken regarding topics discussed and the general impression of the interview (memoing/reflective journaling) (Birks et al., 2008; King and Horrocks, 2010), and after all interviews were completed, they were transcribed. Prior to coding the interviews, the data went through additional processing, which involved creating an “interpretive narrative” for each of the student interviews, see Table 2 (Page, 2014). In recent work from our research group we have used interpreted narratives differently from Page (2014), using them primarily as a pre-coding processing step that allows us to streamline our multimodal analysis and manage large amounts of different types of qualitative data (e.g., students’ verbal discussion and the images they draw, both of which are captured by the Livescribe™ smartpen) (Bain and Towns, 2018; Bain et al., 2018a). In this study, the interpreted narratives have two columns, the refashioned transcript and the students’ written work. The refashioned transcript includes the verbatim transcribed interview, which primarily includes the students’ discussion (unless the interviewer's questions/comments are necessary for context). What the students were writing or drawing while they were talking is indicated directly to the right of the text in the second column, and bracketed phrases are included in the refashioned transcript for clarity.The interpreted narratives were then open-coded using a constant-comparison methodology to aid in the refinement of the codes (Strauss and Corbin, 1990). This yielded a variety of codes that characterized understanding and interpretation of the Michaelis–Menten graph, conceptual reasoning about enzyme kinetics and inhibition types, and mathematical reasoning. During data analysis it was determined sufficient data saturation had been reached based on the lack of additional codes or themes that emerged from the data (Saunders et al., 2018). In order to establish inter-rater reliability, after coding the entire dataset, an additional researcher was given the code descriptions, which was used to code two interviews. Using the NVivo qualitative data analysis software, a Kappa value of 0.88 was calculated. After discussing the coding and discrepancies, changes were made to the code descriptions and code assignments, and a Kappa of 0.95 was calculated. The finalized coding scheme was subsequently used to recode the entire dataset (Charmaz, 2006).
Resource graphs
As discussed by Hammer et al. (2005), resources are fine-grained and emergent in nature, and in practice, this creates a challenging task for researchers attempting to identify students’ resources. We acknowledge the fractal nature of resources, in which a given resource may be composed of even smaller resources, and as a practical consideration, analysis focused on observable resources and the evidence that connected these resources (Wittmann, 2006). In order to aid in the discussion of our results, we utilized resource graphs, which provide a representation of the connections between a student's resources (Wittmann, 2006; Sayre and Wittmann, 2008). A resource graph was created for each student to describe their reasoning for each inhibition type (competitive, noncompetitive, uncompetitive). An Appendix is available that provides all resource graphs for this study (ESI†). For an example of a resource graph, see Table 3. Note that resources are depicted as circles and connections between resources are indicated by solid lines, which were determined based on statements made by students during the interviews. In Table 3, example student quotes are provided to illustrate how student discussions were translated to connections between resources in a resource graph.Findings
Analysis of the data yielded distinct ways in which students reasoned about enzyme kinetics and enzyme inhibition. Within the context of how students analyzed and interpreted the data provided, the students attended to the relevant parameters in the provided graph and discussed how the information extracted from the graph had implications for the type of enzyme inhibition observed. Examples of students’ responses and written work are provided in the following sections to illustrate these themes.Attending to relevant parameters
In the interview prompt the students were provided data in the form of a graph and they were asked to draw conclusions and make inferences. In their responses to this prompt, participants cued into the observed changes in Vmax and Km. The following quote provides an example of how Alan reasoned through the prompt and extracted information from the graph:Alan: “So, this graph has a blue line with no inhibitor, a red line with inhibitor one, the red line with inhibitor one has the same Vmax, so we're going to say that no inhibitor [blue curve] has Vmax1. Inhibitor number one [red curve] also has Vmax1, however it takes a little bit longer for it to reach Vmax1. It doesn't take longer, it takes more substrate to reach Vmax1. And inhibitor number two [green curve], we're going to say that's roughly one-half Vmax1, or Vmax2. … And, with the no inhibitor [blue curve], so what you've got is the Kmgoes forward a little bit, so we're going to say that no inhibitor [blue curve] has Km1, inhibitor number one [red curve] has Km2, and inhibitor number two [green curve] has Km1.”
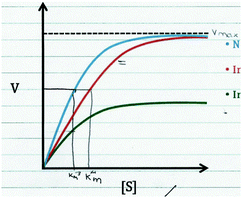
Combining Alan's response above with his written work in Fig. 2, it can be seen that Alan drew directly on the graph, focusing on how the Vmax and Km values of the No Inhibitor curve compared to Inhibitor #1 and Inhibitor #2. Alan stated that in comparison to the No Inhibitor curve, Inhibitor #1 had the same Vmax and a different Km, whereas Inhibitor #2 had a different Vmax and the same Km. Students’ ability to attend to the relevant changing parameters in an enzyme kinetics graph is important because based on how these parameters change, conclusions can be made about the type of inhibitor reflected in the data (based on his discussion of the changing parameters, Alan later correctly indicated that that Inhibitor #1 was a competitive inhibitor and Inhibitor #2 was a noncompetitive inhibitor).
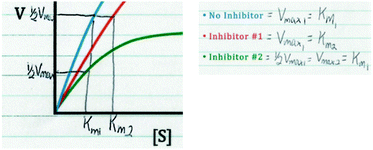 | ||
| Fig. 2 Alan's written work, showing his analysis and discussion of the relevant parameters in the enzyme inhibition graph. | ||
As shown in Table 4, most students correctly determined how Km and Vmax changed and subsequently associated the observed changes to the correct inhibition type. This was particularly the case with Inhibitor #1, which a large majority of students identified as a competitive inhibitor. In the case of the second inhibitor, there was less of a consensus, with more students misinterpreting the information presented in the graph. In the next section we describe students’ discussion of each of the inhibition types and how the inhibitors interact with the enzyme.
| Student | Inhibitor #1 (red curve) | Inhibitor #2 (green curve) | ||||
|---|---|---|---|---|---|---|
| K m | V max | Conclusion | K m | V max | Conclusion | |
| a Student had difficulty interpreting the graph, did not provide a response regarding how the parameters change for Inhibitor #1, and did not reach a conclusion regarding the identity of Inhibitor #1, “I don't remember how to determine what type of inhibition. I can tell you the mechanisms for the different types of inhibition, and that's it.” (Karen). | ||||||
| Sarah | Higher | Same | Competitive | Same | Lower | Uncompetitive |
| Ellie | Higher | Same | Competitive | Same | Lower | Noncompetitive |
| Kelly | Higher | Same | Competitive | Lower | Lower | Uncompetitive |
| Alan | Higher | Same | Competitive | Same | Lower | Noncompetitive |
| Amanda | Higher | Same | Competitive | Same | Higher | Noncompetitive |
| Cathy | Higher | Same | Noncompetitive | Same | Lower | Competitive |
| Lex | Higher | Same | Competitive | Same | Lower | Noncompetitive |
| Malcolm | Higher | Same | Competitive | Same | Lower | Noncompetitive |
| Zara | Higher | Same | Competitive | Same | Lower | Noncompetitive |
| Vivian | Higher | Same | Competitive | Lower | Lower | Noncompetitive |
| Karena | — | — | — | Same | Lower | Competitive |
| Tim | Higher | Same | Competitive | Same | Lower | Noncompetitive |
| Claire | Higher | Same | Competitive | Higher | Lower | Mixed |
| Carrie | Higher | Same | Competitive | Same | Lower | Noncompetitive |
Competitive inhibitors “compete” for the active site
After reasoning about the Vmax and Km values on the graph, students associated this with a type of enzyme inhibition (e.g., competitive, noncompetitive, uncompetitive) and discussed the implications for the mechanism at the particulate-level. In addition to correctly identifying Inhibitor #1 as a competitive inhibitor, students tended to have a scientifically normative understanding of competitive inhibitors and how they interact with enzymes. All students in the sample correctly indicated that competitive inhibitors bind to the active site of an enzyme (instead of the substrate), exemplified in Sarah's description:Sarah: “So it's still, like the way competitive inhibitors work is that say you have XYZ, you know, enzyme or whatever. And normally you got this substrate that comes in, and it binds to it, and then you get, you know, product. How the competitive inhibitor works is that you, you got your enzyme right here … Enzyme right here. And so instead of the sub-, normal substrate coming in you got inhibitor comes in, blocks up that binding site, so substrate can't bind. And then it might, you know, muck up the enzymes that you don't make any product, like nothing happens. It just, binds up the enzyme and takes it up and so no substrate can be bind so than nothing can be produced.”
As shown in Fig. 3, Sarah also drew a picture to indicate how the competitive inhibitor binds to the enzyme to prevent the substrate from binding and forming products. Additionally, a large majority of students correctly identified how a competitive inhibitor influences the kinetic parameters (i.e., does not influence Vmax, increases Km).
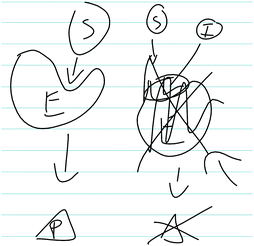 | ||
| Fig. 3 Sarah's written work, illustrating her discussion of how a competitive inhibitor interacts with an enzyme. In the figure: E (enzyme), S (substrate), P (product), I (inhibitor). | ||
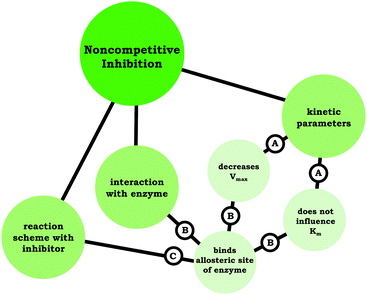
Moving beyond associating changes in the kinetic parameters with a specific inhibition type, we are interested in how students connected relevant ideas. Thus, resource graphs were made to characterize how each of the participants viewed competitive, noncompetitive, and uncompetitive enzyme inhibition (see associated Appendix for all resource graphs, ESI†). In Fig. 4 we have provided Ellie's resource graph for competitive inhibition. Consistent with the larger sample, Ellie indicated in her interview that competitive inhibitors do not influence Vmax, increase Km, and bind to the active site of an enzyme, which has implications for the reaction scheme (i.e., E + S ⇌ ES → E + P). The key point of the resource graphs is to cue into the connection between ideas, for example, Ellie provided an explanation for the observed changes in Vmax and Km associated with competitive inhibitors:
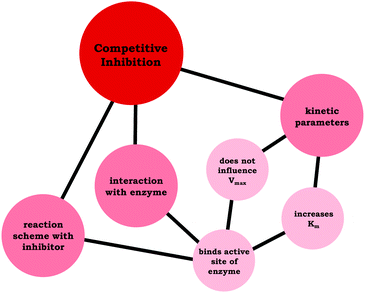 | ||
| Fig. 4 Ellie's resource graph, which indicates the connections the student made between resources related to competitive inhibition. | ||
Ellie: “It's competitive because basically what's happening is the inhibitor is binding to the enzyme active site, so it's blocking the substrate from binding with the enzyme as well. That's meaning that it's changing the affinity for the enzyme for the substrate, but it's not changing the maximum rate. Because if you add more substrate, then you will saturate the enzyme … and reach the same maximum rate that you would have gotten without the inhibitor.”
We assert that the connection between the observed changes in the kinetic parameters and the mechanism associated with an inhibitor is critical and should be one of the primary instructional objectives for enzyme kinetics, because it is this connection that allows students to understand enzyme kinetics, instead of simply memorizing a table of Vmax and Km values. Across our sample, although nearly all of the students described the correct changes in the parameters and how the competitive inhibitors interacted with enzymes, students had difficulty connecting the relevant changes in Km and Vmax to the mechanism of competitive inhibition (even after prompting), suggesting a more fragmented understanding. To illustrate this idea, consider the discussion below involving Amanda:
Interviewer: “And then why is it that they change these specific parameters? So why does competitive change Km, but not Vmax?”
Amanda: “I think it's because the amount of substrate actually being taken in or being binded to the enzyme it increases but it's inhibited … So, yeah, I think it's the amount of substrate that's being taken in is just … it shouldn't be increased, but it is. Do you know what I mean? … I know this is wrong, but I'm just going to say the amount of substrate being taken in is increased. Yeah. … But the Vmaxstays the same so the amount … I don't know. You know what? I'm just going to end it there.”
Amanda previously discussed how the parameters change for competitive inhibition (Fig. 5) and illustrated a clear understanding regarding the interaction between enzymes and competitive inhibitors earlier in her interview; however, she struggled to connect these ideas. For the sake of comparison, we have provided Amanda's resource graph (Fig. 6), drawing the reader's attention to the difference in connectivity in comparison to Ellie's resource graph (Fig. 4), in which Amanda did not relate the particulate-level description of the enzyme-inhibitor interactions (binds active site) with the changing kinetic parameters (does not influence Vmax and increases Km).
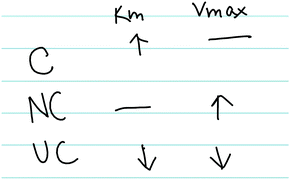 | ||
| Fig. 5 Amanda's written work, illustrating how competitive (C), noncompetitive (NC), and uncompetitive (UC) inhibitors influence Km and Vmax. | ||
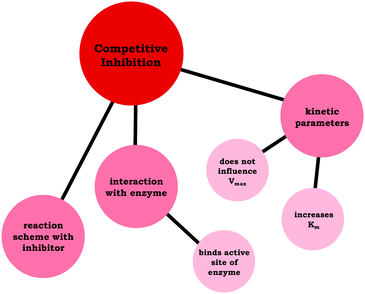 | ||
| Fig. 6 Amanda's resource graph, which indicates the connections the student made between resources related to competitive inhibition. | ||
Noncompetitive vs. uncompetitive inhibition
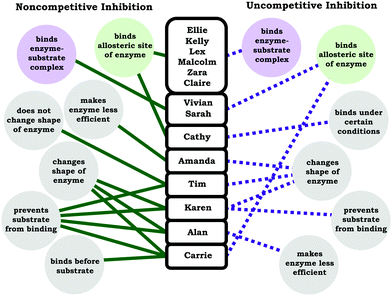
Similar to what was observed for students’ understanding of competitive inhibition, the students tended to correctly state the influence on the kinetic parameters for noncompetitive and uncompetitive inhibition, but there was less of a consensus regarding how students reasoned about the associated mechanisms (molecular-level description). In the case of noncompetitive inhibition, although a large majority of students discussed the relevant mechanism (inhibitor binds allosteric site), there was a large variety of student responses regarding what differentiated noncompetitive and uncompetitive inhibitors in terms of how they physically interact with the enzyme. Less than half of the students correctly made the distinction that uncompetitive inhibitors can only bind the enzyme–substrate complex. In Fig. 7 we have provided ideas students used to distinguish between noncompetitive and uncompetitive inhibition.Our intention with the student responses in Fig. 7 is not to emphasize and evaluate the validity of each of these ideas, instead we seek to draw attention to some conclusions that can be drawn from the range of responses. First, we would like to note that students had a variety of productive ideas for reasoning about enzymes and how they interact in general terms. For example, binding (of substrate or inhibitor) may result in conformational changes or physical distortions of the enzyme; nevertheless, these are not the primary and salient features that differentiate noncompetitive inhibition from uncompetitive inhibition. Secondly, in Fig. 7 we have used color to characterize statements that best described noncompetitive inhibition (green) and uncompetitive inhibition (purple), which highlights that there were instances when students conflated terms. For instance, Vivian stated:
Vivian: “With non-competitive the inhibitor will only bind to the enzyme–substrate complex only if the enzyme and substrate are bound. In the noncompetitive, it binds to the enzyme–substrate complex and I'm not really sure after that why exactly, I think maybe it lowers the, yeah because the Kmis smaller in a non-competitive because it will bind more tightly to the enzyme substrate complex rather than if it wasn't complex. And then it lowers the Vmaxbecause … I'm not really sure why it lowers the Vmaxbut I'm pretty sure it does. Yeah, I'm not really sure why.”
In the example above, Vivian's discussion of the parameters changing and the interaction between the inhibitor and the enzyme is internally consistent, but she assigned the incorrect “vocabulary” term to her description. This was also the case with Vivian's discussion of uncompetitive inhibition:
Vivian: “Uncompetitive is when, okay let's see, the inhibitor will bind on the enzyme somewhere other than the active site, so it doesn't always affect the Kmbut if it's a mix inhibitor it can affect, or it will affect the Kmif it is a mixed inhibitor. But for uncompetitive it just, I think it combines to either just the substrate or the substrate, or sorry, just the enzyme or the enzyme–substrate complex. I think it can bind to either one of those. But a true uncompetitive won't affect the Kmbut it will decrease the Vmax.”
As before with noncompetitive inhibition, Vivian simply attributed the wrong label (the association of the changing parameters with the mechanism was correct), indicating a wholesale switch between the terms noncompetitive and uncompetitive, which was observed with Sarah and (to a lesser extent) Carrie.
The observed confusion regarding noncompetitive and uncompetitive inhibition is understandable. In the case of competitive inhibition, the mechanism is implied in the name from colloquial use of competitive, and multiple students in the sample productively used phrases such as “competes for the active site” to describe competitive inhibition. However, drawing conclusions based solely on noncompetitive and uncompetitive is not as straightforward, and students indicated confusion regarding the similar terms:
Ellie: “These names are confusing. … We took a quiz. I knew it wasn't competitive and I knew that it wasn't non but I couldn't think what the last word was and my brain just kept telling me it was uncompetitive and I kept thinking those are synonyms, that can't be it … That can be confusing.”
As discussed previously, we assert that the important connections that should be emphasized involve the mechanism of the inhibitors and their influence on kinetic parameters, but as in the case of competitive inhibition, less students made these connections (particularly in the case of uncompetitive inhibition). Nevertheless, there were instances in which students did make the relevant connections. Among the students that expressed a scientifically normative distinction between noncompetitive and uncompetitive inhibition, all six students connected the noncompetitive inhibition changes in Km and Vmax to its mechanism, and four students connected the uncompetitive inhibition changes in Km and Vmax to its mechanism. For example, when discussing noncompetitive inhibition, Zara stated:
Zara: “The Kmvalue's unchanged because in noncompetitive it's bonding to a site other than the active site, allosteric, I think to it. So it can't reach Vmaxbecause even if you saturate it with substrate you have like another site where the inhibitor's gonna bind so it doesn't really matter. But yeah, the Kmstays the same because you have two separate sites that the substrates bind to and where the inhibitor's binding to.”
In Zara's discussion she drew connections to the kinetic parameters and the mechanism, and it is important to note that these connections are mediated by moving beyond technical definitions, that is, viewing Vmax as more than the dotted line on the graph and Km as more than simply the substrate concentration at half of the Vmax. Although these definitions are useful and productive for interpreting the graph, when reasoning about the mechanism, students need to reason in terms of the implications that Km has for enzyme–substrate affinity. This is clear in Lex's discussion of uncompetitive inhibition:
Lex: “So no matter how much concentration of substrate you put in, it doesn't matter because it's not competing for it at the active site. So that's why your Vmaxdecreases, but I don't understand why the Kmdoes. I just know it does.”
Initially Lex was unsure why Km decreases for uncompetitive inhibition, but earlier in her interview she discussed Km as providing information about binding and affinity between the substrate and enzyme, and upon prompting, Lex was able to use this knowledge to discuss a reasonable explanation regarding the observed influence on Km:
Interviewer: “And so before you had also talked about Kmas like thinking in terms of affinity, right?”
Lex: “Yeah.”
Interviewer: “Or like binding?”
Lex: “Yes.”
Interviewer: “How might that explain why this value changes when the inhibitor binds for uncompetitive?”
Lex: “I guess maybe, this is total ballpark. There might be something on the actual inhibitor that does bind to both the enzyme and the substrate. No, well, I don't know. There just might be something [draws line protruding from inhibitor, seeFig. 8] on the inhibitor that can maybe help the substrate bind to the enzyme so that the inhibitor can inhibit the enzyme. I don't know if that's possible with molecules but there might be something on the actual inhibitor itself that encourages the substrate to bind in the active site so then the inhibitor can fully bind to the enzyme–substrate complex and inhibit it. … So either that or the inhibitor could maybe bind partially to the enzyme without a substrate inside of it, and that itself also encourages maybe more substrate to interact with the enzyme, and then once both of those two have bound then it can actually fully inhibit the enzyme. So like, yeah. … 'Cause then that would end up decrease the Kmbut then also decreasing the Vmax.”
The discussion above illustrates the importance of understanding what students know and using this knowledge to support students in making connections. Although Lex expressed uncertainty regarding the connection between the mechanism associated with an uncompetitive inhibitor and the observed decrease in Km, when she was reminded about the implications Km has for binding, she constructed a sophisticated model to explain why the affinity increases, in which her description involved drawing an inhibitor that interacts with both the enzyme and the substrate (Fig. 8).
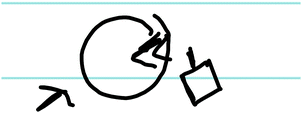 | ||
| Fig. 8 Lex's written work, illustrating the interaction between the enzyme–substrate complex and an uncompetitive inhibitor. | ||
Limitations
Due to the small sample size the generalizability of the results are limited; however, the themes elicited from these data have implications for instruction on this topic. In addition, our data does not provide insight into whether a student is unable to engage in science practices, rather, we can only make claims about whether or not the prompts elicited student engagement in science practices. Furthermore, there is some overlap between various science practices (they are not mutually exclusive); for example, it is possible to engage in the science practice of developing and using models while simultaneously using mathematics and computational thinking. This reflects how science is done, in the sense that researchers have access to a variety of skills and tools that they may use in tandem to approach a problem or answer a question. This can make it challenging to draw conclusions about a students’ engagement in one specific science practice. However, it is not necessary to parse out each science practice, what is more important is that the students are engaging in science practices. As a whole the science practices are well-articulated, which allows instructors to promote and assess students’ engagement in science practices, or more broadly, students’ engagement in critical thinking (Stowe and Cooper, 2017).It should also be noted that some students did not necessarily use vocabulary such as active site when describing where the substrate binds the enzyme or allosteric site when describing a region distinct from the active site; instead students often used descriptive phrases, which is consistent with previous work that indicated students have difficulty with the different vocabulary used to describe interaction sites on an enzyme (Linenberger and Bretz, 2015). In order to simplify analysis and presentation of the results in the resource graphs, we did not make a distinction based on the strict use of the phrases active site and allosteric site; instead, students’ reasoning was the focus of analysis.
Conclusions and implications
In terms of engaging in the science practice analyzing and interpreting data, this work indicated that students consistently (correctly) identified how the kinetic parameters changed in the graph and associated these changes to a particular type of enzyme inhibition. Moreover, the data provided insight regarding how the students conceptualized each of the inhibitors, an analysis that was aided by the use of resource graphs. Based on the resource graphs for each students’ conception of each inhibitor, a composite resource graph was created to illustrate the frequency with which students made the indicated connections between relevant ideas, shown in Fig. 9. As discussed previously, one of the areas students needed support was drawing connections between how the mechanism relates to and dictates the changing parameters. Furthermore, few students expressed a scientifically normative understanding of the distinction between noncompetitive and uncompetitive inhibition, which seems to be largely due to confusion regarding the latter. Nevertheless, given what has been discussed, students in our sample would likely score well on typical assessments related to enzyme kinetics, because exams—such as the exams for the course discussed herein—tend to focus on how inhibitors interact with an enzyme and how inhibitors influence Vmax and Km; however, we assert the importance of encouraging students to reason in a way that connects these ideas (e.g., Why does a competitive inhibitor increase Kmbut not affect Vmax?). Nevertheless, before students can make these types of connections, they must be able to move beyond the issue of confusing nomenclature.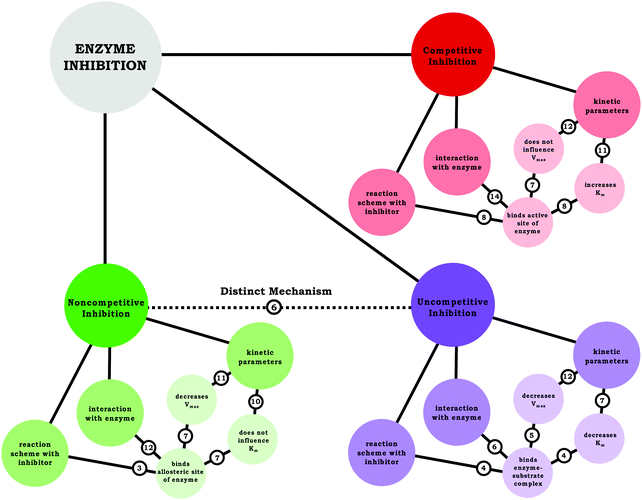 | ||
| Fig. 9 Summary of students’ understanding of each inhibition type using resource graphs, illustrating the number of students’ that made the indicated connection. | ||
As discussed previously, students tended to blur the distinction between the similarly named noncompetitive and uncompetitive inhibition types. In our study, students were only explicitly asked about competitive, noncompetitive, and uncompetitive inhibition, but more than half of the students referenced mixed inhibition during their interviews. Although the data on students’ conception of mixed inhibition is not robust enough to make extensive claims, it is worth mentioning because students’ discussion of mixed inhibition further suggested the need for clarity and consistency regarding the use of enzyme kinetics terminology. Part of the challenge of analyzing student understanding of mixed inhibition is the different ways in which mixed inhibition is presented in textbooks. For example, in the assigned textbook for the course (Appling et al., 2016), noncompetitive inhibition is framed as a special case of mixed inhibition, in which the inhibitor binds the free enzyme and the enzyme–substrate complex with equal affinity. Contrastingly, Voet and Voet (2011, p. 495) seem to use noncompetitive and mixed interchangeably, “If both enzyme and the enzyme–substrate complex bind the inhibitor … Both of the inhibitor-binding steps are assumed to be at equilibrium, but with different dissociation constants … This phenomenon is alternatively known as mixed inhibition or noncompetitive inhibition”; however, the authors later qualify this statement by commenting that “in ambiguity of nomenclature” noncompetitive inhibition can be used to characterize the special case where the dissociation constant is the same for the inhibitor binding the free enzyme and the enzyme–substrate complex. Moreover, Berg et al. (2015, p. 235) seems to avoid the use of this term, with only a brief mention of mixed inhibition after discussing competitive, uncompetitive, and noncompetitive inhibition, “A more complex pattern, called mixed inhibition, is produced when a single inhibitor both hinders the binding of substrate and decreases the turnover of the enzyme [emphasis in original].” In the chemistry education community, the inconsistency and “mixed” feelings regarding nomenclature has been noted, such that when describing enzyme inhibition authors have explicitly stated how they operationalized the terms mixed and noncompetitive; for examples, see footnotes in Ochs (2000) and Waldrop (2009).
Based on our work, we suggest instructors teaching enzyme kinetics should reframe enzyme inhibition to focus on how the different inhibition types are related to one another and how the mechanism of inhibition is related to the observed changes in the kinetic parameters—with assessment reflecting this emphasis, since instructors communicate the importance placed on ideas based on what is assessed (Cooper, 2015). In terms of more explicitly drawing connections across the inhibition types, we find Ochs’ (2000) discussion of enzyme inhibition to be particularly useful: “Another way of looking at reversible inhibition is that all three types of inhibition–competitive, uncompetitive, and mixed with equal affinities for (E) and (ES) [pure noncompetitive]—are just limiting cases of a single more general type in which the inhibitor has some affinity for both enzyme forms.” This conceptualization draws attention to the fact that competitive, noncompetitive, and uncompetitive are simply single points on an “inhibition continuum” where the inhibitor preferentially binds the free enzyme and enzyme–substrate complex to varying degrees. Thus, competitive inhibition and uncompetitive inhibition reflect two ends of a spectrum where the inhibitor only binds the free enzyme or only binds the enzyme–substrate complex, respectively, and anything between these two poles is a mixture (i.e., mixed inhibition, with noncompetitive inhibition being a special case), as shown in Fig. 10. This explicit discussion of how each of the inhibition types relates to one another is one way to help clarify and contextualize the various vocabulary terms used in enzyme inhibition.
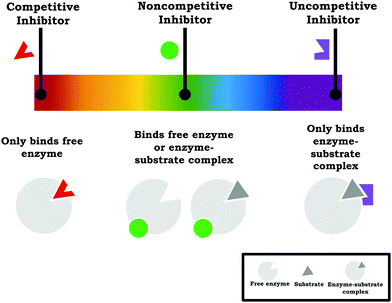 | ||
| Fig. 10 The commonly taught inhibition types (competitive, noncompetitive, and uncompetitive) can be viewed as discrete points on a spectrum of inhibition types. | ||
Furthermore, although it is useful to acknowledge that each of the inhibition types exist (as described above, to provide context and organize the ideas), in order to ensure that students have a more comprehensive understanding of enzyme kinetics and inhibition, instruction should narrow the scope of what is required of students. Rather than having students memorize the changes in parameters associated with competitive, noncompetitive, mixed, and uncompetitive, for an introductory biochemistry course we suggest only having students learn competitive inhibition and noncompetitive inhibition, focusing on a deeper understanding that encompasses the connection between the mechanism and the changing kinetic parameters (i.e., modify learning objectives and communicate to students that only these inhibition types will be assessed). The reason why we suggest these two types of inhibition is because of their relative simplicity, which makes them useful for providing a context to introduce enzyme inhibition concepts—competitive and noncompetitive each only influence one kinetic parameter (which makes them easier to identify graphically from Michaelis–Menten and Lineweaver–Burk plots) and reasonable explanations regarding why they influence the relevant parameters can be summarized tersely (as observed among the students in our sample). Furthermore, shifting the focus to competitive inhibition and noncompetitive inhibition alleviates the potential for noncompetitive/uncompetitive confusion, as well as the need to make the pure/mixed distinction.
The study described herein reflects initial work on an understudied topic, and future research is needed to further investigates areas of interest, such as the pedagogical efficacy of the practitioner resources discussed previously (e.g., use of analogies in enzyme kinetics) and understanding how to better situate enzyme kinetics in terms of its relationship to chemical kinetics ideas typically taught in general chemistry. The findings discussed also suggest additional work to explore conceptions of terms such as mixed inhibition—among students and biochemistry faculty.
Conflicts of interest
There are no conflicts to declare.Acknowledgements
We wish to thank Kinsey Bain, Michael Mack, and the Towns research group for their support and helpful comments on the manuscript.Notes and references
- Abel K. and Halenz D., (1992), Enzyme Activity: A Simple Analogy, J. Chem. Educ., 69(1), 9.
- Aledo J., Lobo C. and Del Valle A., (2003), Energy Diagrams for Enzyme-catalyzed Reactions: Concepts and Misconcepts, Biochem. Mol. Biol., 31(4), 234–236.
- Antuch M., Ramos Y. and Alvarez R., (2014a), Simulated Analysis of Linear Reversible Enzyme Inhibition with SCILAB, J. Chem. Educ., 91, 1203–1206.
- Antuch M., Ramos Y. and Alvarez R., (2014b), Addition to Simulated Analysis of Linear Reversible Enzyme Inhibition with SCILAB, J. Chem. Educ., 91, 2221–2221.
- Appling D. R., Anthony-Cahill S. J. and Matthews C. K., (2016), Biochemistry: Concepts and Connections, 1st edn, Harlow, England: Pearson Education Limited.
- Bain K. and Towns M. H., (2016), A review of research on the teaching and learning of chemical kinetics, Chem. Educ. Res. Pract., 17(2), 246–262.
- Bain K. and Towns M. H., (2018), Investigation of Undergraduate and Graduate Chemistry Students’ Understanding of Thermodynamic Driving Forces in Chemical Reactions and Dissolutions, J. Chem. Educ., 95(4), 512–520.
- Bain K., Rodriguez J. G., Moon A. and Towns M. H., (2018a), The characterization of cognitive processes involved in chemical kinetics using a blended processing framework, Chem. Educ. Res. Pract., 19, 617–628.
- Bain K., Rodriguez J. G. and Towns M. H., (2018b), Zero-Order Chemical Kinetics as a Context To Investigate Student Understanding of Catalysts and Half-Life, J. Chem. Educ., 95(5), 716–725.
- Bain K., Rodriguez J. G. and Towns M. H., (2019a), Investigating Student Understanding of Rate Constants: When is a Constant ‘Constant’? J. Chem. Educ., Submitted.
- Bain K., Rodriguez J. G. and Towns M. H., (2019b), Mathematics in Chemical Kinetics: Which is the Cart and Which is the Horse? in Towns M. H., Bain K. and Rodriguez J. G. (ed.), It's Just Math: Research on Students' Understanding of Chemistry and Mathematics, Washington, D.C.: American Chemical Society, vol. 1316, in press.
- Barton J. A., (2011), Comprehensive Enzyme Kinetics Exercise for Biochemistry, J. Chem. Educ., 88(9), 1336–1339.
- Bearne S., (2012), Illustrating Enzyme Inhibition Using Gibbs Energy Profiles, J. Chem. Educ., 89(6), 732–737.
- Bearne S., (2014), Illustrating the effect of pH on Enzyme Activity Using Gibbs Energy Profiles, J. Chem. Educ., 91(1), 84–90.
- Becker N. and Towns M. H., (2012), Students’ understanding of mathematical expressions in physical chemistry contexts: an analysis using Sherin's symbolic forms, Chem. Educ. Res. Pract., 13(3), 209–220.
- Becker N. M., Rupp C. A. and Brandriet A., (2017), Engaging students in analyzing and interpreting data to construct mathematical models: an analysis of students’ reasoning in a method of initial rates task, Chem. Educ. Res. Pract., 18(4), 798–810.
- Berg J. M, Tymoczko J. L., Gatto G. J. and Stryer L., (2015), Biochemistry, New York, NY: W. H. Freeman & Company.
- Bezerra R. and Dias A., (2007), Utilization of Integrated Michaelis-Menten Equation to Determine Kinetic Constants, Biochem. Mol. Biol. Educ., 35(2), 145–150.
- Birks M., Chapman Y. and Francis K., (2008), Memoing in qualitative research: probing data and processes, J. Res. Nurs., 13(1), 68–75.
- Bodner G. M. and Weaver G., (2008), Research and practice in chemical education in advanced courses, Chem. Educ. Res. Pract., 9, 81–83.
- Bretz S. L. and Linenberger K. J., (2012), Development of the Enzyme–Substrate Interactions Concept Inventory, Biochem. Mol. Biol. Educ., 40(2), 229–233.
- Bruist M., (1998), Use of a Spreadsheet to Simulate Enzyme Kinetics, J. Chem. Educ., 75(3), 372–375.
- Cakmakci G., (2010), Identifying Alternative Conceptions of Chemical Kinetics Among Secondary School and Undergraduate Students in Turkey, J. Chem. Educ., 87, 449–455.
- Cakmakci G. and Aydogdu C., (2011), Designing and Evaluating an Evidence-informed Instruction in Chemical Kinetics, Chem. Educ. Res. Pract., 12(1), 15–28.
- Cakmakci G., Leach J. and Donnelly J., (2006), Students’ ideas about reaction rate and its relationship with concentration or pressure, Int. J. Sci. Educ., 28, 1795–1815.
- Charmaz K., (2006), Constructing grounded theory: a practical guide through qualitative analysis, Thousand Oaks, CA: Sage Publications.
- Clark A., (2004), Lucenz Simulator: A Tool for the Teaching of Enzyme Kinetics, Biochem. Mol. Biol. Educ., 32(3), 201–206.
- Cooper M. M., (2013), Chemistry and the Next Generation Science Standards, J. Chem. Educ., 90(6), 679–680.
- Cooper M., (2015), Why ask why? J. Chem. Educ., 92(8), 1273–1279.
- Cooper M. M. and Stowe R. L., (2018), Chemistry Education Research—From Personal Empiricism to Evidence, Theory, and Informed Practice, Chem. Rev., 118, 6053–6087.
- Cooper M. M., Posey L. A. and Underwood S. M., (2017), Core Ideas and Topics: Building Up or Drilling Down? J. Chem. Educ., 94(5), 541–548.
- Cruz-Ramirez de Arellano D. and Towns M. H., (2014), Students’ understanding of alkyl halide reactions in undergraduate organic chemistry, Chem. Educ. Res. Pract., 15, 501–515.
- Frezza B. M., (2011), Michaelis–Menten Enzyme Kinetics and the Steady-State Approximation, http://demonstrations.wolfram.com/MichaelisMentenEnzymeKineticsAndTheSteadyStateApproximation/, Wolfram Demonstrations Project.
- Gegios T., Salta K. and Koinis S., (2017), Investigating High-school Chemical Kinetics: The Greek Chemistry Textbook and Students’ Difficulties, Chem. Educ. Res. Pract., 18(1), 151–168.
- Gonzalez-Cruz J., Rodriguez-Sotres R. and Rodriguez-Penagos M., (2003), On the Convenience of Using a Computer Simulation to Teach Enzyme Kinetics to Undergraduate Students with Biological Chemistry-related Curricula, Biochem. Mol. Biol. Educ., 31(2), 93–101.
- Guerra N. P., (2017), Enzyme Kinetics Experiment with the Multienzyme Complex Viscozyme L and Two Substrates for the Accurate Determination of Michaelian Parameters, J. Chem. Educ., 94(6), 795–799.
- Hamilton T., Dobie-Galuska A. and Wiestock S., (1999), The o-Phenylenediamine-Horseradish Peroxidase System: Enzyme Kinetics in the General Chemistry Laboratory, J. Chem. Educ., 76(5), 642–644.
- Hammer D. and Elby A., (2003), Tapping epistemological resources for learning physics, J. Learn. Sci., 12(1), 53–90.
- Hammer D., Elby A., Scherr R. E. and Redish E. F., (2005), Resources, framing, and transfer, in Mestre J. P. (ed.), Transfer of learning from a modern multidisciplinary perspective, Greenwich, CT: Information Age Publishing.
- Harle M. and Towns M. H., (2012a), Students’ Understanding of External Representations of the Potassium Ion Channel Protein Part I: Affordances and Limitations of Ribbon Diagrams, Vines, and Hydrophobic/Polar Representations, Biochem. Mol. Biol. Educ., 40(6), 349–356.
- Harle M. and Towns M. H., (2012b), Students’ Understanding of External Representations of the Potassium Ion Channel Protein Part II: Structure Function Relationships and Fragmented Knowledge, Biochem. Mol. Biol. Educ., 40(6), 357–363.
- Harle M. and Towns M. H., (2013), Students' understanding of primary and secondary protein structure: drawing secondary protein structure reveals student understanding better than simple recognition of structures, Biochem. Mol. Biol. Educ., 41(6), 369–376.
- Heinzerling P., Shrader F. and Schanze S., (2012), Measurement of Enzyme Kinetics by Use of a Blood Glucometer: Hydrolysis of Sucrose and Lactose, J. Chem. Educ., 89(12), 1582–1586.
- Heisterkamp K. and Talanquer V., (2015), Interpreting Data: The Hybrid Mind, J. Chem. Educ., 92(12), 1988–1995.
- Helser T., (1991), Enzyme Activity: The Ping-Pong Ball Torture Analogy, J. Chem. Educ., 68, 286–287.
- Howard R., Herr J. and Hollister R., (2006), Using Trypsin & Soybean Trypsin Inhibitor, Am. Biol. Teach., 68(2), 99–104.
- Hinckley G., (2012), A Method for Teaching Enzyme Kinetics to Nonscience Majors, J. Chem. Educ., 89(9), 1213–2014.
- Holme T. and Murphy K., (2013), The ACS Exams Institute Undergraduate Chemistry Anchoring Concepts Content Map II: Organic Chemistry, J. Chem. Educ., 90, 1443–1445.
- Holme T., Luxford C. and Murphy K., (2015), Updating the General Chemistry Anchoring Concepts Content Map, J. Chem. Educ., 92, 1115–1116.
- Holme T., Reed J., Raker J. and Murphy K., (2018), The ACS Exams Institute Undergraduate Chemistry Anchoring Concepts Content Map IV: Physical Chemistry, J. Chem. Educ., 95, 238–241.
- House C., Meades G. and Linenberger K. J., (2016), Approaching a Conceptual Understanding of Enzyme Kinetics and Inhibition: Development of an Active Learning Inquiry Activity for Prehealth and Nonscience Majors, J. Chem. Educ., 93, 1397–1400.
- Johnson K., (2000), A Simple Method for Demonstrating Enzyme Kinetics Using Catalase from Beef Liver Extract, J. Chem. Educ., 77(11), 1451–1452.
- Johnson K. A., (2009), Fitting Enzyme Kinetic Data with KinTek Global Kinetic Explorer, Methods Enzymol., 467, 601–626.
- Johnson K. A., Simpson Z. B. and Blom T., (2009), Global Kinetic Explorer: a new computer program for dynamic simulation and fitting of kinetic data, Anal. Biochem., 387, 20–29.
- Junker M., (2010), A Hands-on Classroom Simulation to Demonstrate Concepts in Enzyme Kinetics, J. Chem. Educ., 87(3), 294–295.
- Justi R., (2002), Teaching and learning chemical kinetics, in Gilbert J. K., De Jong O., Justi R., Treagust D. and Van Driel J. H. (ed.), Chemical Education: Towards Research-based Practice, Dordrecht, Kluwer, pp. 293–315.
- King N. and Horrocks C., (2010), Interviews in qualitative research, London: Sage Publications, Ltd.
- Kolomuc A. and Tekin S., (2011), Chemistry Teachers’ Misconceptions Concerning Concept of Chemical Reaction Rate, Eurasian J. Phys. Chem. Educ., 3(2), 84–101.
- Lamichhane R., Reck C. and Maltese A. V., (2018), Chem. Educ. Res. Pract., 19, 834–845.
- Lang F. K., (2018), Understanding Perceptions and Beliefs Biochemistry Instructors Hold and the Influence These Factors Have on Their Personal Style of Teaching, PhD thesis, Purdue University, West Lafayette, IN.
- Laverty J. T., Underwood S. M., Matz R. L., Posey L. A., Jardeleza E. and Cooper M. M., (2016), Characterizing College Science Assessments: The Three-Dimensional Learning Assessment Protocol, PLoS One, 11(9), 1–21.
- Lechner J. H., (2011), More Nuts and Bolts of Michaelis–Menten Enzyme Kinetics, J. Chem. Educ., 88, 845–846.
- Linenberger K. J. and Bretz S. L., (2012), A novel technology to investigate students' understandings of enzyme representations, J. Coll. Sci. Teach., 42(1), 45–49.
- Linenberger K. J. and Bretz S. L., (2014), Biochemistry Students’ Ideas About Shape and Charge in Enzyme–Substrate Interactions, Biochem. Mol. Biol. Educ., 42(3), 203–214.
- Linenberger K. J. and Bretz S. L., (2015), Biochemistry Students’ Ideas About How an Enzyme Interacts with a Substrate, Biochem. Mol. Biol. Educ., 43(4), 213–222.
- Loertscher J., Green D., Lewis J. E., Lin S. and Minderhout V., (2014), Identification of Threshold Concepts for Biochemistry, CBE-Life Sci. Educ., 13, 516–528.
- Marek K., Raker J., Holme T. and Murphy K., (2018), The ACS Exams Institute Undergraduate Chemistry Anchoring Concepts Content Map III: Inorganic Chemistry, J. Chem. Educ., 95, 233–237.
- Murkin A., Commentary: Ohm's Law as an Analogy for Enzyme Kinetics, (2015), Biochem. Mol. Biol. Educ., 43(2), 139–141.
- Murphy K., Holme T., Zenisky A., Caruthers H. and Knaus K., (2012), Building the ACS Exams Anchoring Concept Content Map for Undergraduate Chemistry, J. Chem. Educ., 89(6), 715–720.
- National Research Council, (2012), A Framework for K-12 Science Education: Practices, Crosscutting Concepts, and Core Ideas, Washington, DC: National Academies Press.
- National Research Council, (2014), Developing Assessments for the Next Generation Science Standards, in J. W. Pellegrino, M. R. Wilson, J. A. Koenig and A. S. Beatty (ed.), Washington, DC: The National Academies Press.
- Ochs R. S., (2000), Understanding Enzyme Inhibition, J. Chem. Educ., 77(11), 1453–1456.
- Orgill M. and Bodner G., (2004), What Research Tells Us About Using Analogies to Teach Chemistry, Chem. Educ. Res. Pract., 5(1), 15–32.
- Orgill M. and Bodner G., (2006), An Analysis of the Effectiveness of Analogy Use in College-level Biochemistry Textbooks, J. Res. Sci. Teach., 43(10), 1040–1060.
- Orgill M. and Bodner G., (2007), Locks and Keys: An Analysis of Biochemistry Students’ Use of Analogies, Biochem. Mol. Biol., 35(4), 244–254.
- Orgill M., Bussey T. and Bodner G., (2015), Biochemistry Instructors’ Perceptions of Analogies and Their Classroom Use, Chem. Educ. Res. Pract., 16, 731–746.
- Osborne J., (2014), Teaching Scientific Practices: Meeting the Challenge of Change, J. Sci. Teach. Educ., 25, 177–196.
- Page J. M., (2014), Childcare choices and voices: using interpreted narratives and thematic meaning-making to analyse mothers’ life histories, Int. J. Qual. Stud. Educ., 27(7), 850–876.
- Popova M. and Bretz S. L., (2018a), Organic chemistry students’ challenges with coherence formation between reactions and reaction coordinate diagrams, Chem. Educ. Res. Pract., 19, 732–745.
- Popova M. and Bretz S. L., (2018b), “It's Only the Major Product That We Care About in Organic Chemistry”: An Analysis of Students’ Annotations of Reaction Coordinate Diagrams”, J. Chem. Educ., 95, 1086–1093.
- Popova M. and Bretz S. L., (2018c), Organic chemistry students’ interpretations of the surface of reaction coordinate diagrams, Chem. Educ. Res. Pract., 19, 919–931.
- Potratz J., (2018), Making Enzyme Kinetics Dynamic via Simulation Software, J. Chem. Educ., 95(3), 482–486.
- Quisenberry K. and Tellinghuisen J., (2006a), Textbook Deficiencies: Ambiguities in Chemical Kinetics Rates and Rate Constants, J. Chem. Educ., 83(3), 510–512.
- Quisenberry K. and Tellinghuisen J., (2006b), Textbook deficiencies: ambiguities in chemical kinetics rates and rate constants, J. Chem. Educ., 83(3), 510–512.
- Raker J., Holme T. and Murphy K., (2012), The ACS Exams Institute Undergraduate Chemistry Anchoring Concepts Content Map I: General Chemistry, J. Chem. Educ., 89(4), 721–723.
- Rodriguez J. G. and Towns M. H., (2018), Modifying Laboratory Experiments to Promote Engagement in Critical Thinking by Reframing Pre-Lab and Post-Lab Questions, J. Chem. Educ., 95(12), 2141–2147.
- Rodriguez J. G., Santos-Diaz S., Bain K. and Towns M. H., (2018), Using Symbolic and Graphical Forms to Analyze Students' Mathematical Reasoning in Chemical Kinetics, J. Chem. Educ., 95(12), 2114–2125.
- Rodriguez J. G., Bain K., Hux N. P. and Towns M. H., (2019a), Productive Features of Problem Solving in Chemical Kinetics: More Than Just Algorithmic Manipulation of Variables, Chem. Educ. Res. Pract., 20, 175–186.
- Rodriguez J. G., Bain K. and Towns M. H., (2019b), Graphs as Objects: Analysis of the Mathematical Resources Used by Undergraduate Biochemistry Students to Reason About Enzyme Kinetics, in Towns M. H., Bain K. and Rodriguez J. G. (ed.), It's Just Math: Research on Students' Understanding of Chemistry and Mathematics, Washington, D.C.: American Chemical Society, vol. 1316, in press.
- Rodriguez J. G., Bain K. and Towns M. H., (2019c), Graphical forms: the adaptation of Sherin's symbolic forms for the analysis of graphical reasoning across disciplines, manuscript in preparation.
- Rodriguez J. G., Bain K., Towns M. H., Elmgren M. and Ho F. M., (2019d), Covariational Reasoning and Mathematical Narratives: Investigating Students’ Understanding of Graphs in Chemical Kinetics, Chem. Educ. Res. Pract., 20, 107–119.
- Runge S. W., Hill B. J. F. and Moran W. M., (2006), A Simple Classroom Teaching Technique To Help Students Understand Michaelis–Menten Kinetics, CBE-Life Sci. Educ., 5, 348–352.
- Saunders B., Sim J., Kingstone T., Bakjer S., Waterfield J., Bartlam B., Burroughs H. and Jinks C., (2018), Saturation in qualitative research: exploring its conceptualization and operationalization, Quality and Quantity, 52(4), 1893–1907.
- Sayre E. C. and Wittmann M. C., (2008), Plasticity of mechanics students coordinate system choice, Phys. Rev. ST – Phys. Educ. Res., 4, 020105.
- Seethaler S., Czworkowski J. and Wynn L., (2018), Analyzing general chemistry texts’ treatment of rates of change concepts in reaction kinetics reveals missing conceptual links, J. Chem. Educ., 95(1), 28–36.
- Sherin B. L., (2001), How students understand physics equations, Cognit. Instruct., 19, 479–541.
- Silverstein T., (1995), Breaking Bonds Versus Chopping Heads: The Enzyme as Butcher, J. Chem. Educ., 72(7), 645–646.
- Silverstein T., (2011), The Nuts and Bolts of Michaelis–Menten Enzyme Kinetics: Suggestions and Clarifications, J. Chem. Educ., 88(2), 167–168.
- Stowe R. and Cooper M., (2017), Practicing What We Preach: Assessing “Critical Thinking” in Organic Chemistry, J. Chem. Educ., 94, 1852–1859.
- Strauss A. and Corbin J., (1990), Basics of Qualitative Research: Grounded Theory Procedures and Techniques, Newbury Park, CA: Sage Publications, Ltd.
- Tastan O. and Boz Y., (2010), Effect of cooperative learning on students’ understanding of reaction rate, paper presented at the International Organization for Science and Technology Education Conference, Bled, Slovenia.
- Tastan O., Yalcinkaya E. and Boz Y., (2010), Pre-service chemistry teachers’ ideas about reaction mechanism, J. Turk. Sci. Educ., 7, 47–60.
- Underwood S., Posey L., Herrington D., Carmel J. and Cooper M., (2018), Adapting Assessment Tasks To Support Three-Dimensional Learning, J. Chem. Educ., 95(2), 207–217.
- Voet D. and Voet J. G., (2011), Biochemistry, Hoboken, NJ: John Wiley & Sons, Inc.
- Waldrop G. L., (2009), A Qualitative Approach to Enzyme Inhibition, Biochem. Mol. Biol. Educ., 37(1), 11–15.
- Wittmann M. C., (2006), Using resource graphs to represent conceptual change, Phys. Rev. ST – Phys. Educ. Res., 2, 020105.
Footnote |
| † Electronic supplementary information (ESI) available. See DOI: 10.1039/c8rp00276b |
| This journal is © The Royal Society of Chemistry 2019 |

