 Open Access Article
Creative Commons Attribution 3.0 Unported Licence
Oxygen sensors for flow reactors – measuring dissolved oxygen in organic solvents
Philipp
Sulzer
 ac,
René
Lebl
bc,
C. Oliver
Kappe
 bc and
Torsten
Mayr
 *ac
*ac
aInstitute of Analytical Chemistry and Food Chemistry, Graz University of Technology, 8010 Graz, Austria. E-mail: torsten.mayr@tugraz.at
bInstitute of Chemistry, University of Graz, 8010 Graz, Austria
cCenter for Continuous Flow Synthesis and Processing (CC FLOW), Research Center Pharmaceutical Engineering GmbH (RCPE), 8010 Graz, Austria
First published on 30th August 2019
Abstract
In an effort to push the boundaries of optical oxygen sensors, this contribution shows the development of a measurement system for high O2 content in organic solvents specifically designed for flow reactors. Presented sensors were prepared by directly melting an oxygen indicator dye into a highly resistant polymer matrix, leading to the ability to measure oxygen contents up to 59 mmol L−1 in tetrahydrofuran, toluene, acetone, dimethylformamide, cyclohexane and methyl tert-butyl ether. Long-term effects to the solvent were investigated by exposing the sensors for 22 hours to the respective solvent at 25 °C. Linearity according to Stern–Volmer was obtained for every single sensor in order to provide a system that can be easily initialized by two-point calibration into continuous flow reactors. To demonstrate the applicability of the sensor under reaction conditions, an oxidation of a Grignard reagent with molecular oxygen was performed in a flow reactor. The sensors were able to show the oxygen decrease during reaction and allowed online reactant quantification.
Introduction
Online oxygen monitoring can be a crucial factor for a wide range of technological applications. Information about O2 concentration is often necessary to control or investigate either aerobic or anaerobic processes1,2 in biochemistry and biology. Here, knowledge of the exact amount of dissolved O2 – or its absence respectively – is an important factor for process optimization. Chemical processes often utilize oxygen as an inexpensive and easily available oxidizing reactant,3–6 whereas other applications also require the absolute absence or low levels of O2, either for safety reasons or to inhibit the production of unwanted side products or both.7Online measurement systems for oxygen in chemical and biochemical reaction applications are usually based on optical and electrochemical sensors.8–11 The Clark electrode was invented in 1962 and has been the state-of-the-art oxygen measurement method for decades.12 The electrode consists of two main parts: a working electrode (usually Pt) and a reference electrode system consisting of an Ag/AgCl anode and electrolyte solution. This system is usually protected by a perfluorinated polymer layer. Whereas this approach is relatively stable and robust, electrode design is significantly more complex and less suitable for miniaturization than their optical counterpart. Since about 1990, optical sensors have increasingly become a viable alternative to the Clark electrode.13 These sensors use dyes, that have an oxygen dependent luminescence. Since phosphorescence of used molecules undergo a triplet electronic state, the process is influenced by nearby oxygen, which is also in the triplet state. With higher oxygen amount around the sensor molecule, its emission is increasingly quenched. By measuring the emission lifetime or intensity of such a sensor dye, the oxygen partial pressure in its immediate environment can be calculated. Modern phase fluorimetry devices for oxygen measurements can be as small as thumb drives. Luminescence based sensors lack any direct electrical connection to the observed system, but use oxygen sensitive characteristics regarding light intensity or luminescence lifetime. This allows the transport of measurement information via optical waveguides – also through transparent system borders like glass walls and transparent tubing. The versatility of these optical systems allows 2-dimensional oxygen imaging and non- or minimal invasive oxygen monitoring. However, the use of oxygen permeable matrix materials14,15 and organic or metal–organic indicator dyes16 limit the application to non-aggressive environments – mostly aqueous or gaseous systems. Reported optical oxygen measurements in organic solvents were either carried out in less harsh media,16 were shown to work at low oxygen partial pressures below 250 hPa (ref. 17 and 18) or relied on complex periphery like HPLC equipment.16
The characteristics of luminescence sensor systems suggest the use of fiber optics.19,20 The preparation of an optical fiber sensor is relatively simple. The sensor dye has to be immobilized on the tip of a glass- or polymer fiber (mostly via polymer or silica matrix materials), which is then connected to a readout device. This approach has found application especially in various biological,21,22 medical23 and marine biological fields.24,25 The majority of phosphorescence based fiber oxygen sensors are designed to measure oxygen partial pressures in air or as dissolved oxygen in water, but usually at atmospheric conditions or for trace oxygen analysis.26–28 Most of these technologies are not applicable for measuring oxygen in pressurized flow reactors, especially in presence of organic solvents.
In this contribution we present an optical fiber sensor for measuring high amounts of dissolved oxygen in organic solvent by employing robust matrix and coating materials. The sensors were designed to be easily implemented into flow reactors. By using standard HPLC connections the sensors could be integrated via standard ¼′′ screw fittings.
The presented work was carried out specifically to demonstrate the use of the sensor within continuous flow chemistry systems at elevated pressures and high amounts of dissolved oxygen in organic solvents. To achieve this, calibrations up to 52 mmol L−1 O2 were carried out for each solvent at three different temperatures ranging from 0 °C to 37.5 °C. Further, the impact of solvent exposure for 22 hours was additionally examined.
Materials and methods
Materials
Methyl tert-butyl ether (MTBE), tetrahydrofuran (THF), toluene, acetone, dimethylformamide (DMF) and cyclohexane (CH) were purchased from commercial suppliers in HPLC grade 99.7% and above. PPS (polyphenylene sulphide) (Mn ~ 10![[thin space (1/6-em)]](https://www.rsc.org/images/entities/char_2009.gif) 000) and polystyrene (PS; Mn ~ 260
000) and polystyrene (PS; Mn ~ 260![[thin space (1/6-em)]](https://www.rsc.org/images/entities/char_2009.gif) 000) were purchased from Sigma-Aldrich, Inc. The indicator dye PtTPTBPF (Pt-meso-tetra(4-fluorophenyl)tetrabenzoporphyrin) was synthesized in-house.29 The optical fibers used (WFGe400/440/530/750T) were purchased from Ceramoptec GmbH. The fluoropolymer solution CYTOP CTL-107MK was purchased from AGC Chemicals Americas, Inc. Phosphorescence lifetime measurements30 were carried out via a 4-channel FireStingO2 phase fluorimeter from PyroScience. A Syrris Asia Syringe Pump (5 mL and 2.5 mL syringes) and a Bronkhorst EL-FLOW select mass flow controller (MFC) were used for flow control.
000) were purchased from Sigma-Aldrich, Inc. The indicator dye PtTPTBPF (Pt-meso-tetra(4-fluorophenyl)tetrabenzoporphyrin) was synthesized in-house.29 The optical fibers used (WFGe400/440/530/750T) were purchased from Ceramoptec GmbH. The fluoropolymer solution CYTOP CTL-107MK was purchased from AGC Chemicals Americas, Inc. Phosphorescence lifetime measurements30 were carried out via a 4-channel FireStingO2 phase fluorimeter from PyroScience. A Syrris Asia Syringe Pump (5 mL and 2.5 mL syringes) and a Bronkhorst EL-FLOW select mass flow controller (MFC) were used for flow control.
Preparation of the fiber sensors
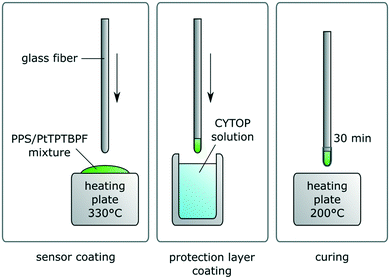
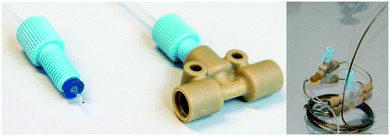
To ensure a homogenous distribution of dye and polymer powder, 21 mg of PPS were dispersed into a solution of 0.053 mg PtTPTBPF in 400 μL of THF. This leads to 0.25% dye concentration in polymer. Note that commonly Pt–benzoporphyrines are applied in concentrations of 1% and higher, in our case the concentration was reduced to decrease aggregation effects. The dispersion was applied onto a glass slide, spread via spatula and the solvent evaporated at room temperature. After putting the glass slide onto a heating surface at 330 °C for a minute, the fiber tip was coated with the molten sensor mixture by dipping. It was made sure the sensor showed at least 80 mV of signal intensity (at 10% LED intensity, 400× amplification and 4000 Hz modulation frequency for the phase fluorimetry measurement). To apply the protection layer coating the fiber was dipped into the CYTOP CTL-107 and then cured for 30 min (see Fig. 1). The coating of this fluorinated layer was repeated three times.By employing a piece of 1/16′′ PTFE tubing and a flangeless 1/4′′-28 UNF flat-bottom fitting, the sensor was ready to be introduced into a 3-way distribution piece (see Fig. 2). The PS sensor for material comparison was prepared by dipping the fiber tip into a solution of 2 mg mL−1 polystyrene and 0.02 mg mL−1 PtTPTBPF in THF.
Material comparison polystyrene vs. polyphenylenesulfide
Optical oxygen sensors consist of an indicator dye immobilized in a host matrix material, commonly a polymer or sol-gels.8 Herein, the dynamic range of the sensor is determined by the phosphorescence lifetime of the dye and the oxygen permeability of the host material. Most commonly used oxygen sensitive dyes are metal–organic complexes such as porphyrines, benzoporphyrines and phenanthrolines with Pt, Ir or Ru central atoms. Most of these dyes, as well as common matrix polymers, are well soluble in organic solvents. We chose to introduce the well investigated and available PtTPTBPF into a solvent resistant polymer, since it has high brightness and photostability, lifetime of around 50 μs and the NIR-emission is less affected by background noise. PtTPTBPF, like many oxygen indicator dyes, is well soluble in organic solvents. Therefore, the strategy was to introduce it into PPS by a melting procedure.The PPS and CYTOP coated sensor was evaluated alongside a regularly employed PS sensor regarding response dynamic and solvent stability. By mixing N2 and O2via mass flow controllers (200 mL min−1 gas flow), 9 different pO2 (oxygen partial pressure) were generated and phosphorescence lifetime (τ) was recorded to generate pO2/τ calibration curves for both materials and allow direct comparison regarding dynamic ranges.
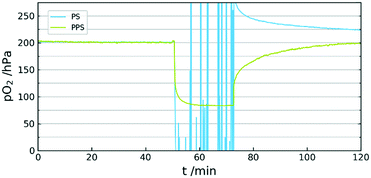
After these measurements, both sensors were put into the headspace of a vial half filled with acetone for 20 minutes and subsequently into ambient air again. By using the information obtained in the calibration experiment before, the measured pO2 of both sensors during solvent exposition was then recorded and compared. This experiment was carried out to demonstrate applicability advantages of our sensor regarding dynamic range at elevated amounts of oxygen and solvent stability over polystyrene sensors, that are state-of-the-art technology. Due to the high solubility of polystyrene in organic solvents, the sensors were not submerged. The PS sensor would dissolve immediately.
Measurement setup
500 mL of each solvent were degassed via ultra-sonication and bubbling with argon for at least one hour to remove dissolved oxygen. Subsequent handling of the solvent was only carried out under inert gas conditions.Distinct oxygen concentrations for calibration were achieved by introducing controlled amounts of O2 to a constant stream of deoxygenated solvent via Y-mixer. After mixing gas and solvent, a 1 mL 1/16′′ steel coil was introduced to allow complete gas dissolution. Between this mixing-coil and a back pressure regulator (∼8.0 bar), the sensor array was incorporated. For the sensor characterization in several solvents and at varying temperatures, 4 sensors in a row were introduced simultaneously to gain information on preparation and response reproducibility. The compartment consisting of mixing-coil and sensors was submerged in a temperature controlled vessel to ensure constant temperature throughout the measurements.
The oxygen concentration [O2] was set up by calculating the normalized volume flow of the mass flow controller (v2) via the ideal gas law and the solvent flow (v1): [O2] = pv1/RTv2. The MFC manufacturer states that the given gas flow is specified for normal conditions, which means that for this calculation p is 101![[thin space (1/6-em)]](https://www.rsc.org/images/entities/char_2009.gif) 325 Pa and T is 273.15 K.
325 Pa and T is 273.15 K.
Three oxygen concentrations were set (0–52 mmol L−1) for every solvent at 0 °C, 12.5 °C and 25 °C (for cyclohexane 37.5 °C instead of 0 °C was executed). After those measurements, the setup was not washed out until the next day, leaving the sensors submerged in solvent for 22 hours. After this time period, another measurement at 25 °C was carried out to gain information about the long term impact of solvent exposure.
The phosphorescence lifetime was recorded of each sensor in intervals of 6 seconds during the measurements. Every sensor was set up to 100% LED intensity, 400× amplification and 4000 Hz modulation frequency. Changing the MFC flow could take up to 20 minutes for the oxygen concentration to reach a steady state due to the elevated pressure within the system. Therefore, each calibration point was upheld long enough to ensure a stable constant signal – in each case about 30 minutes per concentration.
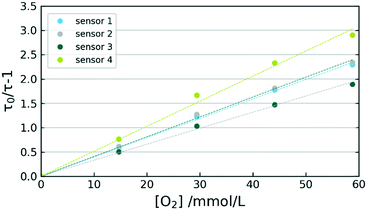
Average lifetime values τ were recorded for every calibration point. These were then used to compile a Stern–Volmer calibration:31τ0/τ − 1= [O2] × KSV, whereas τ0 represents the lifetime value of the sensor at an unquenched state ([O2] = 0) and KSV is the so called Stern–Volmer constant. This physical correlation between concentration and normalized phosphorescence lifetime describes a linear relationship.
Monitoring oxygen during oxidation of 4-methoxyphenylmagnesium bromide
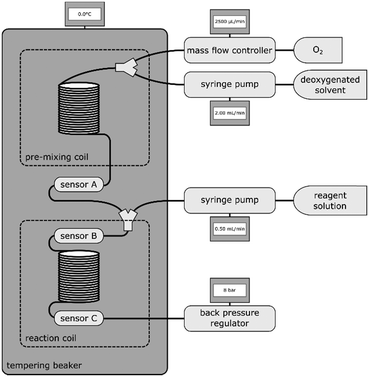
An oxygen consuming model reaction was performed to demonstrate the applicability of the sensor for inline measurements. The oxidation of 4-methoxyphenylmagnesium bromide32 to 4-methoxyphenol (using ½ eq. of O2) was utilized to maintain a reliable oxygen consumption throughout a flow reactor. Three oxygen sensors were placed at different locations within the system: a reference sensor before combining O2 and reactant stream, one sensor directly connected to the Y-mixer and another one after a 2.5 mL coil. The whole setup from pre-mixing coil to the last sensor was submerged in a temperature-controlled bath at 0 °C (see Fig. 3).THF was used as solvent. The two-point calibrations of the sensors were performed within the setup, directly before measurement. The first stream with dissolved oxygen was introduced at 2500 μL min−1 containing [O2] of 52 mmol L−1. The reactant stream contained 500 mmol L−1 Grignard reagent and was introduced at 500 μL min−1. This corresponds to 0.84 equivalents of O2 regarding the 4-methoxyphenylmagnesium bromide.
Results and discussion
Sensor material composition
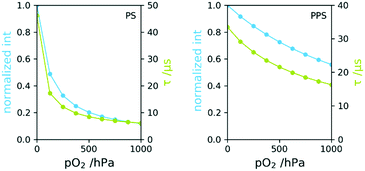
The use of poly(1,4-phenylene sulphide) (PPS), had several advantages regarding the desired requirements: its excellent solvent stability33 and the low oxygen permeability. PPS has widely increased dynamic range of the investigated oxygen sensor compared to Polystyrene, one of the most common matrix polymers.Polystyrene has an O2 permeability coefficient (165 cm3 mm per m2 per day per atm) roughly 15 times higher than PPS (11.8 cm3 mm per m2 per day per atm).34 This leads to a change in dynamic range regarding oxygen measurement. This is shown for both polymers in Fig. 4, where the phosphorescence lifetime and intensities are plotted vs. pO2, determined in gas phase. The measurements showed no difference in sensor response time between both materials. Changes in partial pressures underwent some delay due to the dead-volume between valves and measurement point. pO2 adjustments took about 20 s for each measurement point and both sensors responded observably equally fast, suggesting response times in the range of seconds. Thorough investigations regarding response times of dip-coated and melt-coated sensors will be presented in a future publication.
The PS based sensor lost more than half of the initial lifetime at 150 hPa and at atmospheric O2 pressure τ was 6 μs, indicating that the phosphorescence is almost completely quenched. The intensity loss from 0–1000 hPa is about 90%. This quenching is significantly too high for this amount of oxygen to achieve acceptable signal to noise ratio. In contrast, lifetime at 1000 hPa of the PPS based sensor was around 17 μs and intensity was still at about 60% of the initial value. This enables measurements far above this range. The lowest signal to noise ratio was 600 for PS and 3000 for PPS based sensors. The measured phosphorescence lifetimes are highly stable and noise is not considered a limitation for this application.
Whereas polystyrene is known as a suitable matrix for the sensor dye with no tendency to dye aggregation (usually around 50 μs (ref. 35)), the decreased phosphorescence lifetime of PtTPTBPF in PPS at 0 hPa is most likely originating in this exact effect. Aggregation however did not affect the applicability of the sensor.
A further aspect of using PPS is the high stability. The high performance thermoplastic has sufficient mechanical stability up to 200 °C. It is often used in areas with high chemical stress due to the insolubility in most solvents and the resistance against acids and bases. An important property for its use as a sensor matrix is the minimal swelling in organic solvents.33 This allows the immersion of the sensor in otherwise harsh liquids. A comparison of sensor behaviour between PS and PPS was also conducted. The experiment showed complete inability of a PS sensor to generate viable signal in acetone vapour, whereas the PPS sensor was not affected by the organic solvent (see Fig. 5).
Reproducibility of sensor preparation
A set of 4 sensors was prepared and exposed to several oxygen concentrations in THF at 0 °C. Differences in individually prepared sensors are illustrated in Fig. 6, where an evaluation of THF calibration at 0 °C is presented. The variations between sensor response towards oxygen are most likely originating in differences of sensor composition. The poor reproducibility of sensor immobilization at 330 °C apparently leads to varying degrees of dye aggregation. Despite the sensor behaviour differing in τ0 as well as in KSV, a satisfactory linearity is given for all 4 sensors with R2 values above 0.9970. Used in flow-reactors, the sensors can always be initialized via two-point calibrations.Response towards oxygen inside micro flow reactor
The fiber sensor was placed in a flow reactor and the exposed to oxygen concentrations of 58.8, 44.1, 29.4, 14.7 and 0.0 mmol L−1 (continuously carried out with 1 mL min−1 liquid flow rate). Although the flow rate was kept consistent throughout the experiments, changing it does not affect the measurement capability of the sensor. A typical response curve is given in Fig. 7. Whereas the deoxygenated solvent leads to a distinct constant signal, the oxygen concentration points show very significant fluctuations. Closer inspection of these fluctuations reveal a steady periodicity between peaks. The larger swings appear every 5 minutes, whereas the signal has recurring smaller oscillations in between.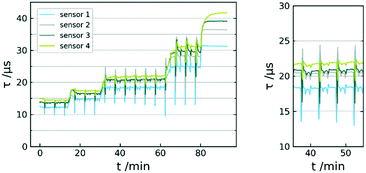 | ||
| Fig. 7 Sensor response curve τ vs. t of 5 calibration points; MTBE at 0 °C; 58.8/44.1/29.4; 14.7, 0.0 mmol L−1 O2 (left); data used for mean-value calculation (right). | ||
These fluctuations can be traced back to the pump system of the reactor. The Syrris Asia pump used works with two syringes with volumes of 5 mL and 2.5 mL. The pumping mechanism makes recurring use of valve switching necessary. At a flow rate of 1 mL min−1, the valve switches every 2.5 min. This slightly affects the pressure within the system, which further has influence on the oxygen distributed by the mass flow controller. Ultimately, this means the use of a continuous two-syringe pump system leads to significant fluctuations in dissolved oxygen throughout the process. However, the averaged values can still be used for oxygen concentration quantification. We were not able to determine sensor response times due to the residence time within the reactor and the inertia of the gas distribution by the mass flow controller. The recorded fluctuations however strongly suggest t90 (time to reach 90% of signal change) in the range of seconds. Preliminary, experiments with dichloromethane revealed a rapid penetration of the matrix. For this reason, the sensor was only investigated towards non-halogenated solvents.
O2 measurements in various organic solvents
The sensor was exposed to increasing amounts of dissolved oxygen in various organic solvents. Since the measurement system was employing a mass flow controller for gas introduction, we were able to determine the actual dissolved oxygen concentration rather than the partial pressure. The data in Fig. 8 shows calibration curves for all solvents according to Stern–Volmer. Note that many reported oxygen sensors use the significantly more complex Stern–Volmer two-site model.36 The dynamic in our sensors however allowed the applicability of a linear regression within the observed measurement range.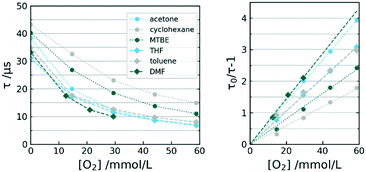 | ||
| Fig. 8 Calibration curves τ (left) and Stern–Volmer plot (right) of selected sensors in varying solvents at 12.5 °C. | ||
The associated data to the illustrated calibrations is given in Table 1. Subsequent evaluation and inspection of r2 proves the ability of each sensor to perform satisfactory in each solvent. The observed linearity allows two-point calibration for the sensor in all investigated solvents.
| Acetone | CH | MTBE | THF | Toluene | DMF | |
|---|---|---|---|---|---|---|
| τ 0/μs | 39.32 | 44.32 | 41.22 | 32.06 | 35.88 | 34.23 |
| K SV/l mmol−1 | 0.066 | 0.029 | 0.040 | 0.052 | 0.052 | 0.071 |
| r 2 | 0.999 | 0.997 | 0.998 | 1.000 | 0.997 | 0.999 |
Effect of long-term solvent exposure on sensor behaviour
The influence on the sensor of significantly increased periods submerged in solvent was investigated. After 22 hours of directly exposing the sensor to the solvent at room temperature, the two highest calibration points and the deoxygenated value τ0 were measured. The deviation between the actual and the observed [O2] was calculated (see Table 2).| [O2]/mmol l−1 | Acetone | CH | MTBE | THF | Toluene | DMF |
|---|---|---|---|---|---|---|
| Set | Measured [O2] in mmol l−1 (deviation) | |||||
| 58.8 | 88.0 | 51.8 | 60.2 | 77.6 | 46.5 | |
| (+50%) | (−12%) | (+2%) | (+32%) | (−21%) | ||
| 44.1 | 73.8 | 34.0 | 45.3 | 58.8 | 37.4 | |
| (+67%) | (−23%) | (+3%) | (+33%) | (−15%) | ||
| 29.4 | 26.1 | |||||
| (−11%) | ||||||
| 21 | 19.4 | |||||
| (−8%) | ||||||
| 0 | 2.2 | 1.0 | 1.6 | 6.7 | 0.9 | 0.8 |
The deviations in measured oxygen concentration were relatively low for [O2] = 0 with the exception of THF. Increased changes were observed for acetone, cyclohexane, THF and toluene. MTBE and DMF both only had minor impact on the long term stability of the sensors.
Using the sensor with a suggested precision of 3.5 mmol L−1, no recalibration is necessary for DMF and MTBE after 22 hours. THF would require a new two-point calibration, whereas the other solvents did affect the sensor only in the upper region, where a single-point recalibration would be adequate. We did not observe the necessity for recalibration within a short-time exposure of 2 hours.
O2 consumption measurement within a flow-reactor
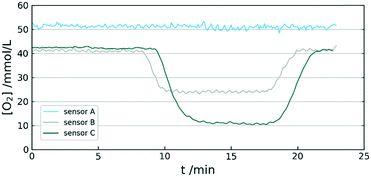
The recorded data in Fig. 9 shows the monitoring of [O2] throughout the oxidation of 4-methoxyphenylmagnesium bromide. The first 8 minutes record a steady state and display a stable supply of oxygen into the reactor without any reactant added. The difference in oxygen concentration between sensor A and the other two is due to the dilution in the mixer, since the second stream of THF does not contain dissolved oxygen. After 8 minutes the Grignard reagent is introduced into the stream and a drop of [O2] at sensor B can be observed. This drop steadies at about 24 mmol L−1 throughout the whole time reagent is available. The reaction reaches sensor C and leads to a significantly lower [O2] with a delay of 1 minute (due to the reaction coil between measurement points). After about 8 minutes of reaction time and no reactant left, the initial oxygen concentrations are measured again as an indicator for any possible changes in sensor behaviour during the experiment. GC-MS analysis showed 40% of product formation. The reactant was introduced with 150 mmol L−1, which leads to product stream of 60 mmol L−1. This is in accordance with 30 mmol L−1 of consumed oxygen (due to equivalence of ½).A further application of the sensor in a more complex setup (3D-printed CSTR-cascade micro-reactor) is presented in a previously published communication.37
Conclusion
This investigation shows the suitability for the presented sensors to be used for dissolved-oxygen measurements in organic solvents. The dynamic range significantly exceeds the solubility of oxygen in observed solvents at normal pressure, allowing O2-monitoring in pressurized systems. The sensors were analysed at system pressures around 8 bar and can generally be used up to 59 mmol l−1 with a precision of 3.5 mmol L−1.The sensor format was specifically designed for monitoring dissolved oxygen in flow-reactors. The linearity according to Stern–Volmer allows time-saving two-point calibration for each investigated solvent.
Stability tests with the sensors submerged in solvent overnight partly showed influence on the sensor. THF affects both high and low oxygen regions, making a two-point calibration necessary. Cyclohexane, acetone and toluene only showed significant differences in response at higher [O2], leaving the possibility of single-point recalibration. After submerging the sensors in DMF and MTBE for 22 hours, no drastic change in sensor calibration could be observed.
Overall we suggest the use of the sensor for continuous measurements up to 2 hours without recalibration in all investigated solvents.
To demonstrate practical applicability for the presented sensors, a model reaction was used, where a Grignard reagent was oxidized by molecular oxygen. Measurements were taken at different points in the reactor to gain a rough overview of remaining oxygen at respective points within the system. Employing these sensors in a reaction system can help with online parameter adjustment, conversion quantification, endpoint detection and reaction rate investigation.
Conflicts of interest
There are no conflicts to declare.Acknowledgements
This research was financed by the Austrian Research Promotion Agency (FFG), in the framework COMET program project “Center for Continuous Flow Synthesis & Processing”, CCFLOW (project nr. 862766). The financial support is greatly acknowledged.Notes and references
- S. Suresh, V. C. Srivastava and I. M. Mishra, J. Chem. Technol. Biotechnol., 2009, 84, 1091–1103 CrossRef CAS.
- J. F. Dat, N. Capelli, H. Folzer, P. Bourgeade and P.-M. Badot, Plant Physiol. Biochem., 2004, 42, 273–282 CrossRef CAS PubMed.
- Y. Ishii, S. Sakaguchi and T. Iwahama, Adv. Synth. Catal., 2001, 343, 393–427 CrossRef CAS.
- T. Mallat and A. Baiker, Chem. Rev., 2004, 104, 3037–3058 CrossRef CAS PubMed.
- T. Punniyamurthy, S. Velusamy and J. Iqbal, Chem. Rev., 2005, 105, 2329–2364 CrossRef CAS PubMed.
- C. A. Hone, D. M. Roberge and C. O. Kappe, ChemSusChem, 2017, 10, 32–41 CrossRef CAS PubMed.
- D. A. Bulushev and J. R. H. Ross, Catal. Today, 2011, 171, 1–13 CrossRef CAS.
- X. Wang and O. S. Wolfbeis, Chem. Soc. Rev., 2014, 43, 3666–3761 RSC.
- A. Mills, Platinum Met. Rev., 1997, 41, 115–127 CAS.
- A. M. Azad, S. A. Akbar, S. G. Mhaisalkar, L. D. Birkefeld and K. S. Goto, J. Electrochem. Soc., 1992, 139, 3690–3704 CrossRef CAS.
- R. Ramamoorthy, P. K. Dutta and S. A. Akbar, J. Mater. Sci., 2003, 38, 4271–4282 CrossRef CAS.
- L. A. M. Pouvreau, M. J. F. Strampraad, S. V. Berloo, J. H. Kattenberg and S. de Vries, in Methods in Enzymology, ed. R. K. Poole, Academic Press, 2008, vol. 436, pp. 97–112 Search PubMed.
- O. S. Wolfbeis, BioEssays, 2015, 37, 921–928 CrossRef CAS PubMed.
- A. Mills, Sens. Actuators, B, 1998, 51, 60–68 CrossRef CAS.
- Y. Amao, Microchim. Acta, 2003, 143, 1–12 CrossRef CAS.
- M. Quaranta, S. M. Borisov and I. Klimant, Bioanal. Rev., 2012, 4, 115–157 CrossRef PubMed.
- H. Ramesh, T. Mayr, M. Hobisch, S. Borisov, I. Klimant, U. Krühne and J. M. Woodley, J. Chem. Technol. Biotechnol., 2016, 91, 832–836 CrossRef CAS PubMed.
- N. Velasco-García, M. J. Valencia-González and M. E. Díaz-García, Analyst, 1997, 122, 1405–1410 RSC.
- I. Klimant, V. Meyer and M. Kühl, Limnol. Oceanogr., 1995, 40, 1159–1165 CrossRef CAS.
- O. S. Wolfbeis, Anal. Chem., 2008, 80, 4269–4283 CrossRef CAS PubMed.
- C. Preininger, I. Klimant and O. S. Wolfbeis, Anal. Chem., 1994, 66, 1841–1846 CrossRef CAS.
- E. J. Park, K. R. Reid, W. Tang, R. T. Kennedy and R. Kopelman, J. Mater. Chem., 2005, 15, 2913–2919 RSC.
- J. I. Peterson, R. V. Fitzgerald and D. K. Buckhold, Anal. Chem., 1984, 56, 62–67 CrossRef CAS PubMed.
- H. Hasumoto, T. Imazu, T. Miura and K. Kogure, J. Oceanogr., 2006, 62, 99–103 CrossRef CAS.
- S. Gatti, T. Brey, W. Müller, O. Heilmayer and G. Holst, Mar. Biol., 2002, 140, 1075–1085 CrossRef.
- C. Baleizão, S. Nagl, M. Schäferling, M. N. Berberan-Santos and O. S. Wolfbeis, Anal. Chem., 2008, 80, 6449–6457 CrossRef PubMed.
- S. Nagl, C. Baleizão, S. M. Borisov, M. Schäferling, M. N. Berberan-Santos and O. S. Wolfbeis, Angew. Chem., Int. Ed., 2007, 46, 2317–2319 CrossRef CAS PubMed.
- S. M. Borisov, P. Lehner and I. Klimant, Anal. Chim. Acta, 2011, 690, 108–115 CrossRef CAS PubMed.
- S. M. Borisov, G. Nuss, W. Haas, R. Saf, M. Schmuck and I. Klimant, J. Photochem. Photobiol., A, 2009, 201, 128–135 CrossRef CAS.
- E. A. Bailey and G. K. Rollefson, J. Chem. Phys., 1953, 21, 1315–1322 CrossRef CAS.
- M. E. Lippitsch, J. Pusterhofer, M. J. P. Leiner and O. S. Wolfbeis, Anal. Chim. Acta, 1988, 205, 1–6 CrossRef CAS.
- Z. He and T. F. Jamison, Angew. Chem., Int. Ed., 2014, 53, 3353–3357 CrossRef CAS PubMed.
- H. W. Hill and D. G. Brady, Polym. Eng. Sci., 1976, 16, 831–835 CrossRef CAS.
- L. K. Massey, Permeability Properties of Plastics and Elastomers, A Guide to Packaging and Barrier Materials, Cambridge University Press, 2nd edn, 2003 Search PubMed.
- K. Koren, L. Hutter, B. Enko, A. Pein, S. M. Borisov and I. Klimant, Sens. Actuators, B, 2013, 176, 344–350 CrossRef CAS PubMed.
- E. R. Carraway, J. N. Demas, B. A. DeGraff and J. R. Bacon, Anal. Chem., 1991, 63, 337–342 CrossRef CAS.
- M. C. Maier, R. Lebl, P. Sulzer, J. Lechner, T. Mayr, M. Zadravec, E. Slama, S. Pfanner, C. Schmölzer, P. Pöchlauer, C. Oliver Kappe and H. Gruber-Woelfler, React. Chem. Eng., 2019, 4, 393–401 RSC.
| This journal is © The Royal Society of Chemistry 2019 |

