 Open Access Article
Continuous generation, in-line quantification and utilization of nitrosyl chloride in photonitrosation reactions†
René
Lebl
ab,
David
Cantillo
*ab and
C. Oliver
Kappe
 *ab
*ab
aCenter for Continuous Flow Synthesis and Processing (CCFLOW), Research Center Pharmaceutical Engineering GmbH (RCPE), Inffeldgasse 13, 8010 Graz, Austria
bInstitute of Chemistry, University of Graz, Heinrichstrasse 28, 8010 Graz, Austria. E-mail: david.cantillo@uni-graz.at; oliver.kappe@uni-graz.at
First published on 29th January 2019
Abstract
Herein, we describe a continuous flow protocol for the generation, purification and quantification of nitrosyl chloride (NOCl). The generation of this useful but hazardous reagent is based on the reaction of aqueous NaNO2 with HCl as readily available starting materials. The reagent, which is formed immediately upon mixing of the reactants, is rapidly extracted into a suitable organic phase, such as CHCl3 or CH2Cl2, and separated using a continuous flow liquid–liquid membrane separator. A convenient method for the in-line monitoring of reagent concentration, based on flow UV/vis analysis, has also been developed and implemented. The synthetic utility of the nitrosyl chloride generator was demonstrated by integrating a continuous flow photochemical reactor downstream to perform the synthesis of cyclohexanone oxime from cyclohexane, an important industrial process.
Introduction
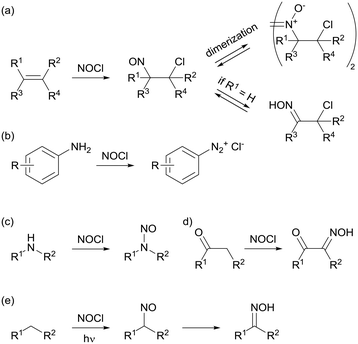
Nitrosyl chloride (NOCl) is a classic reagent utilized for organic synthesis mostly during the last century.1 This orange colored gas, with a boiling point of −5.8 °C, was initially identified as a constituent of aqua regia and isolated and characterized almost 150 years ago.2 In early studies, it was utilized for the structural elucidation of terpenes and other olefin-containing compounds because its addition to double bonds often yields crystalline products.3 The nitrosochlorination of alkenes (Scheme 1a) results in 1-chloro-2-nitroso compounds which, depending on the substituents on the olefin moiety, can either dimerize or rearrange to an α-chloro oxime.4 Many other applications of this versatile reagent have been reported, including the generation of aromatic diazonium salts from anilines (Scheme 1b),5N-nitrosation of secondary amines, (Scheme 1c),6 or α-oximation of carbonyl compounds (Scheme 1d).7 These oximations are generally considered to proceed via a nitroso intermediate.7d,e Light-induced oximation of aliphatic CH2 groups (Scheme 1e) is arguably the most important and most widely applied reaction involving NOCl. The oximation is postulated to proceed via a radical mechanism initiated by the homolytic cleavage of the Cl–NO bond upon photo-irradiation. This chemistry, pioneered by Lynn and co-workers,8 is applied on the industrial scale for the photonitrosation of cyclohexane (PNC) by Toray Industries.9,10Despite its broad applicability, the direct use of nitrosyl chloride in organic synthesis is generally undesired and usually avoided, even on a lab scale. This is due to its reactive nature as a toxic and highly corrosive gas. NOCl has corrosiveness comparable to aqua regia, and hence is incompatible with most metals and only a few nickel based alloys (such as Monel or Inconel) can be used for its storage. Commercial availability is therefore very limited and in situ generation from stable starting materials is the preferred method of supply. In this context, several methods for NOCl generation have been reported, such as the reaction between alkali metal chlorides and nitrogen dioxide or nitric acid.11 Gas phase formation of NOCl occurs when nitrous gases (NO and NO2) are reacted with elemental chlorine (Cl2) or hydrogen chloride.12 In the aforementioned PNC process, NOCl is generated from HCl and nitrosylsulfuric acid (NOHSO4), which itself is produced by the reaction of sulfuric acid with nitrous gases.9c,10,13
A common approach for the lab-scale generation of NOCl is based on the reaction of alkyl nitrites (RONO) with hydrochloric acid or trialkyl chlorosilanes.4f,14 Ethyl-, butyl- and pentyl nitrites, which are the most commonly used reagents for this reaction, are mainly prepared by the reaction of sodium nitrite and sulfuric acid with the corresponding alcohol.15 NOCl can also, however, be directly generated from aqueous solutions of NaNO2 and HCl,16 circumventing the preparation of alkyl nitrites and providing a more atom-efficient procedure.
With this in mind, we envisaged that a continuous flow protocol for the in situ generation, purification, and utilization of NOCl based on the reaction of NaNO2 and HCl as inexpensive and readily available starting materials would be highly desirable. Continuous flow technology enables the generation and utilization of hazardous reagents or reaction intermediates in a confined environment, minimizing any risks of exposure.17 As these intermediates are generated and immediately consumed, the amount of hazardous material present in the reactor at any given time is minimized.18 In addition, the continuous generation of reagents can be readily combined with purification steps and in-line quantification by integrating process analytical technology (PAT).19
Herein, we present the development of a continuous flow nitrosyl chloride generator and its application to the photochemical synthesis of cyclohexanone oxime from cyclohexane. The continuous flow setup integrates: the generation of the gaseous reagent utilizing aqueous NaNO2 and HCl as stable and inexpensive starting materials; extraction into a suitable organic solvent stream; in-line continuous liquid–liquid separation of the aqueous and organic phases using membrane technology and in-line reagent quantification by UV/vis monitoring. Further integration of the NOCl generator with a photochemical reactor has enabled the generation of cyclohexanone oxime from cyclohexane, whilst bypassing any handling of the hazardous reagent.
Results and discussion
Continuous flow setup for the generation of NOCl
The continuous flow setup consisted of three feeds: two aqueous solutions, containing 8 M NaNO2 and 6 M HCl, and an organic solvent extraction stream (Fig. 1). These high concentrations, which are near saturation in the case of NaNO2, were selected to enhance NOCl formation. Higher concentrations of NaNO2 were not evaluated (saturation at room temperature corresponds to 8.8 M) to prevent any eventual solid formation. Indeed, contact of the 8 M aqueous solution with immiscible organic solvents typically resulted in crystallization of the salt. HCl concentrations higher than 6 M were not used for safety reasons. NOCl formation was observed to be essentially instantaneous using these conditions and no change was observed upon altering the residence time. The organic stream was, therefore, added almost immediately after mixing the aqueous reagent streams in a 250 μL Dolomite glass microreactor. In this reactor, the initial mixing takes place within channels of ca. 0.2 mm i.d., promoting fast mixing. Injection of the third stream, the organic solvent (methyl tert-butyl ether, diisopropyl ether, trifluorotoluene, chloroform, toluene or dichloromethane), takes place after a very short channel path (ca. 0.2 mm). Thus, the estimated contact time between the aqueous phases prior to addition of the organic solvent is in the order of milliseconds. Extraction of NOCl to the organic phase occurs within the microreactor mixing zone and residence time channel (250 μL). All streams were introduced into the system using syringe pumps (Syrris). A transparent PFA tube at the output of the microreactor allowed for visual inspection of the resulting biphasic segmented stream. Notably, accumulation of NOCl in the organic phase could be observed by its strong orange coloration, in contrast to the almost colorless appearance of the water segments.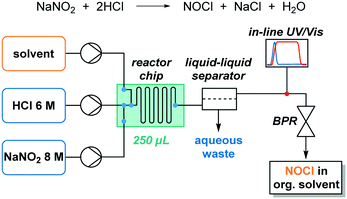 | ||
| Fig. 1 Schematic view of the continuous flow setup for NOCl generation, extraction, and in-line quantification. | ||
The solution containing NOCl was separated from the aqueous phase immediately after the mixture exited the microreactor in order to minimize hydrolysis of NOCl. For that purpose, a continuous liquid–liquid membrane separator (Zaiput), equipped with a hydrophobic PTFE membrane (0.5 μm pore size), was used.20 An adjustable back pressure regulator (Zaiput) was installed at the end of the setup, to minimize the formation of gas bubbles. Additionally, in-line UV/vis monitoring was added to the setup to directly quantify the NOCl content of the organic stream circumventing the need for any handling or workup (Fig. 1).
Development of in-line UV/vis NOCl analysis
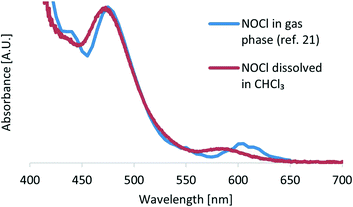
To obtain a reference spectrum of NOCl, the compound was generated in an organic solution by reacting isoamyl nitrite (C5H11ONO) with chlorotrimethylsilane (TMSCl) (see the ESI† for details).4f For the initial set of experiments, chloroform was selected as the organic solvent since it is completely unreactive toward NOCl, in contrast to other commonly used solvents.11b Additionally, chloroform is reported as the most suitable solvent for some NOCl reactions such as addition to olefins.4b Upon adding an excess of chlorotrimethylsilane to a solution of isoamyl nitrite in chloroform (performed in a UV/vis cuvette at ambient temperature), dark orange coloration could instantly be observed. The UV/vis spectra obtained using this method were compared with those recorded in the gas phase by Roehl and co-workers from the reaction between NO and Cl2 (ref. 21) and as expected, analogous absorption peaks were observed (Fig. 2).Two local absorption maxima with different intensities were present at λ 472 nm and λ 583 nm (in addition to an intense peak at 340 nm). We decided to use the absorbance at λ 583 nm for NOCl quantification. This is a characteristic absorption peak of NOCl and the possibility of side products or other compounds absorbing at this wavelength is lower than that for λ 472 nm. In addition, the absorption coefficient is relatively low; therefore saturation of the detector, even at high concentrations, is unlikely (see Fig. S2 ESI†).
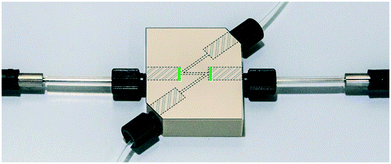
In-line UV/vis monitoring of the reaction stream was implemented by combining a custom-made flow cell (Fig. 3) with an optical fiber based UV/vis spectrometer (Avantes). This setup enabled flexible integration into the continuous flow setup. Despite a number of different available flow cells for continuous UV/vis spectroscopy,22 we decided to utilize our own design using PEEK as a chemically resistant material and ensuring facile connectivity using 1/4-28 threads for both fluid connectors and optical probe attachment. To avoid any undesired “dead ends” in the channel that could provoke concentration gradients or accumulation of small gas bubbles (a frequent cause for non-robust measurements in commercial flow cells), the fluidic channel was arranged in a Z-shape (Fig. 3). The cell channel featured an inner diameter of 800 μm and a total length of 35 mm, including a 10 mm optical path. The internal volume was approximately 18 μL. An important consideration during the implementation of the flow cell was to avoid contact of the fiber optic (mounted on stainless steel) with the NOCl-containing solution. To overcome this problem, transparent disks made of fluorinated ethylene propylene (FEP) (0.05 mm thickness) were installed between the optical fibers and the reaction channel (green lines in Fig. 3). This gastight and inexpensive material ensured a wide chemical compatibility alongside a high degree of transparency for wavelengths as short as 250 nm (see Fig. S3 ESI†). Indeed, the light transmittance of the flow cell with the FEP protective films was equivalent to a quartz cuvette with the same path length (see Fig. S5 in the ESI†). One disk was installed in each optical fiber connection.
Using this setup, pressures up to 10 bar were tested and no leakage or damage of the 0.05 mm FEP disks could be visually observed.
Optimization of NOCl generation in flow
Using the continuous flow setup (shown in Fig. 1) with the aid of in-line UV/vis monitoring, a series of reaction parameters were optimized for the generation of NOCl. Specifically, different reagent stoichiometries and concentrations, organic solvents, and relative flow rates of the organic and aqueous phases were examined.The stoichiometry of HCl was evaluated first. Although the reaction only requires 2 equivalents of the acid, previous reports suggested that an excess can be beneficial.16 Maintaining a constant flow rate for CHCl3 (400 μL min−1) and NaNO2 solution (50 μL min−1; 8 M), the flow rate of HCl (6 M) was gradually increased to 12 equivalents. UV/vis in-line monitoring (see Fig. S6 in the ESI†) revealed that a plateau for the NOCl concentration is reached using 6 equivalents of HCl (corresponding to a flow rate of 6 M HCl of 400 μL min−1). A larger excess did not have a significant influence and therefore this amount (6 equivalents) was chosen for subsequent experiments. Notably, experiments using less than 4 equivalents of HCl resulted in large amounts of gas slugs visible inside the flow system (most likely nitrogen oxides). Despite using a back pressure regulator set to 2 bar, they were large enough to cause disturbances during the UV/vis measurements. Under optimal conditions, no gas slugs were observed inside the organic phase, due to the good solubility of NOCl in the organic solvent.
Next, we turned our attention to the ratio between the aqueous and organic phases. Our aim was not only to find an optimal ratio for the extraction of NOCl to the organic phase, but also to assess the effect of the total flow rate on the reaction efficiency (by mixing contributions). Thus, both flow rates were sequentially modified in intervals of 100 μL min−1 (300 μL min−1 to 600 μL min−1 and 350 μL min−1 to 650 μL min−1 for the organic and aqueous phases, respectively) resulting in a set of 16 different flow rate combinations. After each modification of the flow rate, UV/vis data were collected for 15 min to ensure steady-state conditions (Fig. S7 in the ESI† contains the raw data obtained). Data suitable for visualization and comparison were obtained by converting the absorbance values to the relative NOCl yield, taking into account the dilution factor corresponding to the flow rates (Fig. 4). Details on the data treatment are collected in the ESI.† The best results were typically obtained when similar flow rates for the aqueous and organic phases were applied. Thus, the lowest values for the NOCl generation corresponded to the reaction in which the CHCl3 and aqueous streams were set to 600 μL min−1 and 350 μL min−1, and 300 μL min−1 and 650 μL min−1 (Fig. 4). These effects were ascribed to a low yield for the extraction process in the case of lower organic phase flow rates, or poor mixing efficiency when low flow rates of the aqueous phase were used.
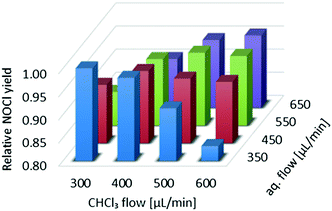 | ||
| Fig. 4 Optimization of the flow rates of aqueous and organic phases for the generation of NOCl. Data are adjusted with a dilution factor to obtain comparable efficiency values. | ||
To visualize the variation of the relative yield of NOCl against the flow rates of both streams, the data in Fig. 4 are fitted to a 3rd order polynomial function z(x,y) (z – relative NOCl yield, x – flow rate of the CHCl3 phase, and y – flow rate of the aqueous phase) by non-linear regression (relative coefficient R2 = 0.992, equation data are collected in the ESI†). A contour map of z(x,y) is plotted as shown in Fig. 5 with arrows indicating the direction of the gradient vector (∇z(x,y)) at each point on the (x,y) plane. In Fig. 5, the direction of the gradient vectors converges to a clear ridge line, proceeding in a diagonal fashion from (360![[thin space (1/6-em)]](https://www.rsc.org/images/entities/char_2009.gif) 350) to (600
350) to (600![[thin space (1/6-em)]](https://www.rsc.org/images/entities/char_2009.gif) 580). This ridge line, representing the highest relative NOCl yield, indicates that a ratio of approximately 1
580). This ridge line, representing the highest relative NOCl yield, indicates that a ratio of approximately 1![[thin space (1/6-em)]](https://www.rsc.org/images/entities/char_2009.gif) :
:![[thin space (1/6-em)]](https://www.rsc.org/images/entities/char_2009.gif) 1 between the respective flow rates (x and y) is favored in the range of this experiment. In addition, keeping the 1
1 between the respective flow rates (x and y) is favored in the range of this experiment. In addition, keeping the 1![[thin space (1/6-em)]](https://www.rsc.org/images/entities/char_2009.gif) :
:![[thin space (1/6-em)]](https://www.rsc.org/images/entities/char_2009.gif) 1 ratio between the two immiscible phases constant, the range of the total flow rate was extended from 0.65–1.25 mL min−1 to lower and higher values ranging from 0.2 mL min−1 to 2 mL min−1. A constant NOCl yield (within a 5% deviation) was observed for the whole range of flow rates (see Fig. S9 in the ESI†), demonstrating scalability even in this small reactor system.
1 ratio between the two immiscible phases constant, the range of the total flow rate was extended from 0.65–1.25 mL min−1 to lower and higher values ranging from 0.2 mL min−1 to 2 mL min−1. A constant NOCl yield (within a 5% deviation) was observed for the whole range of flow rates (see Fig. S9 in the ESI†), demonstrating scalability even in this small reactor system.
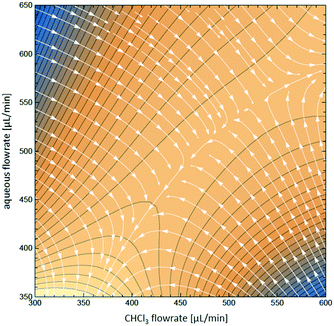 | ||
| Fig. 5 Contour map z(x,y) for the optimization of aqueous and organic flow rates, overlaid with the direction of gradient vectors ∇z(x,y), indicated by arrows. | ||
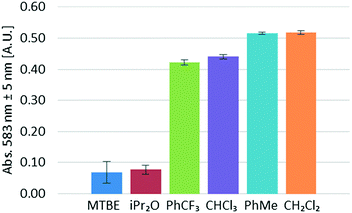
Next, several water-immiscible organic solvents were screened for the extraction of NOCl. Due to the highly reactive character of NOCl, the evaluated solvents were restricted to ethers, halogenated hydrocarbons, and toluene. Using the same set of conditions (6 equivalents of HCl, 1![[thin space (1/6-em)]](https://www.rsc.org/images/entities/char_2009.gif) :
:![[thin space (1/6-em)]](https://www.rsc.org/images/entities/char_2009.gif) 1.1 ratio organic/aqueous phase) and varying the organic solvent, the corresponding UV/vis data for NOCl absorption were collected (Fig. 6). It should be pointed out that no significant solvatochromic effects that could influence the conclusions drawn were observed. Identical λmax for NOCl were observed in all solvents within a ±5 nm range and no widening of the absorption peaks, a typical sign of solvent effects on the extinction coefficient, could be identified. Accordingly, the results from Fig. 6 should be considered as qualitative, yet the most suitable solvent can still be selected. The best results were achieved for dichloromethane and toluene. Lower amounts of NOCl (ca. 15% lower) were observed in α,α,α-trifluorotoluene and chloroform. Poor results were obtained for diisopropyl ether and MTBE. In both cases, the typical strong orange coloration of the solution could not be visually observed in either the aqueous or the organic segments before the liquid–liquid separator. NOCl is most likely poorly soluble in these ethers and the extended contact with the aqueous phase results in significant decomposition of the reagent. This hypothesis was supported by the formation of large amounts of gases (most likely nitric oxide) within the tubing.
1.1 ratio organic/aqueous phase) and varying the organic solvent, the corresponding UV/vis data for NOCl absorption were collected (Fig. 6). It should be pointed out that no significant solvatochromic effects that could influence the conclusions drawn were observed. Identical λmax for NOCl were observed in all solvents within a ±5 nm range and no widening of the absorption peaks, a typical sign of solvent effects on the extinction coefficient, could be identified. Accordingly, the results from Fig. 6 should be considered as qualitative, yet the most suitable solvent can still be selected. The best results were achieved for dichloromethane and toluene. Lower amounts of NOCl (ca. 15% lower) were observed in α,α,α-trifluorotoluene and chloroform. Poor results were obtained for diisopropyl ether and MTBE. In both cases, the typical strong orange coloration of the solution could not be visually observed in either the aqueous or the organic segments before the liquid–liquid separator. NOCl is most likely poorly soluble in these ethers and the extended contact with the aqueous phase results in significant decomposition of the reagent. This hypothesis was supported by the formation of large amounts of gases (most likely nitric oxide) within the tubing.
The amount of NOCl generated using the optimal conditions (i.e. 6 equivalents of HCl, 1![[thin space (1/6-em)]](https://www.rsc.org/images/entities/char_2009.gif) :
:![[thin space (1/6-em)]](https://www.rsc.org/images/entities/char_2009.gif) 1 ratio organic/aqueous streams, and CH2Cl2 as the extraction solvent) was ultimately determined by redox titration using the KI/I2–Na2S2O3 system (see the ESI† for experimental details). The determined yield of NOCl was 86% with respect to NaNO2.
1 ratio organic/aqueous streams, and CH2Cl2 as the extraction solvent) was ultimately determined by redox titration using the KI/I2–Na2S2O3 system (see the ESI† for experimental details). The determined yield of NOCl was 86% with respect to NaNO2.
Integration of NOCl generation with photochemical oximation of cyclohexane
The synthetic applicability of the optimized NOCl generator was then showcased in the light-induced oximation of cyclohexane, which provides cyclohexanone oxime in a single transformation. The key-step of this well-known reaction is the radical photonitrosation of cyclohexane,13,23 initialized by the homolytic cleavage of NOCl.24 The nitroso intermediate then rearranges to the oxime under acidic conditions.9a,13 This process has been extensively studied and developed on the commercial scale by Toray Industries as a convenient route for the preparation of ε-caprolactam, the precursor of nylon 6.10Alternative photochemical methods using alkyl nitrites as nitrosyl radical sources have also been reported using UV light25 and 365 nm or 405 nm LEDs.26
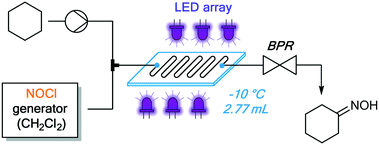
The continuous flow setup consisted of the NOCl generator (described above), an additional reaction stream containing neat cyclohexane, and a continuous photochemical reactor (Fig. 7). A simple flow photoreactor, made of PFA tubing coiled around a beaker, was used for preliminary examination of reaction parameters such as temperature and to evaluate the possibility of solid formation (cyclohexanone oxime is poorly soluble in many organic solvents). Transparent PFA tubing (0.8 mm i.d., 5 mL) and a tempering beaker connected to a thermostat (Huber) for accurate temperature control were utilized. The reactor was irradiated from the inside of the beaker using a 50 W LED array (λmax = 455 nm), composed of 50 individual LEDs. The reactor was covered with aluminum foil and a thermal insulator (see Fig. S10 in the ESI†). To prevent freezing of the cyclohexane within the tubing at temperatures below 6 °C, it was mixed with the organic phase containing NOCl using a T-mixer immediately before entering the cooled zone (without precooling). This served not only to minimize the contact between the reactants in an uncontrolled temperature regime at the beginning of the cooled reactor but also to avoid clogging of the reactor by solidification of the substrate.
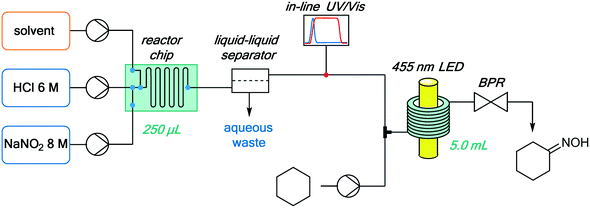 | ||
| Fig. 7 Integrated continuous setup for NOCl generation, purification and quantification, and its downstream utilization for the photonitrosation of cyclohexane. | ||
An initial set of continuous flow reactions at different temperatures was performed in CHCl3 (Table 1) before switching the solvent to CH2Cl2. A residence time of 5 min for the photochemical step was utilized in all cases. Cyclohexane was used in excess (9.5 equivalents), with NOCl as the limiting reactant. Such conditions are typically used for the photonitrosation of cyclohexane.9,26 This strategy simplified the subsequent isolation of the product, as excess cyclohexane can be easily removed by evaporation. As the temperature was gradually decreased from 20 °C to −30 °C, improvement of both the yield and the selectivity of the reaction was observed until −20 °C (Table 1, entries 1–5). The further decrease of the temperature to −30 °C did not improve the results. This temperature effect is in agreement with previous reports on this photochemical reaction.23 Notably, the target cyclohexanone oxime separated from the reaction mixture as an oil from the cyclohexane/DCM solvent mixture, in contrast with the solid precipitate described for the reaction in the absence of the chlorinated solvent.23 This complicated the analysis of the crude reaction mixture, which had to be diluted and vigorously stirred in the collection flask for the preparation of samples for GC analysis. Substitution of CHCl3 by CH2Cl2 as the solvent for the extraction of NOCl and the photochemical reaction medium proved beneficial (Table 1, entry 7). A significant increase in both the selectivity and the yield of the reaction was observed. This solvent effect could potentially be ascribed to the presence of the stabilizer (0.6% ethanol) in CHCl3, which could quench some of the photolytically formed radicals, in addition to the better extraction performance observed for CH2Cl2 (Fig. 6).
| Entry | Temp. [°C] | Selectivity [%]b | Yieldc [%] |
|---|---|---|---|
| a Reactions carried out in a PFA-tubing based reactor with an internal volume of 5.0 mL, using the following flow rates: CHCl3 (563 μL min−1), 6 M HCl (500 μL min−1), 8 M NaNO2 (62.5 μL min−1), cyclohexane (433 μL min−1). A 50 W LED with a λmax of 455 nm was used. b Determined by GC-FID peak area integration. c Determined by GC-FID with diphenyl ether as the internal standard. Calculated with respect to NOCl. d CH2Cl2 instead of CHCl3 was used. | |||
| 1 | 20 | 40 | 16 |
| 2 | 10 | 48 | 24 |
| 3 | 0 | 48 | 24 |
| 4 | −10 | 56 | 27 |
| 5 | −20 | 59 | 30 |
| 6 | −30 | 56 | 28 |
| 7d | −10 | 83 | 49 |
Once the presence of solids in the reaction mixture could be excluded, we moved to a scalable Corning® Advanced-Flow Photo Reactor™ to conduct further optimization studies. This system features a glass plate with an internal mixing structure (2.77 mL volume), jacketed by heat transfer fluid and irradiated by LED panels from both sides.27 The photochemical reactor was integrated at the outlet of the NOCl generator (Fig. 8) analogous to the PFA tubing reactor (Fig. 7). Based on the results obtained in the preliminary experiments (Table 1), all reactions in this unit were carried out in CH2Cl2 at −10 °C. Several irradiation wavelengths, ranging from 340 nm to 540 nm, were evaluated (Table 2) with a 10 minute irradiation time. Notably, the best results were achieved under irradiation using 375 nm and 395 nm LEDs (Table 2, entries 2 and 3). The UV/vis band corresponding to the homolytic cleavage of NOCl is likely the peak with λmax = 340 nm.28 However, using this irradiation wavelength, only a low yield was obtained (entry 1). This is presumably due to the low radiant flux (2.9 W) of the 340 nm LEDs: a known challenge in current UV LED technology.29 Thus, although absorption of 375–395 nm light is 2.5–3 times less efficient, the higher yields can be rationalized by the high radiant flux of those LEDs (46 W and 54 W, respectively, Table 2). As expected, no reaction occurred in the absence of light (entry 7). Decreasing the excess of cyclohexane (under 395 nm irradiation) was unproductive, since both the yield and selectivity of the photonitrosation decreased (see Fig. S13 ESI†).
| Entry | LED λmax [nm] | LED radiant flux [W] | Selectivityb [%] | Yieldc [%] |
|---|---|---|---|---|
| a Reactions carried out at −10 °C in a lab photo reactor with an internal volume of 2.77 mL, using the following flow rates: CH2Cl2 (152 μL min−1), 6 M HCl (135 μL min−1), 8 M NaNO2 (16.9 μL min−1), cyclohexane (117 μL min−1). b Determined by GC-FID peak area integration. c Determined by GC-FID with diphenyl ether as the internal standard. Calculated with respect to NOCl. | ||||
| 1 | 340 | 2.9 | n.d. | 2 |
| 2 | 375 | 46 | 85 | 47 |
| 3 | 395 | 54 | 87 | 55 |
| 4 | 422 | 36 | 84 | 39 |
| 5 | 455 | 48 | 86 | 29 |
| 6 | 530 | 19 | 81 | 40 |
| 7 | Dark | — | n.d. | 2 |
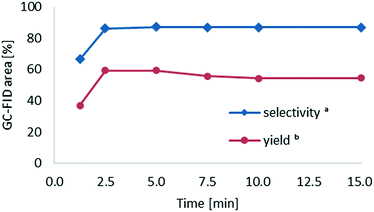
We next investigated the effect of the residence time on the formation of cyclohexanone oxime. During these experiments, a total flow rate of 180 μL min−1 was initially applied (15 min residence time) and then gradually incremented to 2 mL min−1. Notably, the reaction yield and selectivity reached a plateau after a residence time of only 2.5 min (Fig. 9). Higher residence times did not increase the yield nor affect the selectivity. In fact, the yield slightly decreased with residence times longer than 5 min, likely due to partial decomposition of the product under the applied reaction conditions.
Under optimal conditions (−10 °C, 9.5 equivalents of cyclohexane, LED λmax of 395 nm, 2.5 min), the crude reaction mixture was collected from the reactor output for 1.5 hours. The product could be isolated by simple evaporation of all volatiles. The side products of the reaction, chlorocyclohexane and cyclohexanone (identities proposed by GC-MS), could also be readily removed by evaporation. Cyclohexanone oxime (4.1 g) was isolated using this methodology as its hydrochloride salt as an off-white solid. This amount corresponds to a 66% yield for the photochemical step (with respect to NOCl), which agrees well with other methods published in the literature.26 The overall yield of the process, using NaNO2 as the limiting reagent, was 57%. 1H NMR analysis of the product, with trichloroethylene as the internal standard, confirmed that the isolated solid was the hydrochloride salt of the oxime (see Fig. S14 in the ESI†), with a purity of 95% according to GC-FID.
Conclusions
In summary, we have developed a continuous flow method that enables the safe generation and utilization of nitrosyl chloride for organic synthesis. This useful reagent is seldom utilized in organic chemistry laboratories due to its highly corrosive and toxic nature. Generation in situ from inexpensive NaNO2 and HCl in a confined environment within a microreactor permitted its utilization in a safe and controllable manner. Following formation in aqueous solution, the reagent was rapidly extracted into an organic solvent and separated using a continuous liquid–liquid separator. Several reaction parameters, namely the reagent stoichiometry and aqueous/organic phase ratio, have been optimized to arrive at 6 equivalents of HCl and a 1![[thin space (1/6-em)]](https://www.rsc.org/images/entities/char_2009.gif) :
:![[thin space (1/6-em)]](https://www.rsc.org/images/entities/char_2009.gif) 1 water solution/organic solvent ratio. The most suitable solvents for the extraction were found to be CHCl3 or the more appropriate CH2Cl2, toluene and α,α,α-trifluorotoluene. Convenient in-line monitoring of the NOCl concentration was implemented in the continuous flow setup. For this, a custom-built UV/vis flow cell and monitoring of the absorbance at λ 583 nm were found to be optimal. To showcase the synthetic utility of the NOCl generator, the light-induced photonitrosation of cyclohexane was used as a model reaction. This process is an important route for the synthesis of cyclohexanone oxime. Thus, the NOCl generator was telescoped to a continuous photochemical reactor with an additional reaction stream containing cyclohexane. Optimal conditions for the photochemical step resulted in a good yield (57% overall yield with respect to NaNO2) for the desired oxime. The integrated continuous flow setup was run for 1.5 h, producing 4.1 g of the target compound as hydrochloride with 95% purity.
1 water solution/organic solvent ratio. The most suitable solvents for the extraction were found to be CHCl3 or the more appropriate CH2Cl2, toluene and α,α,α-trifluorotoluene. Convenient in-line monitoring of the NOCl concentration was implemented in the continuous flow setup. For this, a custom-built UV/vis flow cell and monitoring of the absorbance at λ 583 nm were found to be optimal. To showcase the synthetic utility of the NOCl generator, the light-induced photonitrosation of cyclohexane was used as a model reaction. This process is an important route for the synthesis of cyclohexanone oxime. Thus, the NOCl generator was telescoped to a continuous photochemical reactor with an additional reaction stream containing cyclohexane. Optimal conditions for the photochemical step resulted in a good yield (57% overall yield with respect to NaNO2) for the desired oxime. The integrated continuous flow setup was run for 1.5 h, producing 4.1 g of the target compound as hydrochloride with 95% purity.
Experimental
General information
Solvents and chemicals were obtained from commercial suppliers and were used without any further purification unless otherwise noted. GC-FID analysis was performed on a ThermoFisher Focus GC with a flame ionization detector, using a TR-5MS column (30 m × 0.25 mm ID × 0.25 μm) and helium as the carrier gas (1 mL min−1 constant flow). The injector temperature was set to 280 °C. After 1 min at 50 °C, the temperature was increased by 25 °C min−1 to 300 °C and kept constant at 300 °C for 4 min. The detector gases for flame ionization were hydrogen and synthetic air (5.0 quality). GC-MS spectra were recorded using a ThermoFisher Focus GC coupled with a DSQ II (EI, 70 eV). A TR-5MS column (30 m × 0.25 mm × 0.25 μm) was used, with helium as the carrier gas (1 mL min−1 constant flow). The injector temperature was set to 280 °C. After 1 min at 50 °C, the temperature was increased by 25 °C min−1 to 300 °C and kept at 300 °C for 3 min. NMR spectra were recorded on a Bruker 300 MHz instrument. 1H and 13C spectra were recorded at 300 MHz and 75 MHz, respectively, with a chemical shift relative to TMS expressed in parts per million. Chemical shifts (δ) are reported in ppm downfield from TMS as the internal standard. The abbreviations bs and m are used to indicate a broad signal and a multiplet signal. UV/vis absorption was measured using an optical fiber based Avantes AvaSpec-ULS2048 spectrometer and the corresponding AvaLight-DHc light source including both a deuterium lamp and a halogen lamp. Absorption spectra were recorded between 199 nm and 769 nm with an integration time of 30 ms using an average of 100 measurements.CAUTION: Nitrosyl chloride (NOCl) should be treated with extreme caution. Because of the high toxicity of the product, all reactions should be carried out in a fume hood with sufficient air flow. Laboratory personnel working with NOCl MUST familiarize themselves with the potential hazards and preventative measures. Excess NOCl should be destroyed by hydrolysis using saturated aqueous NaHCO3.
General procedure for the generation of NOCl in flow
For the optimization of the NOCl generator, three feed solutions (organic solvent, 6 M HCl and 8 M aq. NaNO2) were pumped using Syrris Asia syringe pumps. To establish efficient mixing between the aqueous and the organic phase, a 250 μL microreactor chip from Dolomite was used. The internal structure of this glass chip consists of an inlet/output zone in which up to three feeds are mixed almost simultaneously, a static mixing element with a volume of a few μL (i.d. = ca. 0.2 mm), and a residence time section with an inner diameter of approximately 0.5 mm. The solutions were combined in the following order: 1) NaNO2, 2) HCl, and 3) organic solvent. For continuous separation, a liquid–liquid separator (SEP-10) from Zaiput Flow Technologies equipped with a 0.5 μm pore size PTFE membrane was used. Via a six-port valve (installed to allow for easy purging), the organic stream was fed through a 10 mm UV/vis flow cell featuring two transparent FEP films with a thickness of 0.05 mm to protect the optical fibers of the UV/vis spectrometer. The absorbance at λ 583 nm ± 5 nm was monitored continuously and the obtained graphs (for example see Fig. S7 in the ESI†) were used to determine the steady state plateaus, and the corresponding absorbance. To avoid disturbances of the UV/vis measurements by gas slugs, a back pressure regulator from Zaiput Flow Technologies adjusted to a pressure of 2 bar was installed after the flow cell. When NOCl was not consumed by a subsequent reaction, it was quenched using saturated aqueous NaHCO3.General procedure for optimizing the PNC reaction
The optimization of the photonitrosation of cyclohexane was carried out in a Corning Advanced Flow photo reactor. Whereas both aqueous solutions (HCl and NaNO2) were pumped by a Syrris Asia syringe pump, HPLC type pumps provided by the Corning system were used for CH2Cl2 and cyclohexane. After separation of the CH2Cl2 phase containing NOCl, it was mixed with cyclohexane by a PEEK Y-mixer immediately before the photoreaction at −10 °C. A back pressure regulator from Zaiput Flow Technologies included in the Corning system was set to 2 bar to avoid differences in residence time, caused by gas slugs. The reaction solution was collected for a defined time in a 20 mL test tube containing diphenyl ether (0.50 mmol) in CH2Cl2 (2.5 mL) to serve as the internal standard for GC-FID (calibration data are collected in Fig. S12†). Subsequent to the collection, the reaction mixture was neutralized by saturated aq. NaHCO3, and extracted with CH2Cl2. Based on GC-FID, cyclohexanone oxime (5.56 min) was quantified via the amount of diphenyl ether (7.56 min) according to the calibration shown in the ESI.†General procedure for the isolation of cyclohexanone oxime
For the isolation of cyclohexanone oxime under optimized conditions, 9.5 equivalents of cyclohexane were employed and the reaction was irradiated with an LED (λmax = 395 nm) for 2.5 min within the Corning photo reactor. The following flow rates were used: CH2Cl2 (608 μL min−1), 6 M HCl (540 μL min−1), 8 M NaNO2 (67.5 μL min−1) and cyclohexane (468 μL min−1). The output stream of the photo reactor was collected in a 250 mL round bottom flask for 90 min, and was purged with N2 to remove excess NOCl. The reaction mixture was concentrated under reduced pressure maintaining a temperature below 30 °C, until 4.11 g of cyclohexanone oxime hydrochloride were obtained as a hygroscopic off-white solid (66% yield based on NOCl). δH (300 MHz, DMSO-d6) 10.79 (2H, bs), 2.45–2.36 (2H, m), 2.23–2.15 (2H, m), 1.63–1.48 (6H, m). δC (75 MHz, DMSO-d6) 159.8, 31.2, 26.5, 25.2, 25.2, 24.2.Conflicts of interest
There are no conflicts to declare.Acknowledgements
The CC FLOW project (Austrian Research Promotion Agency FFG No. 862766) is funded through the Austrian COMET Program by the Austrian Federal Ministry of Transport, Innovation, and Technology (BMVIT), the Austrian Federal Ministry of Science, Research and Economy (BMWFW) and by the State of Styria (Styrian Funding Agency SFG). The authors thank Yuesu Chen for assistance with the mathematical treatment of the UV data and Bettina Hierzberger for her contribution to the design of the UV flow cell.Notes and references
- (a) L. J. Beckham, W. A. Fessler and M. A. Kise, Chem. Rev., 1951, 48, 319–396 CrossRef CAS PubMed; (b) D. Lyn, H. Williams and V. Sikervar, in Encyclopedia of Reagents for Organic Synthesis, John Wiley & Sons, Ltd, Chichester, UK, 2014, vol. 1, pp. 1–3 Search PubMed.
- W. A. Tilden, J. Chem. Soc., 1874, 630–636 RSC.
- (a) W. A. Tilden and W. A. Shenstone, J. Chem. Soc., 1877, 554–561 RSC; (b) W. A. Tilden and M. O. Forster, J. Chem. Soc., Trans., 1894, 65, 324–335 RSC; (c) W. Ipatiew, J. Prakt. Chem., 1900, 61, 114–129 CrossRef; (d) O. Wallach, in Terpene und Campher, Veit, Leipzig, 1909, pp. 63–69 Search PubMed.
- (a) J. Meinwald, Y. C. Meinwald and T. N. Baker, J. Am. Chem. Soc., 1963, 85, 2513–2514 CrossRef CAS; (b) T. Beier, H. G. Hauthal and W. Pritzkow, J. Prakt. Chem., 1964, 26, 304–313 CrossRef CAS; (c) Z. Yoshida and K. Nakagawa, Tetrahedron Lett., 1965, 6, 2763–2766 CrossRef; (d) P. P. Kadzyauskas and N. S. Zefirov, Russ. Chem. Rev., 1968, 37, 543–550 CrossRef; (e) M. M. Rogic, T. R. Demmin, R. Fuhrmann and F. W. Koff, J. Am. Chem. Soc., 1975, 97, 3241–3243 CrossRef CAS; (f) M. Narendra Mallya, G. Nagendrappa, J. Shashidhara Prasad, M. Sridhar, N. Lokanath and N. Begum, Tetrahedron Lett., 2001, 42, 2565–2568 CrossRef CAS; (g) X. Sun, T. Chu and X. Wang, Nucl. Med. Biol., 2010, 37, 117–123 CrossRef CAS PubMed; (h) P. E. Krasnikov, E. A. Sidnin, V. A. Osyanin and Y. N. Klimochkin, Russ. J. Org. Chem., 2015, 51, 325–329 CrossRef CAS.
- G. Kaupp, A. Herrmann and J. Schmeyers, Chem. – Eur. J., 2002, 8, 1395–1406 CrossRef CAS.
- (a) M. S. Newman and W. M. Edwards, J. Am. Chem. Soc., 1954, 76, 1840–1845 CrossRef CAS; (b) M. M. Chen, A. F. D'Adamo and R. I. Walter, J. Org. Chem., 1961, 26, 2721–2727 CrossRef CAS; (c) Y. Kuo, T. Aoyama and T. Shioiri, Chem. Pharm. Bull., 1982, 30, 899–902 CrossRef CAS; (d) M. Nakajima and J. P. Anselme, J. Org. Chem., 1983, 48, 2492–2496 CrossRef CAS.
- (a) G. B. Bennett, R. B. Mason, L. J. Alden and J. B. Roach, J. Med. Chem., 1978, 21, 623–628 CrossRef CAS PubMed; (b) E. C. Taylor and D. J. Dumas, J. Org. Chem., 1980, 45, 2485–2489 CrossRef CAS; (c) E. C. Taylor and D. J. Dumas, J. Org. Chem., 1982, 47, 116–119 CrossRef CAS; (d) J. R. Leis, M. E. Peña and D. L. H. Williams, J. Chem. Soc., Chem. Commun., 1987, 45–47 RSC; (e) A. H. Mohammed and G. Nagendrappa, Tetrahedron Lett., 2003, 44, 2753–2755 CrossRef CAS; (f) R. U. Gutiérrez, A. Rebollar, R. Bautista, V. Pelayo, J. L. Várgas, M. M. Montenegro, C. Espinoza-Hicks, F. Ayala, P. M. Bernal, C. Carrasco, L. G. Zepeda, F. Delgado and J. Tamariz, Tetrahedron: Asymmetry, 2015, 26, 230–246 CrossRef.
- (a) E. V. Lynn, J. Am. Chem. Soc., 1919, 41, 368–370 CrossRef CAS; (b) E. V. Lynn and O. Hilton, J. Am. Chem. Soc., 1922, 44, 645–648 CrossRef CAS.
- (a) Y. Ito, Bull. Chem. Soc. Jpn., 1956, 29, 227–230 CrossRef CAS; (b) Y. Ito, US Pat., 3090739A, 1963 Search PubMed; (c) Y. Ito and S. Matsuda, Ann. N. Y. Acad. Sci., 1969, 147, 618–624 CrossRef CAS; (d) S. Kazuhiro and Y. Masashi, JPO, 2006052163, 2006 Search PubMed; (e) T. Takahashi, Y. Nishikawa and S. Morita, US Pat., 9181177B2, 2015 Search PubMed.
- J. Tinge, M. Groothaert, H. op het Veld, J. Ritz, H. Fuchs, H. Kieczka and W. C. Moran, in Ullmann's Encyclopedia of Industrial Chemistry, Wiley-VCH Verlag GmbH & Co. KGaA, Weinheim, Germany, 2018, pp. 1–31 Search PubMed.
- (a) G. B. Taylor, US Pat., 1717951, 1929 Search PubMed; (b) W. C. Klingelhoefer, US Pat., 2228273A, 1941 Search PubMed.
- (a) H. A. Taylor and R. R. Denslow, J. Phys. Chem., 1927, 31, 374–382 CrossRef CAS; (b) M. B. Sherwin, S. N. Fox and J. W. Colton, US Pat., 3443898, 1969 Search PubMed; (c) J. H. Trask, US Pat., 3649191, 1972 Search PubMed.
- M. Pape, Photochemie, Springer Berlin Heidelberg, Berlin, Heidelberg, 1967, pp. 559–604 Search PubMed.
- (a) W. Bolzani, DE Pat., 459738, 1928 Search PubMed; (b) F. H. Thurber and R. C. Thielke, J. Am. Chem. Soc., 1931, 53, 1030–1032 CrossRef CAS; (c) R. Weiß, K. Wagner and M. Hertel, Chem. Ber., 1984, 117, 1965–1972 CrossRef; (d) E. K. Haub, A. C. Lizano and M. E. Noble, Inorg. Chem., 1995, 34, 1440–1444 CrossRef CAS.
- F. Csende, Mini-Rev. Org. Chem., 2015, 12, 127–148 CrossRef CAS.
- J. R. Morton and H. W. Wilcox, in Inorganic Syntheses, John Wiley & Sons, Ltd, 1953, pp. 48–52 Search PubMed.
- (a) B. Gutmann, D. Cantillo and C. O. Kappe, Angew. Chem., Int. Ed., 2015, 54, 6688–6728 CrossRef CAS PubMed; (b) M. Movsisyan, E. I. P. Delbeke, J. K. E. T. Berton, C. Battilocchio, S. V. Ley, C. V. Stevens, P. Camus, S. Hattou, C. Guermeur, S. J. Taylor, Y. Xiang and J. Young, Chem. Soc. Rev., 2016, 45, 4892–4928 RSC; (c) N. Kockmann, P. Thenée, C. Fleischer-Trebes, G. Laudadio and T. Noël, React. Chem. Eng., 2017, 2, 258–280 RSC.
- P. Poechlauer, S. Braune, B. Dielemans, B. Kaptein, R. Obermüller and M. Thathagar, Chim. Oggi-Chem. Today, 2012, 30, 51–54 CAS.
- L. L. Simon, H. Pataki, G. Marosi, F. Meemken, K. Hungerbühler, A. Baiker, S. Tummala, B. Glennon, M. Kuentz, G. Steele, H. J. M. Kramer, J. W. Rydzak, Z. Chen, J. Morris, F. Kjell, R. Singh, R. Gani, K. V. Gernaey, M. Louhi-Kultanen, J. O'Reilly, N. Sandler, O. Antikainen, J. Yliruusi, P. Frohberg, J. Ulrich, R. D. Braatz, T. Leyssens, M. von Stosch, R. Oliveira, R. B. H. Tan, H. Wu, M. Khan, D. O'Grady, A. Pandey, R. Westra, E. Delle-Case, D. Pape, D. Angelosante, Y. Maret, O. Steiger, M. Lenner, K. Abbou-Oucherif, Z. K. Nagy, J. D. Litster, V. K. Kamaraju and M.-S. Chiu, Org. Process Res. Dev., 2015, 19, 3–62 CrossRef CAS.
- A. Adamo, P. L. Heider, N. Weeranoppanant and K. F. Jensen, Ind. Eng. Chem. Res., 2013, 52, 10802–10808 CrossRef CAS.
- C. M. Roehl, J. J. Orlando and J. G. Calvert, J. Photochem. Photobiol., A, 1992, 69, 1–5 CrossRef CAS.
- (a) FIA Series Microvolume Flow Cells, https://oceanoptics.com/product/fia-series-microvolume-flow-cells/, (accessed November 30th 2018); (b) Avantes Micro Flow Cell, https://www.avantes.com/products/accessories/item/278-micro-flow-cell, (accessed November 30th 2018); (c) Hellma Analytics: Flow-Through Cells, http://www.hellma-analytics.com/text/1073/en/pressure-resistance-flow-through-cells.html, (accessed November 30th 2018); (d) G. Glotz and C. O. Kappe, React. Chem. Eng., 2018, 3, 478–486 RSC.
- M. A. Naylor and A. W. Anderson, J. Org. Chem., 1953, 18, 115–120 CrossRef CAS.
- (a) A. Kiss, Rec. Trav. Chim., 1923, 42, 665–674 CrossRef CAS; (b) G. B. Kistiakowsky, J. Am. Chem. Soc., 1930, 52, 102–108 CrossRef CAS; (c) H. Miyama, N. Harumiya, Y. Ito and S. Wakamatsu, J. Phys. Chem., 1968, 72, 4700–4701 CrossRef CAS; (d) M. W. Mosher and N. J. Bunce, Can. J. Chem., 1971, 49, 28–34 CrossRef; (e) E. Müller and H. Metzger, Chem. Ber., 1954, 87, 1282–1293 CrossRef; (f) E. Müller, H. Metzger, D. Fries, U. Heuschkel, K. Witte, E. Waidelich and G. Schmid, Angew. Chem., 1959, 71, 229–236 CrossRef.
- A. Mackor, J. U. Veenland and T. J. de Boer, Rec. Trav. Chim., 1969, 88, 1249–1262 CrossRef CAS.
- J. Wysocki, J. H. Teles, R. Dehn, O. Trapp, B. Schäfer and T. Schaub, ChemPhotoChem, 2018, 2, 22–26 CrossRef CAS.
- (a) N. Emmanuel, C. Mendoza, M. Winter, C. R. Horn, A. Vizza, L. Dreesen, B. Heinrichs and J.-C. M. Monbaliu, Org. Process Res. Dev., 2017, 21, 1435–1438 CrossRef CAS; (b) R. Gérardy, M. Winter, C. R. Horn, A. Vizza, K. Van Hecke and J.-C. M. Monbaliu, Org. Process Res. Dev., 2017, 21, 2012–2017 CrossRef.
- N. M. Ballash and D. A. Armstrong, Spectrochim. Acta, Part A, 1974, 30, 941–944 CrossRef.
- (a) Y. Muramoto, M. Kimura and S. Nouda, Semicond. Sci. Technol., 2014, 29, 084004 CrossRef; (b) M. Sender and D. Ziegenbalg, Chem. Ing. Tech., 2017, 89, 1159–1173 CrossRef CAS.
Footnote |
| † Electronic supplementary information (ESI) available: Supplementary figures and data, and copies of NMR. See DOI: 10.1039/c8re00323h |
| This journal is © The Royal Society of Chemistry 2019 |

