
Conversion of saline waste-water and gaseous carbon dioxide to (bi)carbonate salts, hydrochloric acid and desalinated water for on-site industrial utilization
Saad
Dara
ab,
Arman
Bonakdarpour
 *ab,
Meghan
Ho
a,
Rubenthran
Govindarajan
a and
David P.
Wilkinson
*ab
*ab,
Meghan
Ho
a,
Rubenthran
Govindarajan
a and
David P.
Wilkinson
*ab
aDepartment of Chemical and Biological Engineering and the Clean Energy Research Center, University of British Columbia, 2360 East Mall, Vancouver, B.C. V6T1Z3, Canada. E-mail: arman@chbe.ubc.ca; dwilkinson@chbe.ubc.ca
bMangrove Water Technologies Ltd., 3800 Wesbrook Mall, Vancouver, B.C. V6S2L9, Canada
First published on 20th November 2018
Abstract
A method for the conversion of gaseous carbon dioxide and saline waste-water to desalinated water and value-added products using a new approach to electrodialysis is demonstrated and characterized. The method consists of a 5-compartment electrochemical cell including an anode, cathode and three electrodialytic compartments. Water and gaseous CO2/O2 are electrochemically converted to oxygen/protons and bi(carbonate)/hydroxide at the anode and cathode, respectively. The three central electrodialysis compartments combine the ions present in the saline water with the products of the anode and cathode to produce value-added chemicals and desalinated water. A custom-built electrochemical cell with an active area of 3.24 cm2 containing an array of two anion and cation exchange membranes each, Pt/C catalyzed cathode and titanium anode electrodes were used. The feed to the anode, cathode and central compartment were 0.1 M H2SO4, various mixtures of carbon dioxide and oxygen, and a 1 M sodium chloride stream, respectively. Clear production of hydrochloric acid, desalinated water and bi(carbonate)/hydroxide salts was observed in the respective compartments over a 24 hour period of testing. Current efficiencies of alkaline (bicarbonate, carbonate or hydroxide) ions and proton productions were as high as 71% and 96%, respectively. Polarization losses across the different compartments of the electrochemical cell were mapped to determine the source of overpotentials with different gas compositions. This concept is currently being demonstrated in a 0.5 m2 commercial scale pilot reactor.
1. Introduction
Management of freshwater consumption, saline water production and greenhouse gas (GHG) emissions poses significant challenges for different industrial sectors including mining, chemical processes and oil & gas operations. While scarcity and reduced reliability of freshwater resources have reduced the water available for industrial use, increasing regulations and fewer opportunities for safe disposal of industrial saline water have increased the complexity of managing water flows to and from industrial sites. Consequently, these macro-drivers have resulted in an increased need for reuse of saline water within industry.1Desalination options for industrial processes can be categorized into either thermal/phase-change or membrane based processes.2–6 Thermal desalination processes include multi-stage flash, multiple effect boiling, vapor compression, humidification/dehumidification and solar stills.7 Thermal based desalination technologies are well known but are considered to be both capital and energy intensive.8,9 In addition, these processes tend to be inefficient in terms of energy consumption and suffer from corrosion and scaling issues.
Membrane-based technologies include membrane distillation, reverse osmosis and electrodialysis and rely on different methods of operation. Membrane distillation is a thermally driven process in which a hydrophobic membrane (e.g., polyvinylidene fluoride membranes or polypropylene membranes) is subjected to a temperature gradient.5,6 The liquid water is repelled by the membrane while the membrane pores (∼0.2–1 μm) allow the passage of water vapor. Reverse osmosis (RO), which is the most commonly used desalination process globally, utilizes semipermeable membranes and pressure differentials to separate various different ions and molecules from a waste-water stream.4 In addition to these physical methods, electrodialysis is also used for desalination of brackish water. Electrodialysis is an electrochemical membrane separation technique that uses ion-selective membranes as a physical barrier through which ions are transported away from a feed solution under the application of an external electric potential.10 All of these membrane-based desalination technologies, however, suffer, to some extent, from scaling and fouling of their membrane components, and utilize expensive electrical energy.11–13
While several options for desalination processes exist, these technologies are: i) an added-cost for the end-user, ii) produce a concentrated waste-stream, which requires disposal, and iii) are highly energy intensive. The handling of the concentrated waste for disposal can often make the process uneconomic while the high-energy intensity of desalination options also contributes to the carbon dioxide emissions from industrial processes. Currently, carbon dioxide emissions from industrial processes account for about 21% of the global anthropogenic carbon emissions, which are widely considered to be the primary cause of global warming.
Approaches to the reduction of carbon emissions have included: i) transition to low carbon or non-carbon producing processes (e.g., renewable energy technologies),14 ii) CO2 capture and sequestration,15–32 and iii) conversion of CO2 to useful products. In recent years, the use of carbon dioxide as a reactant feed for production of fuels and/or chemicals has received more attention. In particular, a number of approaches, including the conversion of carbon dioxide through electrochemical,18–21 photo-chemical22 or chemical23 means have been reported.
Electrochemical approaches have included electroreduction of CO2 to formates or formic acid,33–36 oxalates or oxalic acid,37 ethylene,38 liquid fuels including methanol,39–41 or synthesis gas in the form of carbon monoxide and hydrogen.42 Electrochemical conversion of carbon dioxide has also been demonstrated in a fuel cell where a selective catalyst was used to convert carbon dioxide to carbonate ions which act as the charge transfer species.43 In these approaches, carbon dioxide undergoes an electro-reduction reaction at the cathode of the electrochemical reactor. In each case, the operating conditions, catalyst composition and reactor design determine the composition of product(s), conversion efficiencies and energy requirements. Although these electrochemical approaches have, in general, been technically successful, they rely on zero-carbon emitting sources of power to be a net-carbon negative process.
Several options for the desalination of saline water and treatment of carbon dioxide exist. However, conventional technologies have attempted to address both of these issues separately. Recently, we reported an electrodialysis-based process which simultaneously desalinates water and converts CO2 into value-added chemicals in the form of inorganic acids and carbonate salts.44 Using an electrodialysis cell equipped with anion and cation exchange membranes, a Pt/Ir-coated Ti anode and Ti mesh cathode, HCl and NaHCO3 products were produced from carbonic acid (CO2 dissolved in water) and NaCl feed. However, the product formation fluxes with carbonic acid feed are limited primarily due to the low solubility of carbon dioxide in water and weak dissociation of carbonic acid which lead to high ohmic losses. In the present article we mitigate the low solubility of CO2 by introducing a gas-fed electrode at the cathode in order to convert a gaseous mixture of CO2/O2 and saline water to value-added chemical products. Direct use of CO2 gas leads to at least a 40× higher flux of product production compared to the carbonic acid feed thus making the overall process commercially viable. To the best of our knowledge this is the first demonstration of a combined electrodialysis process with cathodic electroreduction of a gaseous feed. This process has significant potential in the areas of waste recovery and processing when gaseous feed are involved because by an appropriate choice of catalyst and operating conditions the process can be tuned to convert other types of gaseous pollutants (e.g., sulfur dioxide).
2. Experimental
2.1 Electrochemical cell hardware
All the experiments were conducted with a custom built electrochemical cell with an active membrane area of 3.24 cm2 and an intra-membrane gap of 0.08 cm. Serpentine flow fields for the anode (99% titanium, Superior Alloy Technologies) and the cathode (high temperature conductive graphite, McMaster-Carr Supply Company) with channel dimensions of 1 mm (width) × 1 mm (depth) were used for the electrode compartments. The spacers (with ports) in each compartment were aligned in such a way to ensure flow would only be provided to the appropriate compartments. The membrane gap was maintained with the use of spacer (silicone rubber sheet, HT-6220, Stockwell Elastomerics Inc.) with a thickness of 0.0813 cm and an active open area of 3.24 cm2 for fluid flow. The membranes were supported in each compartment with the use of porous glass filter papers (1.6 μm particle retention, Fisher Scientific Company). Gold-plated copper current collectors were positioned next to the flow field plates. End plates with a nitrogen bladder were used to provide compression pressure (25 PSI) to the complete cell assembly to reduce contact resistance within and between the cell compartments.2.2 Electrode preparation
The anode consisted of a mixed metal oxide Ir-mixed oxide coated titanium electrode (Type G, Metakem GmbH). The anode was placed onto the titanium anode flow plate and the assembly compression was used to ensure adequate contact was provided.Two different cathode types, a gas diffusion electrode (GDE) and a catalyst coated membrane (CCM) type electrode were examined. Both the CCM and GDE were prepared using a fully-automated spray coater (ExactaCoat equipped with Ultrasonic Accumist Nozzle and a heated vacuum table, Sono-Tek Corporation). The vacuum table was maintained at 95 °C to evaporate the solvents used to prepare the catalyst ink. The catalyst layer ink consisted of 85 wt% catalyst (20 wt% Pt dispersed on Vulcan XC-72, Alfa-Aesar) catalyst and 15 wt% ionomer (AEMION ionomer, Ionomr Innovations Inc.) in an aqueous water/methanol solution and was spray coated on the anion exchange membranes (Fumasep FAB thickness 100–130 μm, Fumatech® GmBH). The catalyst loading on the CCM membrane was 0.4 mgPt cm−2. Different membranes were used for the preparation of the CCM including those available from PC-Cell GmBH and Fumatech GmBH. However, these CCMs suffered from incompatibility of the ionomer used in the catalyst ink with the membrane. The Fumatech FAB membrane was found to be relatively more reliable with respect to catalyst layer adhesion to the membrane. The ink was spray coated onto a Sigracet 25-BC gas diffusion layer to obtain a loading of 0.4 mgPt cm−2. Three layers of carbon fiber paper (Toray carbon paper, TGP-H-090, FuelCellEarth) were used to support the gas diffusion electrode or the CCM. In all cases, the catalyst layer was in direct contact with the anion exchange membrane.
Table 1 summarizes all the membranes used for the experiments. The membranes were pre-treated by soaking in a salt solution of the relevant ion for at least 24 hours. The choice of membranes used was based on the manufacturer's recommendations for the different ions and solutions. Baseline testing parameters for the different tests are summarized in Table 2.
| Ion | Membrane type | Membrane name (manufacturer) | Pre-treatment solution |
|---|---|---|---|
| Proton | Acidic sulfonic PEM | Nafion 117 (Nafion®) | Deionized water |
| Sodium | Acidic sulfonic CEM | PC MVK (PC-Cell) | 5 wt% NaCl |
| Carbonate, bicarbonate, hydroxide | Alkaline ammonium AEM | FAB (Fumatech) | 0.5 M NaHCO3 |
| Catalyst coated membrane | |||
| Chloride | Alkaline ammonium AEM | PC MVA (PC-Cell) | 5 wt% NaCl |
| Polarization curves | Long-term testing | |
|---|---|---|
| Gas flow rate | 50 ml min−1 with different compositions | 50 ml min−1 with different compositions |
| Saline stream | 1 M NaCl | 1 M NaCl |
| Acid compartment initial feed | 50 mM HCl | 50 mM HCl |
| Base compartment initial feed | 50 mM NaHCO3 | 50 mM Na2SO4 |
| Anode electrolyte | 0.1 M H2SO4 | 0.1 M H2SO4 |
| Temperature | 21 °C | 21 °C |
| Cell compression pressure | 25 psi | 25 psi |
2.3 Polarization measurements
These measurements were performed potentio-statically using a computer-controlled potentiostat (SP-150, BioLogic Sciences Instruments). Current was recorded when the applied potential stabilized (±2 mA) and was held constant for at least 3 minutes. All polarization measurements were repeated a minimum of three times. Reported data were averaged for the three repetitions. To reduce the effects of changing product concentration, the polarization experiments were obtained while providing the product chambers with initial concentrations such that the concentration of the solution would not change appreciably over the period of testing. All polarization curves were obtained using the Fumatech FAB samples described earlier. The initial concentrations of the solutions provided are summarized in Table 2 for the testing conditions.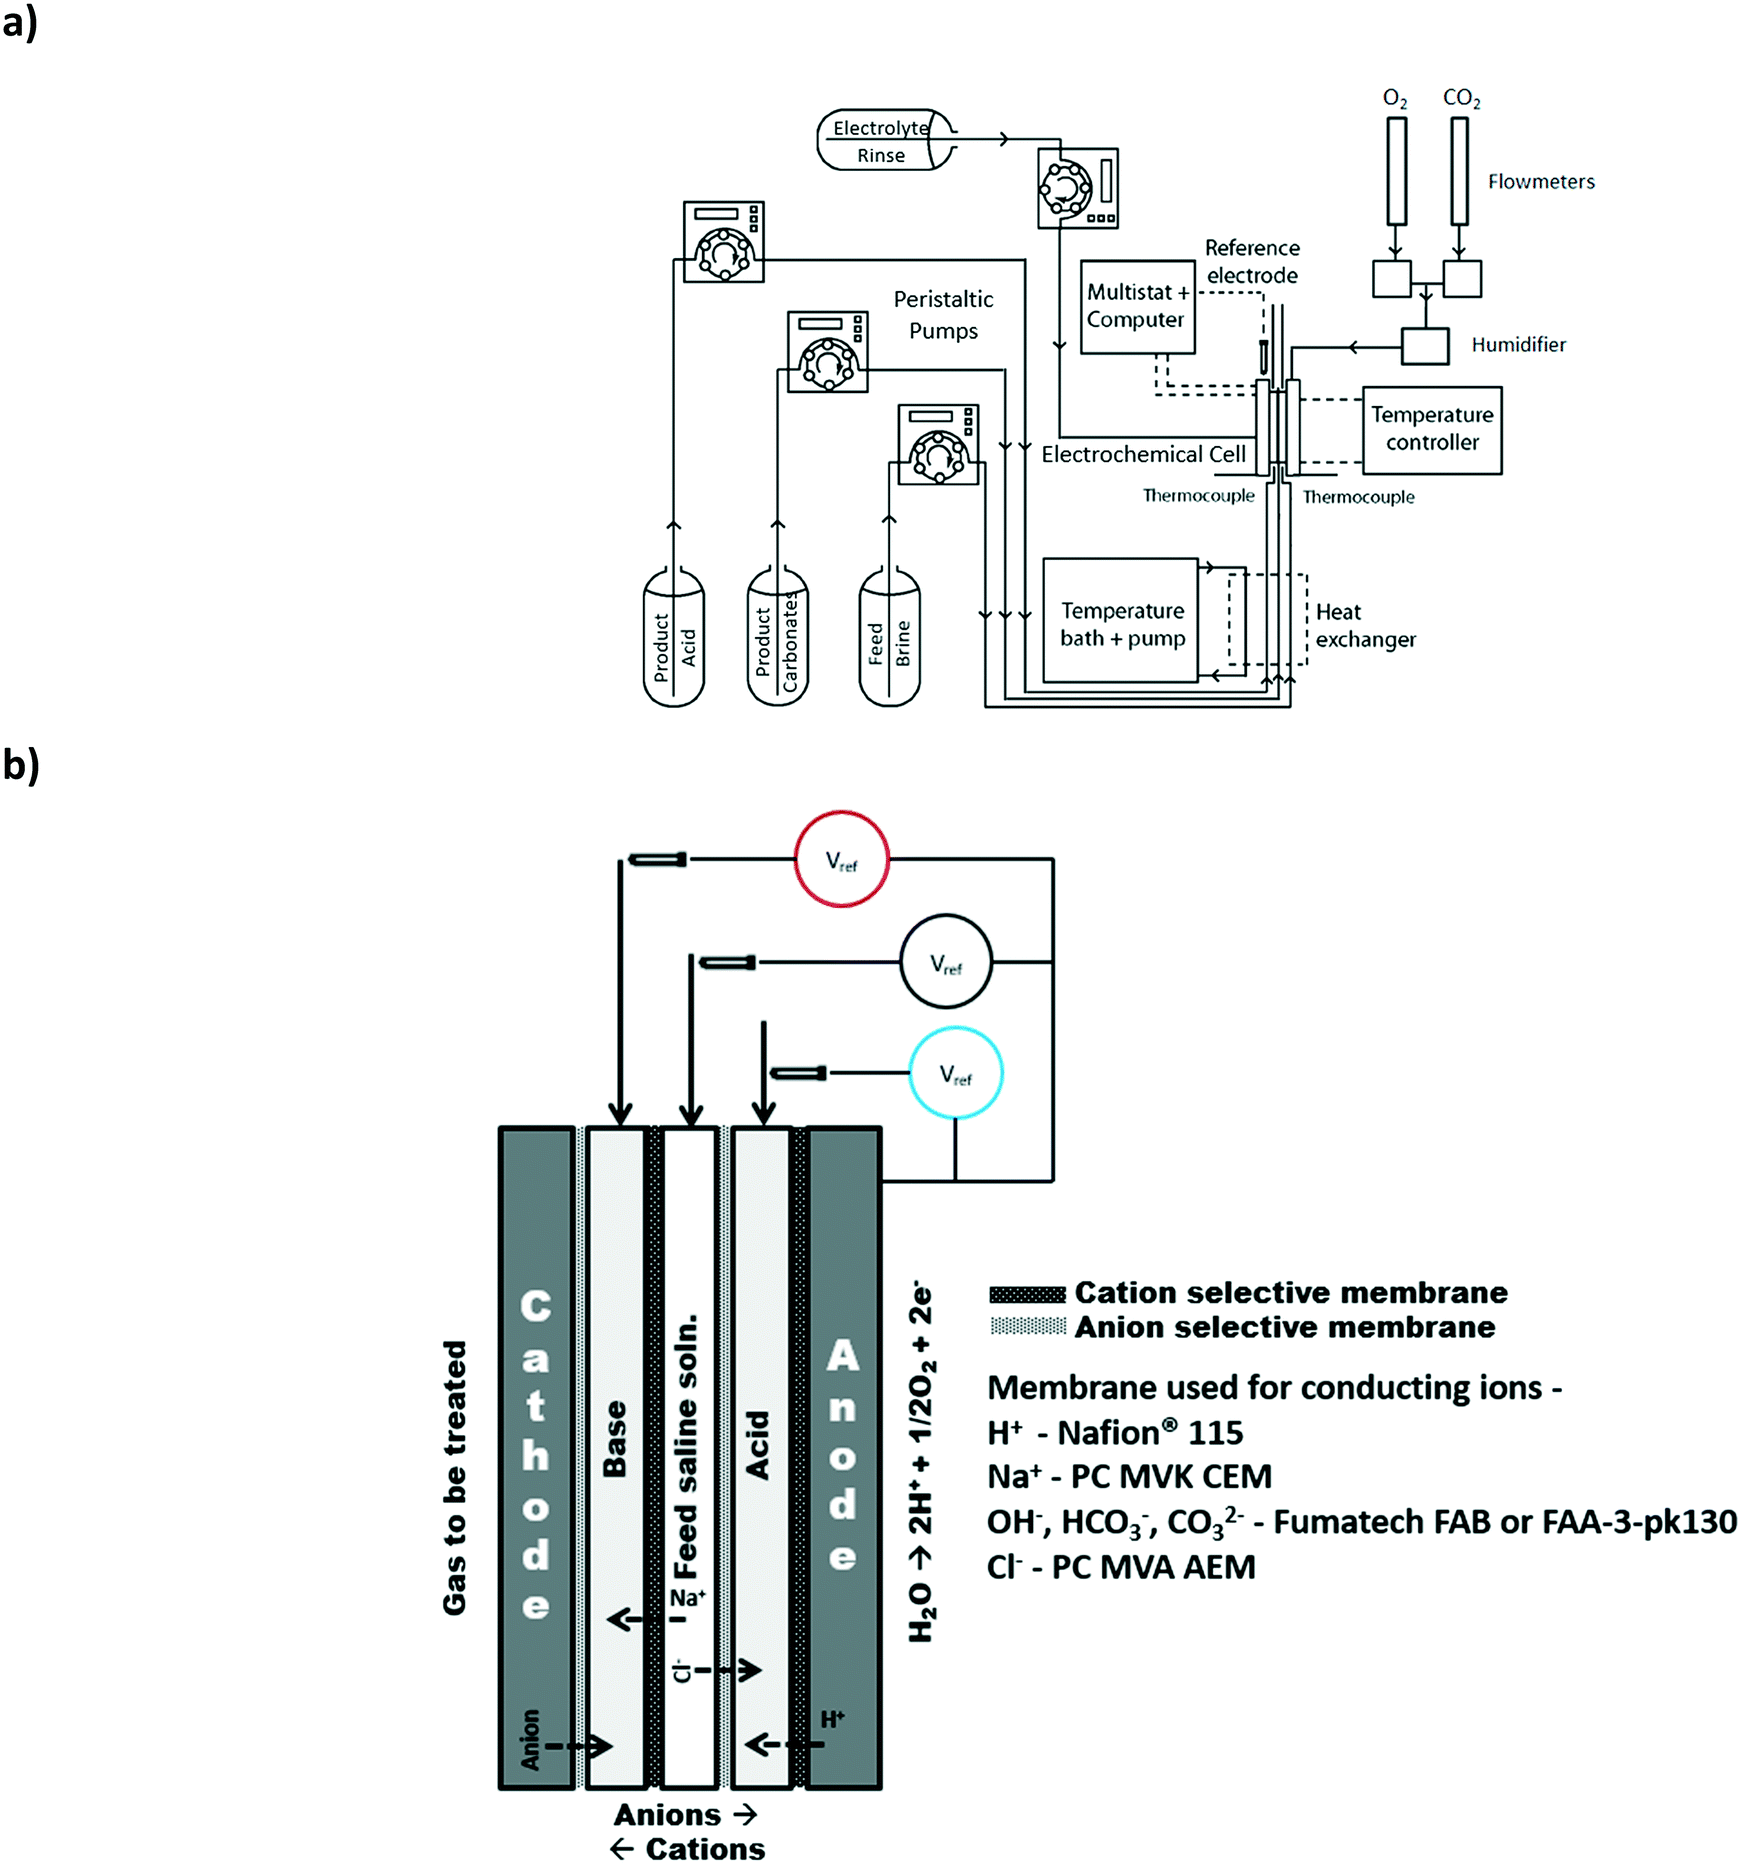 | ||
| Fig. 1 a) Schematic diagram of the overall system used for the testing of the electrodialysis cell; b) schematic diagram of the electrodialysis cell and placement of reference electrodes for the electrochemical measurement method. | ||
3. Results and discussions
Herein, we refer to the three central electrodialysis compartments as the base, acid and saline feed compartments (Fig. 1b). In general, the input waste gas can be provided to either the anode or the cathode where it may be oxidized or reduced, respectively. The produced ionic species can then be mineralized with the ions present in the saline water using a strategic pattern of anion and cation selective membranes.3.1 Baseline experiment: production of chemicals with oxygen and saline water
In its simplest form, the reactor can be operated to produce hydroxide ions at the cathode and protons at the anode. This is achieved by providing humidified air or oxygen to the cathode and water to the anode according to: | (1) |
 | (2) |
Under an applied potential, sodium and chloride ions present in the saline water stream migrate towards the cathode and anode, respectively. Chloride ions and the protons, transported from the anodic compartment, produce hydrochloric acid while the sodium ions combine with the OH− to produce sodium hydroxide in separate compartments. The compartments are kept separated with the use of anion and cation selective membranes which are used to conduct relevant ions.
Fig. 2 shows the results of a potentio-static test (3 V, 24 hours) using initial feeds of sodium sulfate and sodium chloride (see Table 2) for the base and acid compartments, respectively. The observed current density of the cell improved during the 24 h test period to approximately 41 mA cm−2 (Fig. 2a). The initial (<1 h) improvements in cell current density are associated with electrode and membrane conditioning. Further improvements in the current density (>1 h) are related to the reduced resistance in the cell because of the increasing concentrations of the acid and base compartments. Fig. 2a also shows the improvements in the measured cell resistance during the 24 hour testing period.
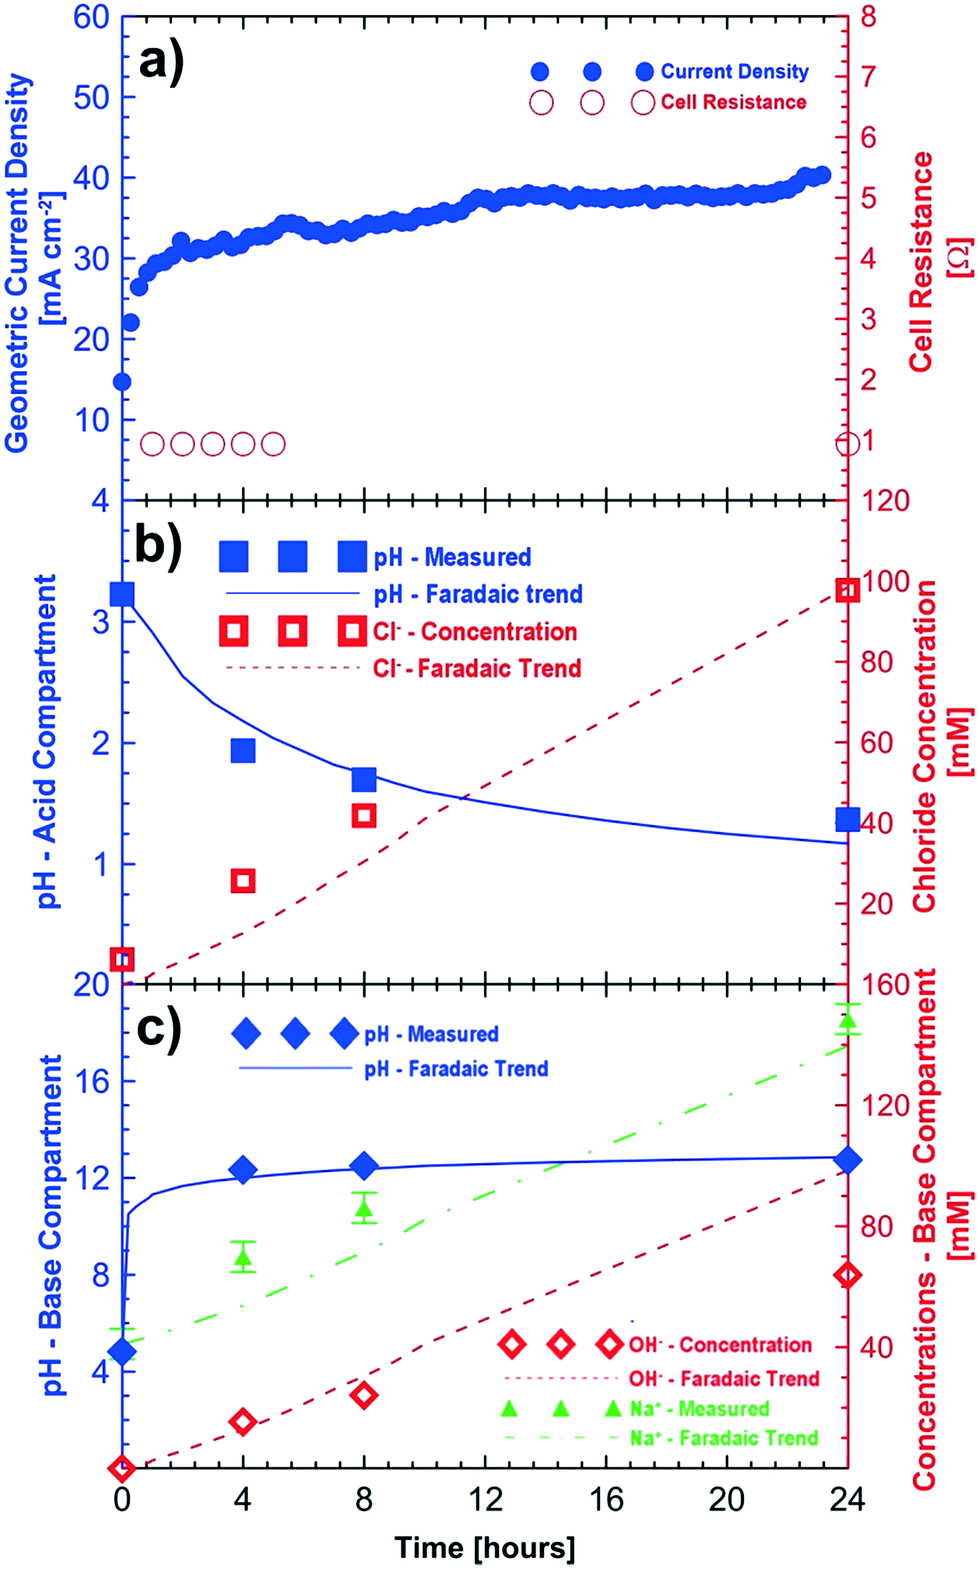 | ||
| Fig. 2 Proof-of-concept testing in a 3.24 cm2 cell with humidified oxygen feed at the cathode. a) Current density and cell resistance during the 24 hour testing period; b) changes in pH and chloride ion concentration in the acid compartment; c) change in pH, sodium ion and hydroxide concentrations in the base compartment. Cell potential = 3 V, cathode feed = humidified O2, anode feed = water. | ||
The pH of the acid compartment decreased from an initial value of 3.23 to a final value of 1.37. Overall the increase in the acidity of the acid compartment followed the expected trend from Faraday's law over 24 hours. The agreement between the observed and expected changes in the Cl− concentration is even better. Some of the discrepancy between the measured and expected pH values is attributed to the loss of protons through the anion exchange membrane to the saline feed compartment which corresponds to the observed pH decrease from 5.72 to 1.95 in the saline feed compartment. After correcting for this loss of protons to the saline compartment, we obtain a measured pH value of 1.27 for the acidic compartment. This result agrees well with the expected value of 1.17 ± 0.10. Fig. 2b shows the measured and expected production of hydrochloric acid (i.e., changes in the H+ and Cl− concentrations) in the acid compartment after correction of proton leakage through the chloride conducting membrane.
The increase in the pH of the base compartment closely follows the expected trend. Titration of the base solution with 10 mM hydrochloric acid showed that the base compartment solution had a concentration of 64 mM of hydroxide corresponding to a pH value of 12.80 after the 24 hour test period. This agrees very well with the pH value of 12.76 obtained by direct measurement; however, it is lower than the expected pH value of 13 from Faraday's law. One possible explanation is a very small loss of hydroxide ions to the saline compartment through the sodium conducting membrane. However, a corresponding increase of the alkalinity of the saline compartment was not observed. This can be explained by proton leakage from the acid compartment, which is likely to be higher, hence neutralizing any possible hydroxide ions which could have migrated from the base compartment. The current efficiency of the cell for hydroxide conversion is ≈64%. The sodium ion concentration in the base compartment also increased and followed the expected Faradaic trend within the experimental errors of ±5 mM. Fig. 2c shows the measured and expected concentration of sodium hydroxide in the base compartment.
3.2 Production of carbonate salts and hydrochloric acid
Carbonate and bicarbonate species can be formed by introducing CO2 to the cathode gas feed where it reacts with the hydroxide ions generated at the cathode according to:| OH− + CO2 → HCO3− | (3) |
| HCO3− + OH− → CO32− + H2O | (4) |
The amount of bicarbonate (or carbonate) produced can be ideally controlled by the amount of carbon dioxide provided to the system but all three ions are likely to be present in solution under equilibrium when an hydroxide-producing catalyst is used. However, with a selective catalyst (e.g., Ca2Ru2O7−y) only carbonate ions can be produced:
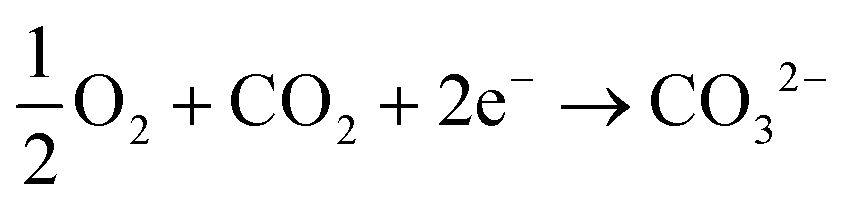 | (5) |
In principle, this approach can be expanded to the use of other catalysts to produce other chemicals such as formate- or oxalate-based salts. The method can be generalized to treat other types of gases at either electrodes leading to a very powerful electrolysis/electrodialysis configuration suited for the simultaneous electro-synthesis of desirable chemicals and purification of input streams.
Fig. 3 shows the results of potentiostatic measurements performed at 3 V for a period of 24 hours. Initial concentrations of sodium sulfate and sodium chloride were provided to the base/acid and saline feed compartments, respectively (Table 2). Fig. 3a shows the increasing trend of the current density (up to 32 mA cm−2) for the 24 hour test period. As in the baseline case (i.e., no CO2), improvements in cell current density are associated with the reduction of the cell's ohmic resistance as the product concentration in the acid and base compartments increases.
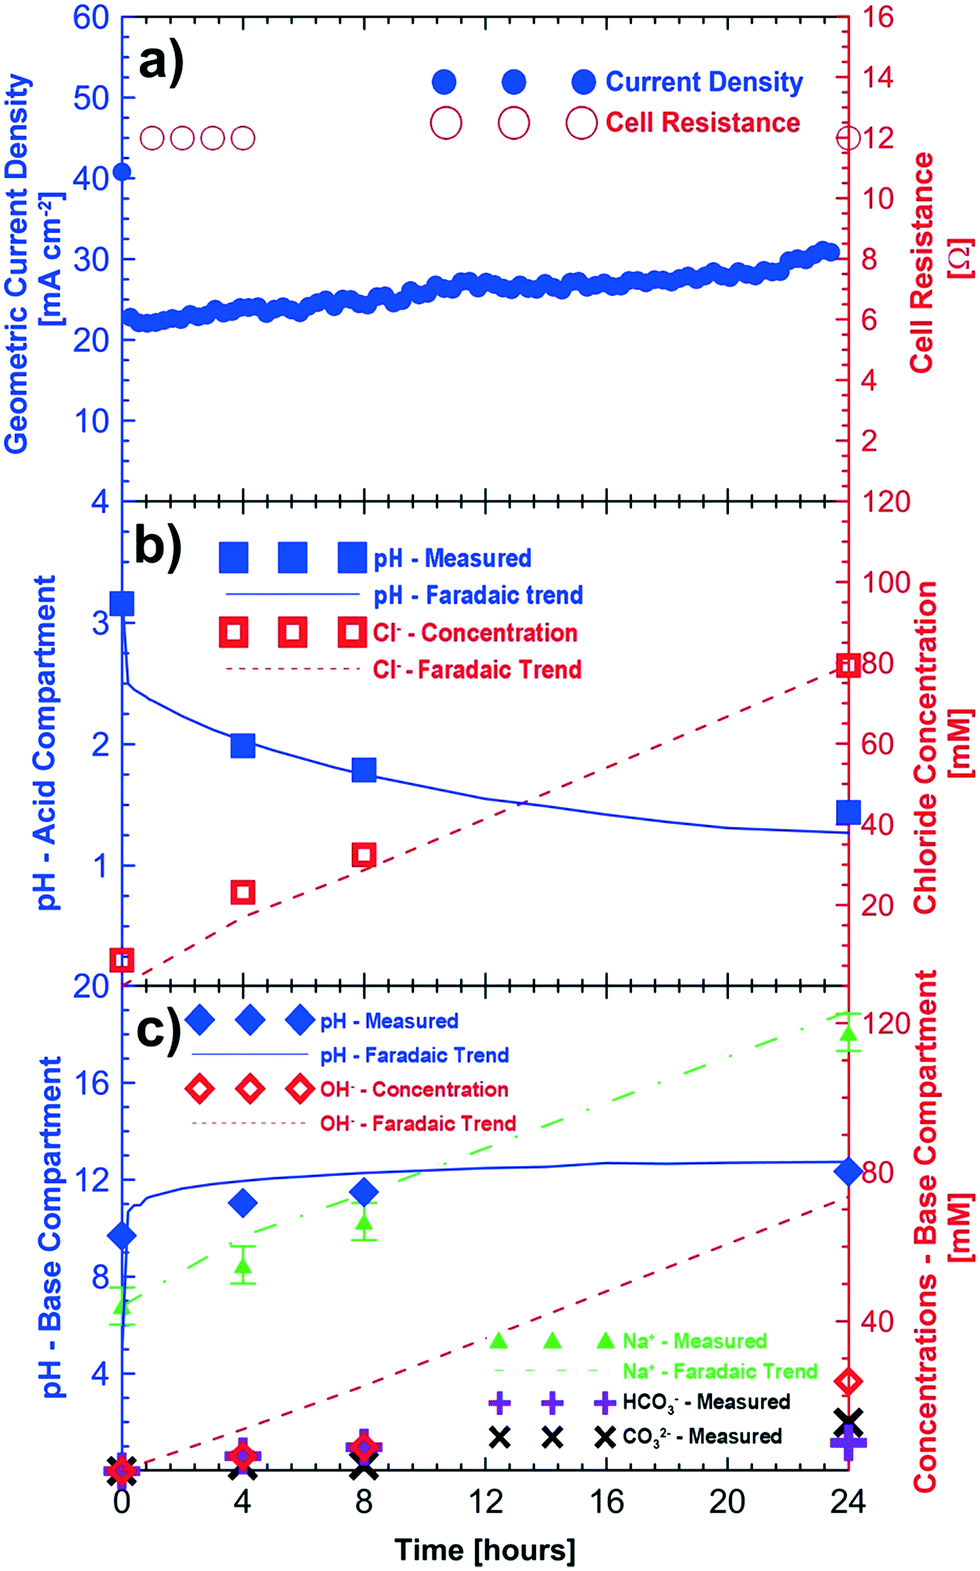 | ||
| Fig. 3 Proof-of-concept testing in a 3.24 cm2 cell with a humidified oxygen and carbon dioxide feed at the cathode; a) current density and cell resistance during the 24 hour testing period; b) changes in pH and chloride ion concentration in the acid compartment c) changes in pH, sodium ion, hydroxide, and carbonate ion concentrations in the base compartment. Cell potential = 3 V, cathode feed = humidified O2/CO2, anode feed = water. | ||
The pH of the acid compartment decreased from an initial value of 3.16 to a final value of 1.44. As in the baseline case (Fig. 2), the overall trend for the pH decrease closely follows that of Faraday's law. However, the final pH (= 1.44) showed a slight deviation from that of the expected value (1.28 ± 0.10). Loss of protons to the saline feed compartment corresponds to 6 mM HCl approximately. Accounting for this loss of acid to the saline compartment would result in an expected pH of the acid compartment of about 1.38, closer to the expected value. Fig. 3b shows the measured and expected amounts of hydrochloric acid in the acid compartment after correcting for proton leakage through the chloride conducting anion exchange membrane.
The sodium ion concentration in the base compartment increased and matched within the variability (±5 mM) of experimentation, sampling and analysis of the test to the expected sodium ion concentration. Fig. 3c shows the measured concentration of the different ions in the base compartment. The base compartment in this experiment is not comprised only of sodium hydroxide but rather a combination of sodium carbonate, bicarbonate and hydroxide solutions. When CO2 is present in the cathodic gas stream, (bi)carbonate ions produced will buffer the base compartment leading to a lower pH than one would expect based on a hydroxide-only pH scale which is shown in Fig. 3c. The base solution consisted of 24 mM of OH−, 7.5 mM of HCO3− and 13 mM of CO32− ions according to titration results after 24 hours. This corresponds to a total monovalent charge of approximately 57.5 mM of anions. The equivalent number of anions would be about 73 mM of anions if all electrons were used in electroreduction of oxygen to OH−. It is likely that some hydroxide and/or (bi)carbonate ions are transported to the saline compartment and subsequently neutralized by the protons as in the baseline case. This corresponds to a cathodic current efficiency of approximately 71% for the 24 hour duration of the experiment.
3.3 Impact of cathode gas composition on production of carbonate and bicarbonate salts
Fig. 4 shows the measured and expected concentrations of different ions after 24 hours of potentiostatic experiments under different cathode gas compositions and cell potentials. In general, the measured chloride concentration in the hydrochloric acid compartment agreed quite well with the expected concentration through Faraday's law. The pH change also agreed well when the correction for proton leakage to the salt compartment was applied. Fig. 4b shows the measured and expected concentrations of the sodium and alkaline anions (hydroxide, bicarbonate and carbonate) in the base compartment. As in the earlier cases, the concentration of the sodium ions is in good agreement with the expected concentrations (i.e., Faradaic concentrations) for the different gas compositions and cell potential experiments studied. On the other hand, the production of the alkaline anions is lower than the expected production. These experiments clearly demonstrate that by tuning the cathodic gas composition (CO2/O2), an excellent control of product concentrations is possible. The chemical reactions between carbon dioxide and hydroxide ions shown in eqn (3) and (4) imply that when excess carbon dioxide is present with respect to hydroxide ions, more bicarbonate ions than carbonate ions are formed. Alternatively, when hydroxide ions are present in excess of carbon dioxide more carbonate ions are produced in solution. This does not generally happen, because some of the hydroxide also transfers across the AEM to the base compartment. However, increasing the carbon dioxide concentration and thus exposing more of the hydroxide to carbon dioxide leads to more hydroxide ions reacting with carbon dioxide. At the higher cell potential of 6 V, a significantly higher ratio of hydroxide is transported across the AEM membrane compared to bicarbonate and carbonate ions. This is most likely due to the higher flux and thus quicker transport of the hydroxide ions at a higher voltage reducing the amount of time available for the hydroxide ion to react with the carbon dioxide to produce bicarbonate and carbonate ions.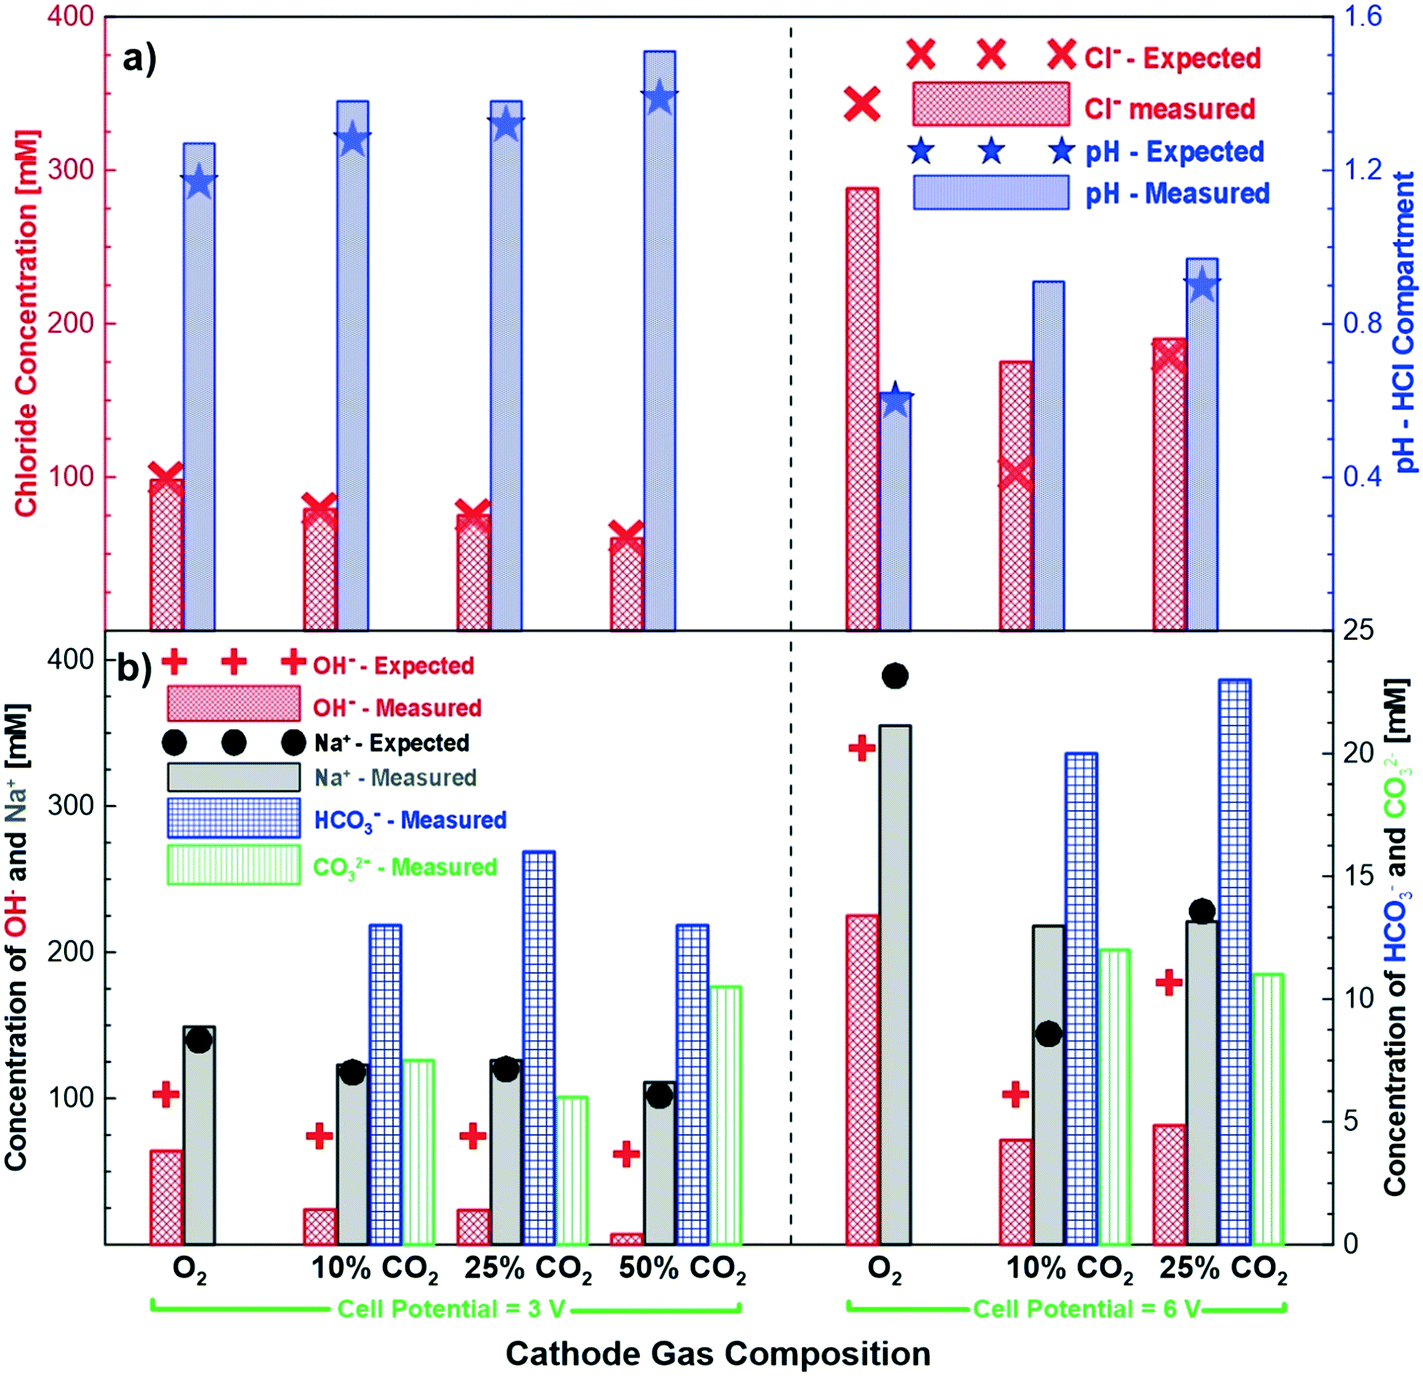 | ||
| Fig. 4 Products of electrolysis experiments summary of chemical concentrations for testing at 3 V and 6 V for different gas compositions after 24 hours of testing; a) difference in expected and measured pH and chloride ion concentration in the acid compartment; b) difference in expected and measured concentration of sodium and alkaline ions in the base compartment. | ||
3.4 Impact of cathode gas composition on cell performance
Fig. 5 shows cell polarizations and potential differences between the neighbouring chambers for a number of different cathode gas compositions. To study the impact of oxygen dilution alone, polarization measurements were performed with nitrogen as well, since nitrogen is inert and does not interact with the hydroxide ions. The potential differences shown in Fig. 5b–d indicate the transport overpotentials associated with relevant ions migrating across a membrane. For instance, EAcid–Esalt (Fig. 5b) represents the potential losses due to transport of Cl− across the anion membrane separating the salt and acid chambers. The reference electrode measurements for the anode and proton transport have been omitted as these ions were found not to affect the performance and are not relevant to the discussions here.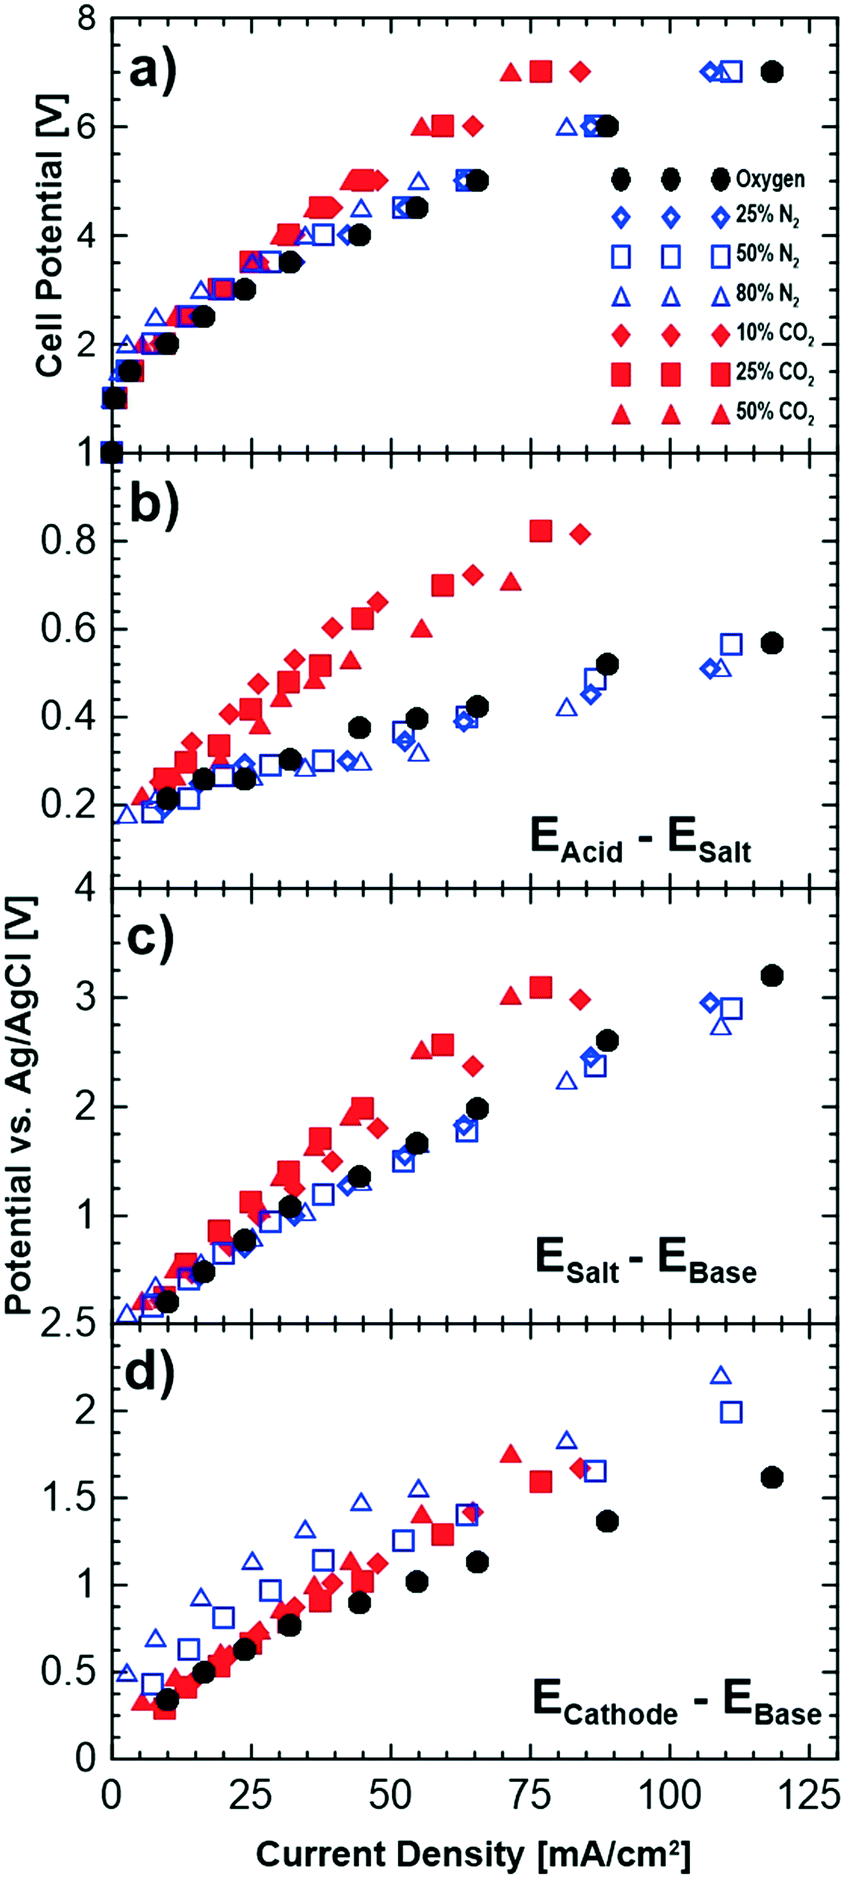 | ||
| Fig. 5 Effect of different cathode compositions on the a) polarization curves of the cell, and potential drops across the b) acid–salt, c) salt–base and d) cathode–base compartments. | ||
Increasing the concentration of nitrogen at the cathode reduces the performance of the cell as shown Fig. 5a by up to approximately 8% at the highest nitrogen concentration. This slight decrease in the performance is due to the reduced partial pressure of oxygen leading to thermodynamic losses related to the Nernst potential (4 mV loss for 50% oxygen partial pressure). A partial evidence for this can be seen in the reference electrode measurements shown in Fig. 5c and d. Fig. 5c shows a slight gain of the potential differences between the salt and base compartment while no changes are observed for the other compartments with pure oxygen and different dilution levels with nitrogen.
Introducing carbon dioxide to the cathode gas leads to larger cell overpotentials than dilution with nitrogen (Fig. 5a). The increase in potentials is observed across both the cathode–base and the base–salt compartments. This implies that the loss in performance is due to both the cathodic losses and transport of the sodium ion from the saline feed to the base compartment. The loss in performance of the cathode can be due to: i) lowered partial pressure of oxygen, ii) poisoning of the catalyst layer by carbon dioxide or iii) lowered mobility of (bi)carbonate ions that are being transported to the base compartment. While lowering of oxygen partial pressure (as observed with introduction of nitrogen) does reduce the cell performance slightly, it is does not account for all the losses observed. CO2 poisoning of the platinum in the catalyst layer is a possibility that could potentially contribute to losses in performance; however, its impact is much lower than CO poisoning. It is worth mentioning that gas chromatograph (GC) measurements showed no presence of produced carbon monoxide.
One likely reason for the cell losses is the lower mobility of the (bi)carbonate ions compared to hydroxide ions. When carbon dioxide is introduced at the cathode, its reduction with hydroxide ions results in the formation of bicarbonate and carbonate ions which will migrate in parallel with the unconverted hydroxide ions to the base compartment. Bicarbonate ions (mobility of 4.59 × 10⁻⁸ m2 s−1 V−1, conductivity of 45 m2 S mol−1) and carbonate ions (mobility of 7.18 × 10⁻⁸ m2 s−1 V−1, conductivity of 139 m2 S mol−1) are less mobile and less conductive (in water at 298 K) than hydroxide ions (mobility of 20.6 m2 s−1 V−1, conductivity of 199 m2 S mol−1) and lead to higher ohmic losses in the membrane conducting these ions. This can also be observed in Fig. 5d where the slope of the reference electrode measurements (voltage vs. current density) increases with increasing carbon dioxide concentration indicating an increase in the resistance of this compartment. Table 3 shows the slopes of the data shown in Fig. 5d obtained by linear regression and normalized by the geometric surface area of the membranes for each of the gas compositions examined. The normalized resistances were higher than pure oxygen when nitrogen was used in the cathode gas feed but did not increase with increasing concentration of nitrogen. However, the normalized slopes increased when carbon dioxide was used, and in addition, increased with increasing carbon dioxide concentration. These results show that the lower mobility and conductivity of (bi)carbonate ions are important factors in the observed increases in the cell potential, in addition to the relatively minor losses due to partial pressure effects.
| Gas composition | Measured slope (mΩ cm2) | ||
|---|---|---|---|
| O2 | CO2 | N2 | |
| 100% | 0 | 0 | 0.011 |
| 90% | 10% | 0 | 0.019 |
| 90% | 0 | 10% | Experiment not performed |
| 75% | 25% | 0 | 0.021 |
| 75% | 0 | 25% | 0.014 |
| 50% | 50% | 0 | 0.023 |
| 50% | 0 | 50% | 0.015 |
| 20% | 80% | 0 | Experiment not performed |
| 20% | 0 | 80% | 0.015 |
While losses in performance at the cathode can be explained due to the introduction of carbon dioxide, the reasons for losses in the voltage performance of the sodium ion are less clear as the carbon dioxide does not interact with the solutions being provided to the saline feed compartment. However, these losses are likely due to the fundamental requirements of charge neutrality related to ionic mobility and the changes in the voltage gradient with a change in potential. In this electrochemical cell, while the compartments are ostensibly independent of each other, changes in ion transport and potential from one compartment to another will indirectly affect the other compartments. Therefore, an increase in the ohmic resistance of the cathode–base compartment, because of the lower mobility/conductivity of the (bi)carbonate ions, and/or an increase in cathode overpotential affects the transport of other ions in the other compartments as well. This can be observed in the increased resistance losses of the saline feed–base compartment (Fig. 5c). In this work we have shown that this coupled transport/potential phenomenon is largely due to the loss of performance for the cathode–base compartment. This effect can be observed, for example, in the data shown in Fig. 5b, where transport of the chloride ions, which do not interact with the (bi)carbonate ions, is also affected.
4. Conclusions
An electrochemical cell that utilizes ion exchange membranes to convert saline water and carbon dioxide to desalinated water and chemicals was demonstrated. The gaseous carbon dioxide was converted by chemically reacting with hydroxide ions produced at the cathode through electrochemical reduction of oxygen or by direct electrochemical reduction of carbon dioxide and oxygen. The produced bicarbonate or carbonate ions along with any unconverted hydroxide ions were transported through an anion exchange membrane where they could combine with transported cations present in the saline water to remove the carbon dioxide as a mineralized species. Anions present in the saline water were combined with protons generated at the anode to produce an acid. Thus, inputs of saline water, carbon dioxide and oxygen, and electricity were converted to desalinated water, a base and an acid.This approach was demonstrated to be technically feasible to produce acids and bases. However, the system was found to have efficiency losses as the produced acid and base were found to have some leakage through the anion and cation exchange membranes, respectively. This issue is exacerbated as higher concentrations of the products are produced, and is likely to limit the ultimate concentration of products that can be produced through this approach. Therefore, the use or development of anion and cation exchange membranes that successfully block proton or hydroxide leakage, respectively, is critical to the success of this approach.
A non-selective platinum catalyst was used to demonstrate the conversion of carbon dioxide to a mineralized species in the form of carbonate and bicarbonate salts by reacting the carbon dioxide chemically with the hydroxide ions produced through electrochemical reduction of oxygen at the gas electrode surface. However, the concept is flexible to the production of other salts of chemicals that can be formed through the reduction of carbon dioxide with different catalysts. These chemicals could, for example, include the production of formate or oxalate salts. Furthermore, the concept can also be used to treat gases other than carbon dioxide to produce other chemicals. These may, for example, include the treatment of nitrous or sulfur oxides to produce nitrate or sulfide based salts. Demonstration of other products from CO2 or treatment of other gases are being considered but they go beyond the scope of the current work.
The approach has been scaled up to a commercial scale pilot reactor and a field demonstration of the approach is planned in the near future. This approach has particularly relevant industrial applications in areas where saline water and waste-gases are present, and where the chemicals and desalinated water produced can be used on-site. The approach is particularly suited for industrial applications such as oil and gas production, mining or treatment of brine rejects. Industries which require desalination and have a need for the produced chemicals would greatly benefit as the costs of water treatment could be offset through the value in the produced chemicals creating an economic incentive for reclamation and re-use of water and utilization of carbon dioxide.
Conflicts of interest
There are no conflicts to declare.Acknowledgements
The authors would like to acknowledge the Pacific Institute for Climate Solutions (PICS), Emissions Reduction Alberta (ERA), Western Economic Diversification (WED) Canada and Natural Science and Engineering Research Council of Canada (NSERC) for funding this research.References
- J. J. Klemes, Curr. Opin. Chem. Eng., 2012, 1, 238–245 CrossRef CAS.
- R. Wasylishen and S. Fulton, in 8th Annual PTAC Spring Water Forum, 2012, p. 11 Search PubMed.
- C. Charcosset, Desalination, 2009, 245, 214–231 CrossRef CAS.
- C. Fritzmann, J. Löwenberg, T. Wintgens and T. Melin, Desalination, 2007, 216, 1–76 CrossRef CAS.
- P. A. Hogan, A. G. Sudjito and G. L. Morrison, Desalination, 1991, 81, 81–90 CrossRef CAS.
- K. W. Lawson and D. R. Lloyd, J. Membr. Sci., 1997, 124, 1–25 CrossRef CAS.
- J. Gebel, in Desalination: Water from Water, ed. J. Kucera, Wiley, 2014, pp. 39–154 Search PubMed.
- S. Veerpaneni, B. Long, S. Freeman and R. Bond, J. - Am. Water Works Assoc., 2014, 99, 95–106 CrossRef.
- A. H. Galama, M. Saakes, H. Bruning, H. H. M. Rijnaarts and J. W. Post, Desalination, 2014, 342, 61–69 CrossRef CAS.
- H. Strathmann, Ullmann's Encycl. Ind. Chem., 2012, pp. 413–456 Search PubMed.
- M. F. A. Goosen, S. S. Sablani, H. Al-Hinai, S. Al-Obeidani, R. Al-Belushi and D. Jackson, Sep. Sci. Technol., 2005, 39, 2261–2297 CrossRef.
- D. M. Warsinger, J. Swaminathan, E. Guillen-Burrieza, H. A. Arafat and J. H. Lienhard V, Desalination, 2015, 356, 294–313 CrossRef CAS.
- M. A. Shannon, P. W. Bohn, M. Elimelech, J. G. Georgiadis, B. J. Mariñas and A. M. Mayes, Nature, 2008, 452, 301–310 CrossRef CAS PubMed.
- C. Faucher and J. Bastien, in 2006 IEEE EIC Climate Change Technology Conference, EICCCC 2006, 2007 Search PubMed.
- J. D. Figueroa, T. Fout, S. Plasynski, H. McIlvried and R. D. Srivastava, Int. J. Greenhouse Gas Control, 2008, 2, 9–20 CrossRef CAS.
- S. Bachu, Prog. Energy Combust. Sci., 2008, 34, 254–273 CrossRef CAS.
- M. Aresta and A. Dibenedetto, Dalton Trans., 2007, 2975–2992 RSC.
- E. Dinjus, Z. Phys. Chem., 1995, 189, 278–279 CrossRef CAS.
- M. Jitaru, J. Univ. Chem. Technol. Metall., 2007, 42, 333–344 CAS.
- S. R. Narayanan, B. Haines, J. Soler and T. I. Valdez, J. Electrochem. Soc., 2011, 158, A167 CrossRef CAS.
- B. Hu, C. Guild and S. L. Suib, J. CO2 Util., 2013, 1, 18–27 CrossRef CAS.
- S. Das and W. M. a. Wan Daud, Renewable Sustainable Energy Rev., 2014, 39, 765–805 CrossRef CAS.
- G. Centi and S. Perathoner, Catal. Today, 2009, 148, 191–205 CrossRef CAS.
- D. N. Huntzinger, J. S. Gierke, L. L. Sutter, S. K. Kawatra and T. C. Eisele, J. Hazard. Mater., 2009, 168, 31–37 CrossRef CAS PubMed.
- K. M. Sheps, M. D. Max, J. P. Osegovic, S. R. Tatro and L. A. Brazel, Energy Procedia, 2009, 1, 4961–4968 CrossRef CAS.
- C. M. White, B. R. Strazisar, E. J. Granite, J. S. Hoffman and H. W. Pennline, J. Air Waste Manage. Assoc., 2003, 53, 645–715 CrossRef CAS.
- K. Z. House, D. P. Schrag, C. F. Harvey and K. S. Lackner, Proc. Natl. Acad. Sci. U. S. A., 2006, 103, 12291–12295 CrossRef CAS PubMed.
- J. M. Nordbotten, M. A. Celia and S. Bachu, Transp. Porous Media, 2005, 58, 339–360 CrossRef CAS.
- A. T. F. S. Gaspar Ravagnani, E. L. Ligero and S. B. Suslick, J. Pet. Sci. Eng., 2009, 65, 129–138 CrossRef CAS.
- T. Xu, J. a. Apps and K. Pruess, Chem. Geol., 2005, 217, 295–318 CrossRef CAS.
- A. A. Olajire, J. Pet. Sci. Eng., 2013, 109, 364–392 CrossRef CAS.
- M. Mun and H. Cho, Energy Procedia, 2013, 37, 6999–7005 CrossRef CAS.
- M. Alvarez-Guerra, S. Quintanilla and A. Irabien, Chem. Eng. J., 2012, 207–208, 278–284 CrossRef CAS.
- A. S. Agarwal, Y. Zhai, D. Hill and N. Sridhar, ChemSusChem, 2011, 4, 1301–1310 CrossRef CAS PubMed.
- K. Subramanian, K. Asokan, D. Jeevarathinam and M. Chandrasekaran, J. Appl. Electrochem., 2007, 37, 255–260 CrossRef CAS.
- C. Oloman and H. Li, ChemSusChem, 2008, 1, 385–391 CrossRef CAS PubMed.
- B. R. Eggins, E. M. Brown, E. A. McNeill and J. Grimshaw, Tetrahedron Lett., 1988, 29, 945–948 CrossRef CAS.
- K. Ogura, J. CO2 Util., 2013, 1, 43–49 CrossRef CAS.
- K. P. Kuhl, T. Hatsukade, E. R. Cave, D. N. Abram, J. Kibsgaard and T. F. Jaramillo, J. Am. Chem. Soc., 2014, 136, 14107–14113 CrossRef CAS PubMed.
- E. E. Benson, C. P. Kubiak, A. J. Sathrum and J. M. Smieja, Chem. Soc. Rev., 2009, 38, 89–99 RSC.
- J. Albo, M. Alvarez-Guerra, P. Castaño and A. Irabien, Green Chem., 2015, 17, 2304–2324 RSC.
- E. J. Dufek, T. E. Lister and M. E. McIlwain, J. Appl. Electrochem., 2011, 41, 623–631 CrossRef CAS.
- J. A. Vega, N. Spinner, M. Catanese and W. E. Mustain, J. Electrochem. Soc., 2012, 159, B19–B24 CAS.
- S. Dara, M. Lindstrom, J. English, A. Bonakdarpour, B. Wetton and D. P. Wilkinson, J. CO2 Util., 2017, 19, 177–184 CrossRef CAS.
- G. H. Jeffery, J. Bassett, J. Mendham and R. C. Denney, Vogel's Textbook of Quantitative Chemical Analysis, New York, 5th edn, 1989, p. 696 Search PubMed.
| This journal is © The Royal Society of Chemistry 2019 |