 Open Access Article
Peptide conformation and oligomerization characteristics of surface-mediated assemblies revealed by molecular dynamics simulations and scanning tunneling microscopy†
Yimin Zou‡
ab,
Bin Tu‡a,
Lanlan Yuac,
Yongfang Zhengac,
Yuchen Linab,
Wendi Luoa,
Yanlian Yang*a,
Qiaojun Fang*a and
Chen Wang *a
*a
aCAS Key Laboratory of Biological Effects of Nanomaterials and Nanosafety, CAS Key Laboratory of Standardization and Measurement for Nanotechnoloty of Nanomaterials and Nanosafety, CAS Center for Excellence in Nanoscience, CAS Center for Excellence in Brain Science, National Center for Nanoscience and Technology, Beijing 100190, P. R. China. E-mail: wangch@nanoctr.cn; fangqj@nanoctr.cn; yangyl@nanoctr.cn
bSino-Danish Center for Education and Research, University of Chinese Academy of Sciences, Beijing, 100190, P. R. China
cDepartment of Chemistry, Tsinghua University, Beijing, 100084, P. R. China
First published on 13th December 2019
Abstract
The characteristics of peptide conformations in both solution and surface-bound states, using poly-glycine as a model structure, are analyzed by using molecular dynamics (MD) simulations. The clustering analysis revealed significant linearization effect on the peptide conformations as a result of adsorption to surface, accompanied by varied adsorption kinetics and energetics. Depending on the inter-peptide interaction characteristics, distinctively different surface-mediated oligomerization modalities, such as antiparallel conformations, can be identified in MD and confirmed by scanning tunneling microscopy (STM) analysis of the assembly structures. These observations are beneficial for obtaining molecular insights of assembling propensity relating to peptide-surface and peptide–peptide interactions.
Introduction
The molecular mechanisms of surface-mediated adsorption and assembling of peptides are inherently associated with the fundamental understanding of peptide-surface and peptide–peptide interactions. The importance of this area of research may be related to a range of extensively pursued themes such as neurodegenerative diseases.1 The reported experimental and theoretical efforts have greatly advanced the insights of structural, thermodynamics as well as kinetics of the peptide adsorption and assembling processes on surfaces.2–4 The molecular level structural analysis by ultrahigh vacuum (UHV) and ambient scanning tunneling microscopy (STM) studies revealed notable effects of conformation, sequence, composition and so on in the peptide adsorption and assembling process.5–10 It has also been suggested that the assembly structures are sensitive to the chemical nature of side chains, such as electrostatic charge, hydrophobicity and hydrophilicity,11 site specific mutations,12 phosphorylation,12 and glycosylation13 of peptides.Considering the vast complexity of chemical and structural diversity of peptide, it can be anticipated that structural analytical efforts will be essential towards rigorous clarification of the principles underlying peptide adsorption and assembling on surfaces and interfaces. It is plausible to consider that the diverse chemical and structure of the amino acid side chains will be critical to the peptide adsorption and assembly mechanisms. In order to better clarify the side-chain related contributions, one may consider that the adsorption and assembling characteristics of peptides with various side-chain effects should be performed. Such efforts could provide necessary support to full-fledged analyses of molecular mechanisms of surface-bound peptide structures.
In this work, poly-glycine peptides with varying length are studied as model structures to explore the conformational and oligomerization characteristics by using molecular dynamic (MD) simulations and STM working under ambient conditions. Glycine has only one hydrogen atom as the side chain moiety and therefore main-chain related effects will become pronounced. The clustering analysis of MD simulation results revealed significant linearization of peptide conformations upon adsorption from solution to the surface of highly oriented pyrolytic graphite (HOPG). The backbone conformation and the structural stability can be predominantly attributed to the main chains of peptides. Different oligomerization modalities, such as antiparallel conformations, are also observed in MD analysis and confirmed by STM observations of peptide assembly structures on HOPG surface.
Experiment and method
Sample preparation
Synthetic peptides were purchased from Bankpeptide Biological Technology Co., Ltd. with purity of >98%. The 4Bpy molecule was purchased from Sigma-Aldrich Co., Ltd. All materials were used without any further purification.Lyophilized powders of peptides were dissolved in Milli-Q water at a concentration of ca. 1 mg mL−1 and then diluted to 0.001 mg mL−1. Solid powders of 4Bpy were dissolved with Milli-Q water to a concentration of 2 mg mL−1. The peptide solution was mixed with an equivalent volume of 2 mg mL−1 4Bpy aqueous solution and put under vortex movement for 20 s, incubated for 10 min. A drop of the mixed solution (ca. 10 μL) was deposited onto the surface of the freshly cleaved highly oriented pyrolytic graphite (HOPG, grade ZYB, NTMDT, Russia) followed by air drying at room temperature. STM experiments were performed after the water was evaporated from the HOPG surface.
STM experiments
All STM experiments were performed with a Nanoscope IIIa scanning probe microscopy system (Bruker, USA) in constant-current mode, under ambient conditions. The ambient temperature is around 298 K. The sharp STM tips were prepared with mechanically formed Pt/Ir (80/20). Detailed tunneling conditions are described in the corresponding figure captions. STM experiments were repeated using different tips and samples to ensure reproducibility.Statistical method
The lengths of the peptide strands were measured from the corresponding STM images with the Gwyddion Software (Version 2.31, Czech Metrology Institute, Czech Republic). Based on previous studies,6,8,11,14 the length increment of 0.325 nm for each residue was assumed in the statistical histograms of peptide length distributions. The proportions of peptides occupying a given length are based on the corresponding frequency counts. Statistical histograms were fitted by a Gaussian distribution.Molecular dynamics
Molecular dynamics simulations were conducted using the Amber 16 package with the ff99SB force field.15DFT calculation
Theoretical calculations were performed using DFT-D scheme provided by DMol3 code.20 We used the periodic boundary conditions (PBC) to describe the 2D periodic structure on the graphite in this work. The Perdew–Burke–Ernzerhof parameterization of the local exchange correlation energy was applied in local spin density approximation (LSDA) to describe exchange and correlation. All-electron spin-unrestricted Kohn–Sham wave functions were expanded in a local atomic orbital basis. For the large system, the numerical basis set was applied. All calculations were all-electron ones, and performed with the medium mesh. Self-consistent field procedure was done with a convergence criterion of 10−5 au on the energy and electron density. Combined with the experimental data, we have optimized the unit cell parameters and the geometry of the adsorbates in the unit cell. When the energy and density convergence criterion are reached, we could obtain the optimized parameters and the interaction energy between adsorbates. To evaluate the interaction between the adsorbates and HOPG, we design the model system. In our work, adsorbates consist of π-conjugated benzene-ring. Since adsorption of benzene on graphite and graphene should be very similar, we have performed our calculations on infinite graphene monolayers using PBC. In the superlattice, graphene layers were separated by 35 Å in the normal direction. When modeling the adsorbates on graphene, we used graphene supercells and sampled the Brillouin zone by a 1 × 1 × 1 k-point mesh.Result and discussion
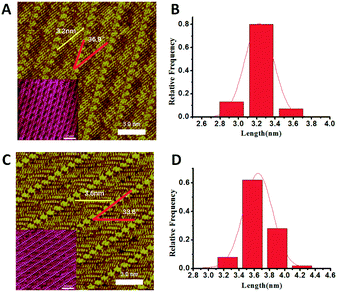
Poly-glycine peptides with five, six and eight, representative of both even and odd numbers of amino acids, are studied as model structures to explore the conformational and oligomerization characteristics. The peptide assembly structures have been examined by STM working under ambient conditions. Similar to previous studies, 4,4′-dipyridyl (4Bpy) molecule was introduced to co-assembly with the peptides. The nitrogen atoms of 4Bpy molecules could form hydrogen bonds with the carboxyl groups of poly-glycine chains. The introduction of the 4Bpy molecules which co-assembled with the polypeptides can anchor the C-terminal of peptides to enable length measurement of stably adsorbed segment. The hydrogen bond interaction between 4Bpy molecules and C-terminus has been verified by variable-temperature Fourier transform infrared spectroscopy (FTIR).21A representative STM observation is shown in Fig. 1A of the co-assembly of pentapeptide of glycine (G5) and 4Bpy displaying a sandwich-like striped structure. The arrays of bright features are the 4Bpy molecules for the relatively high local electron density of their pyridyl groups with conjugated π-electron.22 The lamellae with reduced contrast between two 4Bpy arrays are the G5 peptides with linear conformations. As the red lines in Fig. 1A shows, the angle between the 4Bpy lines and the G5 strands is 36.9 ± 1.4°. The measured angle is determined by the hydrogen bonds between 4Bpy molecules and polypeptide main chains. The separation between two adjacent peptide strands is around 0.47 nm which is within the interaction range of hydrogen bond. These assembly characteristics are consistent with the previously reported studies of various peptide assemblies, such as PolyQ11 and 4Bpy co-assembly,23,24 where FTIR technique verified the β-sheet structures. The following molecular dynamics simulation of peptide assembly also proves the existence of hydrogen bonds.
The observed length of peptides can be measured from the carboxyl terminal anchored by 4Bpy molecules. Fig. 1B shows the histograms of the measured peptide lengths of G5 from the STM image, indicating the adsorbed peptide lengths are around 2.9–3.6 nm which can be estimated as 9–11 residues (calculated by the residue interval of 0.325 nm (ref. 4)). In addition, the main peak is around 3.2 nm, which corresponds to 10 residues. G5 consists of five glycine, therefore the strand between the two 4Bpy molecule lines has two fully extended G5 peptides with a head to head linear conformation. In the surface-mediated adsorption and assembly of G5, the peptide has only one dominant conformation, namely, the whole chain is fully extended linearly on the surface without loop and tail segments.
In the case of hexapeptide G6 which is composed of six glycine. Similar co-assembly structures can be observed (Fig. 1C). The length statistics indicates the adsorbed peptide lengths are around 3.2–4.2 nm which corresponds to 10–13 residues. And the histogram shows that there are two main peaks at 3.6 nm and 3.9 nm, with 3.6 nm the most which corresponds to 11 residues. The length is more than six residues which means that two G6 peptides lie linearly in each strand between the 4Bpy molecules. Moreover, the length here is shorter than two fully extended G6 peptides which is 3.9 nm. So, the explanation is that a fraction of G6 are not fully extended on the surface. In the surface assembly of G6, the peptide could adopt two main conformations: either the whole chain is extended on the surface, or only five residues are stably adsorbed. With the increasing of peptide length, the tail conformation appears. While, the adsorption and assembly of peptide is tightly enough, the main chain of peptide shows a certain structural persistence, loop conformation is never observed. The parity effect in the observed length histograms for G5 and G6 peptides can be attributed to the previously reported odd–even effects.25 The additional STM observations of poly-glycine peptides with different length are provided in supplement information. The results show a nearly same assembly structure when the peptide chain is longer than six glycine residues.
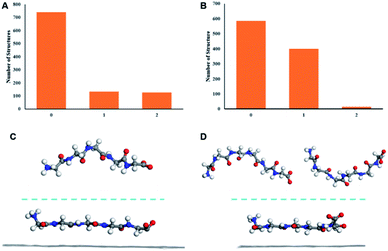
MD simulations were conducted to elucidate the molecular mechanism underlying the adsorption of peptide from solution to HOPG surface and subsequent formation of assembly structures observed by STM. The solvent is water which is the same as the STM experiment. The current study is intended to pursue the linearization effect of peptides from solution phase to the surface adsorption. Solvent-dependent effects may be pronounced in peptides with heterogeneous sequences containing both hydrophilic and hydrophobic amino acids.26 The use of polyglycines with homogeneous residues can eliminate such complexity. First, the conformations of G5 and G6 in solution were simulated by MD. The clustering result shows that in solution, peptide G5 mostly adopts one conformation while G6 has two main conformations (Fig. 2A and B). The MD results are in line with the STM statistical results. The conformation distribution characteristics in solution are qualitatively consistent with that of length distributions in surface-bound assemblies in which the G5 has a single dominant conformation while as the number of glycine increases to 6, the conformations become diverse. In addition, the major clustered centeral structures of G5 and G6 in solution (top half in Fig. 2C and D) show the curving backbones compared to the surface-bound states shown in the bottom half of Fig. 2C and D, when the peptides are exclusively adsorbed linearly on the HOPG surface. This observation is a manifestation of linearization propensity of peptide conformations from the solution to the surface-bound states.
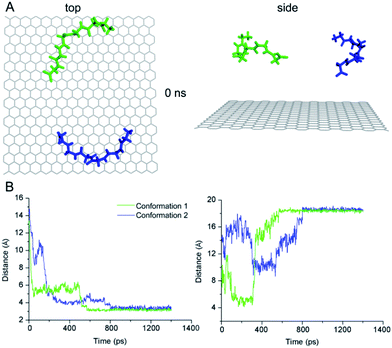
To further elucidate the conformation-dependence of adsorption characteristics, we conducted two independent MD simulations for the conformation of G6 adsorbing on graphite surface. We chose the central structures of the two clusters which are the most probable conformations from previous G6 MD simulations (Fig. 3A) as the initial structures. The graphite sheet with a size of 3.5 nm × 3.5 nm was aligned along with x–y plane and positioned at the bottom of the simulation box. The peptide G6 was placed on top of the graphite sheet with a minimum distance of approximately 1.4 nm and the axis of the G6 chain was roughly parallel to the basal plane. The peptide-graphite system was solvated in a 3.5 nm × 3.5 nm × 4.0 nm TIP3P water box. The position of graphite sheet was fixed during the MD simulations which go on for 20 ns.
We utilized the distance between the centroid of G6 and graphite surface as well as that between the first and last Cα atoms of the G6 peptide as a function of time to characterize the kinetic process of the G6 adsorption with two different initial conformations in the MD simulations. The results reveal the two peptide conformations achieving the steady state in two different processes with different time of 0.6 ns and 0.8 ns (Fig. 3B).
Such differences in time-dependence of conformational variations suggest that adsorption kinetics and energetics of the two peptide conformations may be different that could lead to varied adsorption characteristics as demonstrated in a range of molecular assembly processes.27 These preliminary results from the MD simulations have suggested that diversity of the conformation and adsorption kinetics of G6 are supportive to the STM observations of G6 assemblies showing more than one probable adsorption length distribution, in contrast to the single most probable adsorption peptide length for G5 assemblies.
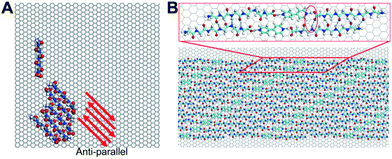
The oligomerization characteristics of surface-bound peptides, which are keen to the formation of peptide assemblies observed by STM, are also pursued by MD simulations and DFT calculations. We firstly examined the oligomerization of six pristine G6 without 4Bpy and with parallel conformations in their initial states. The result is exhibited in Video S1 in ESI.† It can be clearly observed that although the peptide oligomers start with a parallel conformation, the constituent peptides disassembled quickly on the graphite surface. Finally, the peptides reassembled in an anti-parallel conformation with hydrogen bonds (Fig. 4A). A careful examination of the entire surface-mediated oligomerization process reveals that strong hydrogen bond interactions between N and C terminus (amino and carboxyl terminus) provide the dominant driving force for the formation of energetically favoured anti-parallel conformations. This observation demonstrates that dominant interactions, or “hot-spot” interactions, between peptides could have great influence to the oligomerization and assembly conformations on surface.
To understand the self-assembly of poly-glycine with 4Bpy as observed by STM shown previously. We first conducted DFT calculations for the optimized molecular model on the basis of experimental lattice parameters of G6 (Fig. 4B). As shown in the model, 4Bpy molecules interact with carboxyl groups of the peptides by the hydrogen bonds. As a result, the above-described dominant interactions between N and C terminus are no-longer effective, and the optimized molecular model based on experimental STM image do not support the formation of anti-parallel conformations as for the pristine peptides. Instead, the peptides and the 4Bpy molecules co-assembly in parallel conformations (Fig. 4B). For the whole system, the total energy is −196.546 kcal mol−1, including −124.232 kcal mol−1 for interactions among adsorbates and −72.314 kcal mol−1 for interactions between adsorbates and HOPG surface. Therefore, the interactions between molecules play a more important role in current case. This observation is indicative that introduction of the co-assembly molecules 4Bpy have a pronounced impact on the conformations of peptide assemblies, in agreement with the reported STM experiments.28 It may be plausibly suggested that phase separation effect for aromatic 4Bpy molecules and chain-like peptides may account for the formation of lamellae structures in the current STM observations as shown in Fig. 1. The similar phase separation effect has been reported in a number of previous observations.22,29,30 The interactions between the terminal groups could greatly affect the assembly and even the crystal structure of the peptide. The modulation of the terminal group interaction can change the conformation of the peptide and thus change physicochemical properties.31 Combining the result of MD simulations, STM observations and DFT calculations, it can be concluded that the inter-peptide interaction characteristics have great influence to the conformations of both peptide oligomers and assemblies on surfaces.
Conclusions
In summary, we investigated the representative conformation and oligomerization characteristics leading to surface-mediated peptide assembly structures in the model structures of poly-glycine peptides. The MD simulation revealed conformational transition from the solution phase to a linearized surface adsorption state. The time- and conformation-dependence of adsorption kinetics and energetics were also illustrated which may contribute to varied adsorption characteristics in peptide assembly processes. The results are considered helpful to elucidate the impact of peptide conformation and oligomerization in the formation of surface-mediated peptide assembly structures.Conflicts of interest
There are no conflicts to declare.Acknowledgements
This work was supported by the National Basic Research Program of China (2009CB930100, 2011CB932800) and Chinese Academy of Sciences (KJCX2-YW-M15). Financial support from National Natural Science Foundation of China (20911130229 and 20973043) is also gratefully acknowledged.References
- F. Chiti and C. M. Dobson, Annu. Rev. Biochem., 2006, 75, 333–366 CrossRef CAS PubMed.
- S. R. Whaley, D. S. English, E. L. Hu, P. F. Barbara and A. M. Belcher, Nature, 2000, 405, 665–668 CrossRef CAS PubMed.
- S. M. Barlow, S. Haq and R. Raval, Langmuir, 2001, 17, 3292–3300 CrossRef CAS.
- L. Pauling and R. B. Corey, Proc. Natl. Acad. Sci. U. S. A., 1953, 39, 253–256 CrossRef CAS PubMed.
- G. Tomba, M. Lingenfelder, G. Costantini, K. Kern, F. Klappenberger, J. V. Barth, L. C. Ciacchi and A. De Vita, J. Phys. Chem. A, 2007, 111, 12740–12748 CrossRef CAS PubMed.
- X. Ma, L. Liu, X. Mao, L. Niu, K. Deng, W. Wu, Y. Li, Y. Yang and C. Wang, J. Mol. Biol., 2009, 388, 894–901 CrossRef CAS PubMed.
- N. Kalashnyk, J. T. Nielsen, E. H. Nielsen, T. Skrydstrup, D. E. Otzen, E. Laegsgaard, C. Wang, F. Besenbacher, N. C. Nielsen and T. R. Linderoth, ACS Nano, 2012, 6, 6882–6889 CrossRef CAS PubMed.
- X. Mao, Y. Guo, Y. Luo, L. Niu, L. Liu, X. Ma, H. Wang, Y. Yang, G. Wei and C. Wang, J. Am. Chem. Soc., 2013, 135, 2181–2187 CrossRef CAS PubMed.
- S. A. Claridge, J. C. Thomas, M. A. Silverman, J. J. Schwartz, Y. Yang, C. Wang and P. S. Weiss, J. Am. Chem. Soc., 2013, 135, 18528–18535 CrossRef CAS PubMed.
- S. Abb, L. Harnau, R. Gutzler, S. Rauschenbach and K. Kern, Nat. Commun., 2016, 7, 10335 CrossRef CAS PubMed.
- Y. Guo, J. Hou, X. Zhang, Y. Yang and C. Wang, ChemPhysChem, 2017, 18, 926–934 CrossRef CAS PubMed.
- M. Xu, L. Zhu, J. Liu, Y. Yang, J. Y. Wu and C. Wang, J. Struct. Biol., 2013, 181, 11–16 CrossRef CAS PubMed.
- L. L. Yu, Z. Y. Sun, Y. Yu, F. Y. Qu, Y. L. Yang, Y. M. Li and C. Wang, J. Phys. Chem. C, 2016, 120, 6577–6582 CrossRef CAS.
- X. B. Mao, C. X. Wang, X. K. Wu, X. J. Ma, L. Liu, L. Zhang, L. Niu, Y. Y. Guo, D. H. Li, Y. L. Yang and C. Wang, Proc. Natl. Acad. Sci. U. S. A., 2011, 108, 19605–19610 CrossRef CAS PubMed.
- V. Hornak, R. Abel, A. Okur, B. Strockbine, A. Roitberg and C. Simmerling, Proteins, 2006, 65, 712–725 CrossRef CAS PubMed.
- H. J. Feldman and C. W. Hogue, Proteins, 2000, 39, 112–131 CrossRef CAS.
- D. R. Roe and T. E. Cheatham, J. Chem. Theory Comput., 2013, 9, 3084–3095 CrossRef CAS PubMed.
- A. V. Finkelstein, A. Y. Badretdinov and A. M. Gutin, Proteins, 1995, 23, 142–150 CrossRef CAS PubMed.
- J. Y. Shao, S. W. Tanner, N. Thompson and T. E. Cheatham, J. Chem. Theory Comput., 2007, 3, 2312–2334 CrossRef CAS PubMed.
- J. P. Perdew, K. Burke and M. Ernzerhof, Phys. Rev. Lett., 1996, 77(18), 3865–3868 CrossRef CAS PubMed.
- X. J. Ma, Y. T. Shen, K. Deng, H. Tang, S. B. Lei, C. Wang, Y. L. Yang and X. Z. Feng, J. Mater. Chem., 2007, 17, 4699–4704 RSC.
- B. Xu, S. X. Yin, C. Wang, Q. D. Zeng, X. H. Qiu and C. L. Bai, Surf. Interface Anal., 2001, 32, 245–247 CrossRef CAS.
- Y. Yu, Y. Yang and C. Wang, ChemPhysChem, 2015, 16, 2995–2999 CrossRef CAS PubMed.
- Y. Yu, J. F. Hou, L. L. Yu, Y. L. Yang and C. Wang, Surf. Sci., 2016, 649, 34–38 CrossRef CAS.
- Y. Guo, C. Wang, J. Hou, A. Yang, X. Zhang, Y. Wang, M. Zhang, Y. Yang and C. Wang, Chin. J. Chem., 2012, 30, 1987–1991 CrossRef CAS.
- R. Walgers, T. C. Lee and A. C. Goodwin, J. Am. Chem. Soc., 1998, 120, 5073–5079 CrossRef CAS.
- U. Mazur and K. W. Hipps, Chem. Commun., 2015, 51, 4737–4749 RSC.
- L. Niu, L. Liu, M. Xu, J. Cramer, K. V. Gothelf, M. Dong, F. Besenbacher, Q. Zeng, Y. Yang and C. Wang, Chem. Commun., 2014, 50, 8923–8926 RSC.
- S. B. Lei, C. Wang, S. X. Yin and C. L. Bai, J. Phys. Chem. B, 2001, 105, 12272–12277 CrossRef CAS.
- X. Qiu, C. Wang, S. Yin, Q. Zeng, B. Xu and C. Bai, J. Phys. Chem. B, 2000, 104, 3570–3574 CrossRef CAS.
- S. A. Raspopopv and T. B. McMahon, J. Mass Spectrom., 2005, 40, 1536–1545 CrossRef PubMed.
Footnotes |
| † Electronic supplementary information (ESI) available: STM observations of poly-glycine peptides with different length, clustering data of G8, videos of assembly. See DOI: 10.1039/c9ra09320f |
| ‡ These authors contribute equally. |
| This journal is © The Royal Society of Chemistry 2019 |


