 Open Access Article
A study of TiO2 nanocrystal growth and environmental remediation capability of TiO2/CNC nanocomposites
Chengbo Zhana,
Yanxiang Lib,
Priyanka R. Sharma a,
Hongrui Hea,
Sunil K. Sharmaa,
Ruifu Wanga and
Benjamin S. Hsiao
 *a
*a
aDepartment of Chemistry, Stony Brook University, Stony Brook, NY 11794-3400, USA. E-mail: benjamin.hsiao@stonybrook.edu; Tel: +1-631-632-7793
bCAS Key Laboratory of Green Process and Engineering, Institute of Process Engineering, Chinese Academy of Sciences, Beijing 100190, China
First published on 6th December 2019
Abstract
Nanocellulose, which can be derived from any cellulosic biomass, has emerged as an appealing nanoscale scaffold to develop inorganic–organic nanocomposites for a wide range of applications. In this study, titanium dioxide (TiO2) nanocrystals were synthesized in the cellulose nanocrystal (CNC) scaffold using a simple approach, i.e., hydrolysis of a titanium oxysulfate precursor in a CNC suspension at low temperature. The resulting TiO2 nanoparticles exhibited a narrow size range between 3 and 5 nm, uniformly distributed on and strongly adhered to the CNC surface. The structure of the resulting nanocomposite was evaluated by transmission electron microscopy (TEM) and X-ray diffraction (XRD) methods. The growth mechanism of TiO2 nanocrystals in the CNC scaffold was also investigated by solution small-angle X-ray scattering (SAXS), where the results suggested the mineralization process could be described by the Lifshitz–Slyozov–Wagner theory for Ostwald ripening. The demonstrated TiO2/CNC nanocomposite system exhibited excellent performance in dye degradation and antibacterial activity, suitable for a wide range of environmental remediation applications.
Introduction
Recently, nanocellulose has attracted a great deal of research interest as it represents a class of low-cost and renewable nanomaterials that can be derived from any cellulose-containing plant (cellulose is the most abundant biopolymer on earth). Nanocellulose is intrinsically nontoxic, biocompatible and sustainable. The different extraction methods, involving varying chemical and mechanical treatments, can result in different nanocellulose morphology, such as a rod-like shape with larger cross-sectional dimensions and shorter length, and a ribbon-like shape with smaller cross-sectional dimensions and longer length.1–3 In this study, we selected the rod-like nanocellulose, i.e., cellulose nanocrystals (CNCs), as the scaffolding material. CNCs generally have an average cross-sectional dimension about 10 nm and a length between 50 and 1000 nm, high aspect ratio and high surface-area-to-volume ratio.4,5 They are produced by sulfuric acid hydrolysis of cellulose, which introduces sulfate groups on the cellulose surface and thus stabilizes the CNC dispersion at high concentration.6 As most amorphous regions are dissolved under the strong acidic conditions, CNCs are mainly composed of crystalline segments so they possess excellent mechanical strength and chemical stability. As a result, CNCs have been utilized as reinforcing agents for fabrication of polymer nanocomposites.7–9 In general, nanocellulose can be functionalized by a wide range of surface modification schemes, which convert the hydroxyl groups into different functional groups, such as sulfate or carboxyl groups. The resulting nanocellulose can be used as aerogel, adsorbent and sensor scaffolds10–21 in many advanced applications including energy, biomedical, water remediation, catalysis and 3-D printing.22–24Nanoscale titanium dioxide (TiO2) has also drawn intense research interests in the past decade since it is an efficient photocatalyst. Aside from the photocatalytic activity, TiO2 nanomaterials have the advantages of being nontoxic, environmentally friendly and abundant in nature. As a result, they have been widely used in applications such as functional coating, photovoltaics, energy storage and water purification.25–31 In specific, TiO2 nanomaterials are very suitable for sterilization and can degrade a wide range of organic pollutants, including dyes, pesticides and phenolic compounds.32–35 However, despite these qualities, there are also problems associated with the usage of TiO2 nanomaterials, especially nanoparticles in treating water. One problem is the agglomeration of nanoparticles under the complexed physical and chemical conditions in wastewater.36–38 The formation of aggregates can greatly decrease the total surface area and the catalytic efficiency. Another problem is the possibility of creating secondary contamination due to the release of nanoparticles into the environment.39–41 The removal of released nanoparticles often requires the use of energy intensive filtration methods such as ultrafiltration membranes.42,43 One approach that can simultaneously resolve the above problems is by creating dispersed TiO2 nanoparticles that are securely anchored in a porous scaffold, where high catalytic activity can be maintained and secondary contamination can also be minimized. This motivation inspired us to develop a simple method to prepare a nanocomposite system containing TiO2 nanoparticles and porous nanocellulose scaffold.24,44–47
It is well known that the colloidal behavior of CNC in suspension can self-assemble into the nematic phase above a critical concentration.48 As a result, CNC can be used to produce birefringent films or as a template to create inorganic iridescent mesoporous silica, carbon or titania films.49–53 It has been shown that the hydroxyl groups on the cellulose surface are responsible for the nucleation of TiO2 crystals.54 Our recent study indicated that the negative charged groups, such as sulfate groups, on the CNC surface, could limit the TiO2 crystal growth by lowering the surface energy, and thus control the crystal dimension in the nanoscale.55 Therefore, CNC can work as an ideal scaffold to prepare nanocomposite with non-aggregated and TiO2 nanoparticles. In this study, a simple approach involving the hydrolysis of titanium oxysulfate precursor in a CNC suspension at low temperature was used to synthesize the TiO2/CNC nanocomposites. The growth of TiO2 nanocrystals was monitored by the solution small-angle X-ray scattering (SAXS) technique, where the results showed that the crystal growth mechanism could be described by the Lifshitz–Slyozov–Wagner theory for Ostwald ripening. Furthermore, the average size of the TiO2 nanocrystals was confirmed by transmission electron microscopy (TEM) and found to be below 5 nm, indicating the uniform dispersion of TiO2 nanoparticles in the CNC scaffold. The photocatalysis performance of the TiO2/CNC nanocomposite was evaluated by dye degradation and antibacterial activity tests under UV irradiation, and the system demonstrated excellent potential for environmental remediation applications.
Experimental
Materials
Titanium oxysulfate (TiOSO4, 15 wt% aqueous solution) was purchased from Sigma Aldrich. Cellulose nanocrystals (CNCs) slurry (11 wt%) was purchased from University of Maine. Methylene blue was obtained from Alfa Aesar. All materials were used without further purification.Synthesis of TiO2/CNC nanocomposites
The chosen synthetic scheme was as follows. A CNC suspension (25 mL, 0.2 wt%) was first heated to 70 °C, and TiOSO4 solution (200 μL, 15 wt%) was subsequently added dropwise. The mixture was kept stirring for 3 h until white solid was formed. The product was collected after centrifugation and washed by deionized (DI) water for 3 times. A small part of the products was resuspended in water for TEM and solution SAXS characterization, and the rest was freeze-dried for further characterization and application tests. Aliquots at 1 min, 3 min, 5 min, and 10 min were taken for solution SAXS experiments. The schematic diagram of the TiO2/CNC nanocomposite synthesis is shown in Fig. 1.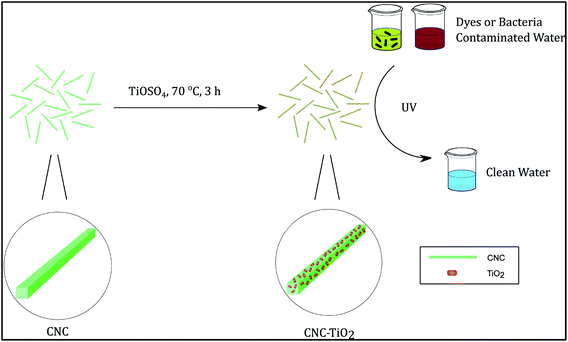 | ||
| Fig. 1 The schematic diagram of the TiO2/CNC nanocomposite synthesis. After reaction, nanosized TiO2 particles were grown on the surface of CNC. | ||
Thermogravimetric analysis (TGA)
TGA was performed by a Q50 thermogravimetric analyzer (TA Instruments, New Castle, DE). In this test, CNC and TiO2/CNC samples were loaded on the platinum pan and then heated up from 25 °C to 800 °C at a heating rate of 10 °C min−1 under the dry N2 environment. The weight loss (%) of the samples was recorded as a function of temperature.X-ray diffraction (XRD)
XRD was performed using a Rikagu Ultima III X-ray diffractometer with Cu Kα radiation. In this measurement, the sample was spread on an amorphous glass slide and placed in the diffractometer. The diffraction data from 5° to 50° (2θ) was collected at a step increment of 0.05° using a scanning rate of 2° per minute. The Scherrer equation (eqn (1)) was used to estimate the crystallite size of the TiO2 nanocrystals with the following expression:
 | (1) |
Electron microscopy
Scanning electron microscopy (SEM) experiment was performed by a Crossbeam 340 instrument (Carl Zeiss Microscopy, Thornwood, NY) equipped with the energy dispersive spectroscopy (EDS, X-Max 50, Oxford Instruments, Concord, MA) capability. In this measurement, the TiO2/CNC powder sample was loaded onto the sample holder using a piece of carbon tape. SEM images were obtained using the SE detector at 3 kV of EHT (extra high tension), where elemental mappings were collected at 20 kV of EHT. Transmission electron microscopy (TEM) experiment was carried out by a JEOL 1400 instrument. In the typical TEM sample preparation, 2 μL of TiO2/CNC suspension at 0.01 wt% was deposited on a 300-mesh copper grid with carbon film coating. For the cryo TEM measurement (using a FEI Vitrobot instrument), a 0.1 wt% TiO2/CNC suspension was loaded onto a 300-mesh copper grid with lacey carbon. The TEM images were acquired using a Gatan 626 single tilt liquid nitrogen cryo-transfer holder.Solution small-angle X-ray scattering (SAXS)
Solution SAXS measurements of CNC and TiO2/CNC suspensions (0.2 wt%) collected at different reaction times during synthesis were carried out at the LiX beamline in National Synchrotron Light Source II (NSLS-II), Brookhaven National Laboratory (BNL). The chosen X-ray wavelength was 1.14 Å and a PILATUS R 1M detector was used to collect the SAXS data (the sample-to-detector was 3.62 m). In addition, two PILATUS R 300K detectors were placed at 0.308 m and 1.20 m, respectively, to collect the wide-angle X-ray diffraction (WAXD) data. A liquid sample holder containing a 1 mm slit opening with the mica window was used to hold the suspension sample. In the X-ray measurement, 40 μL of suspension was used, where the sample was continuously driven back and forth through the capillary by a syringe pump to minimize the radiation damage during data collection. The SAXS scattering angle was calibrated by using a silver behenate standard. In each scattering measurement, five 3 s scans were taken, and any outlier was removed before these profiles were averaged. The raw experimental data was treated by the Python-based software developed at the LiX beamline. In this treatment, dead pixels and beam-stop were masked and raw 2D images were converted into 1D scattering profiles. Subsequently, SAXS and WAXD data from 3 detectors were merged into one scattering profile, where the background was subsequently subtracted. The Lorentz-corrected plot was obtained by plotting the Iq2 vs. q profile (where I and q stand for the scattered intensity and the scattering vector, respectively). The peak positions found in this plot were converted into distances in real space according to Bragg's Law as shown in eqn (2):
 | (2) |
The growth kinetics analysis TiO2 nanoparticles
The Liftshitz–Slyozov–Wagner (LSW) theory was used to describe the growth kinetics of TiO2 nanoparticles in the TiO2/CNC nanocomposite system.56 The LSW theory assumes that as the diffusion length is much greater than the particle radius, the growth of the nanoparticles can be controlled by the diffusion rate according to the rate law as demonstrated in eqn (3):
 | (3) |
 | (4) |
In the above equation, γ is the interfacial energy, D is the diffusion constant, Vm is the molar volume of the solid phase, C∞ is the equilibrium concentration at a flat surface, R is the gas constant and T is the temperature.
UV-visible spectroscopy
The UV-Vis spectroscopy of the TiO2/CNC suspension was collected by the ThermoFisher Genesys™ 10S UV-Vis Spectrophotometer. In this test, 1 mL of the suspension sample was added to a cuvette and the absorbance was measured with over the 300–800 nm range or at a single point.Photodegradation of organic dye test
Methylene blue (MB) was chosen as a model dye to evaluate the photoactivity of TiO2/CNC nanocomposites. In the photodegradation test, 10 mL of 0.1 wt% TiO2/CNC suspension was added to 5 mL of 20 mg L−1 MB solution. The mixture was subsequently placed into an Electro-Lite corporation ELC-500 UV curing chamber and irradiated for 3 h. After centrifugation, the precipitate was collected and added to 15 mL of 6.67 mg L−1 MB solution for the next cycle evaluation, where the absorbance at 665 nm (absorbance peak of MB) of the supernatant was measured to determine the end concentration of MB. The percentage of MB degraded was calculated using the following expression (eqn (5)):
 | (5) |
Bacterial inactivation test
E. coli K12-strain cultured in the lysogeny broth (LB) media was used to test the antibacterial activity of TiO2/CNC nanocomposites. In a typical test, the suspensions contained 5 × 10³ to 104 CFU mL−1 of bacteria and 0.1 wt% of the testing materials (i.e., CNC, TiO2/CNC suspension, and TiO2/CNC powder) were first placed in an Electro-Lite Corporation ELC-500 UV curing chamber and irradiated for 30 min. Afterward, 0.1 mL of the aliquot was taken and spread on an LB plate, where the plate was placed into an incubator at 37 °C for 24 h. The final concentration of bacteria was determined by counting the number of colonies.Release evaluation of TiO2 nanoparticles
In this test, two samples: 1.0 mg of TiO2/CNC and 1.0 mg of TiO2 nanoparticles were wrapped separately in a piece of Kimwipe paper, and they were immersed in a 1 ppm Ti solution for 24 h. The pH level of all the samples was adjusted to 3, 7 and 11 by HCl and NaOH, if necessary. The final Ti concentration of the suspension was determined by Inductively Coupled Plasma Mass Spectrometry (ICP-MS) method.Results and discussion
Synthesis and characterization of TiO2/CNC nanocomposites
Titanium oxysulfate is a widely used precursor that can decompose into TiO2 crystals after thermal treatment. In this work, it was chosen for two reasons: (1) nanoscale TiO2 crystals can be prepared in a mild condition (3 hours at 70 °C); (2) the precursor can react in the acidic aqueous environment, which is compatible with the nanocellulose suspension. Prior to the nanocomposite system, the CNC scaffold was investigated by TEM (Fig. 2A), where CNC particles were found to be short rod-like having an average length of about 100 nm. The dispersed CNCs in water were used as a scaffold to host TiO2 nanocrystals. The structure of the TiO2/CNC nanocomposite was evaluated by the cryo-TEM measurement. In this measurement, the suspension was rapidly frozen to maintain the dispersed state of the nanocomposite. A typical cryo-TEM image of TiO2/CNC is illustrated in Fig. 2B, which confirmed the successful development of TiO2 nanocrystals (shown as black dots) in the CNC scaffold.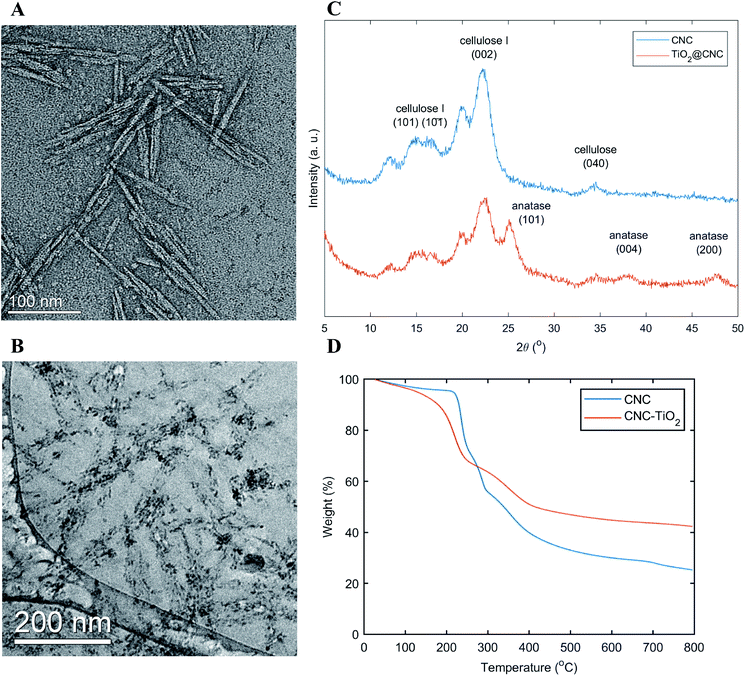 | ||
| Fig. 2 Characterization on CNC and TiO2/CNC nanocomposite. (A) TEM image of CNC; (B) an inset of cryo-TEM image of TiO2/CNC; (C) XRD spectra of CNC and TiO2/CNC; (D) TGA profile of CNC and TiO2/CNC. | ||
The presence of TiO2 nanocrystals was also confirmed by the X-ray diffraction study. The XRD patterns of CNC (the starting material) and TiO2/CNC are illustrated in Fig. 2C, where their major diffractions were also labeled and indexed. It was found that the TiO2/CNC profile exhibited the characteristic peaks of CNC, as well as new peaks from TiO2 crystals. In specific, the newly emerged peaks at 25.1°, 38.2°, 47.5° could be assigned to the anatase phase of TiO2.57
The TiO2 content was determined by the thermogravimetric analysis. The TGA results of CNC and TiO2/CNC are shown in Fig. 2D. In this measurement, the samples were heated from 25 °C to 800 °C under the N2 environment. In TGA profiles, both materials exhibited a continuous weight loss in the temperature range of 200 °C to 650 °C due to the thermal degradation of the organic component.58,59 It was found that at 650 °C, the residual weight of TiO2/CNC was about 21.3% higher than that of CNC, which was very close to the theoretical value of TiO2 (23.1%) based on the amount of CNC used. In other words, the conversion efficiency from the TiOSO4 precursor to TiO2 nanocrystals was very high, so the demonstrated method is quite atom economic. This further suggests that the TiO2 content can be easily controlled by changing the ratio between CNCs and TiOSO4 precursors during the synthesis.
Structure characterization of TiO2/CNC nanocomposites
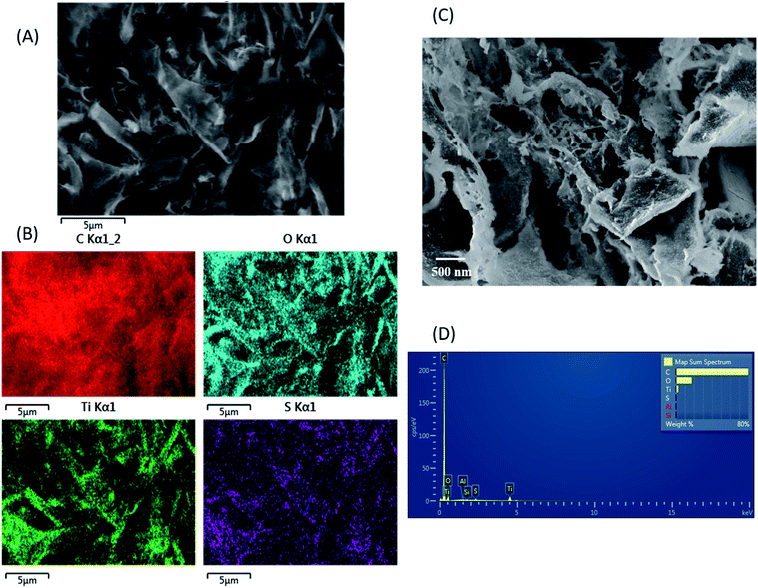
The structure of the TiO2/CNC nanocomposite was characterized the cryo-TEM technique. As seen in Fig. 2B, the black spots represented TiO2 particles as a result of the higher electron density for Ti atoms, where the rod-like CNC scaffold (particles are shown as grey rods) was also identifiable. It was seen that the TiO2 particles were nanoscale and uniformly distributed over the CNC surface. It has been previously demonstrated that the hydroxyl groups on the cellulose surface are responsible for the nucleation of TiO2 crystals.54 However, CNC also contains sulfuric groups on the surface. In a recent study, we demonstrated that the presence of negatively charged sulfuric groups can electrostatically interact with positively charged TiO2 surface, thus resulting in the decrease of surface energy and suppressing the aggregation of TiO2 nanocrystals.60 The size of TiO2 nanocrystals was found to be about 1/3 of the width of CNC particle, and was in the range of 3–4 nm as seen in Fig. 2B. As a comparison, the average crystal size of TiO2 nanoparticles was also estimated from the XRD spectra using the Scherrer's equation. In this analysis, the crystal size was estimated to be 4.1 nm by plugging in the full width at half maximum of the strongest diffraction peak at 25.29° (the 101 plane of the anatase TiO2 phase).61 The XRD result was thus consistent with the TEM confirmation, confirming the TiO2 nanoparticles had the size below 5 nm.Morphology of freeze-dried TiO2/CNC nanocomposite samples was evaluated by SEM, where the typical results are shown in Fig. 3. It was found that the drying process induced aggregation of nanocellulose and the formation of micrometer-size structure (Fig. 3A). The EDS mapping (Fig. 3B) detected the presence of C, O, S (from the sulfuric groups on CNC) and Ti (from TiO2) elements. The results clearly showed a homogeneous distribution of Ti on the CNC surface, which was also consistent with the distribution of the sulfuric groups as discussed earlier. Detailed morphology of TiO2/CNC nanocomposite could be observed in a view of higher magnification (Fig. 3C). Due to the strong capillary force interactions between CNC particles during freeze-drying, the CNC aggregation would take place forming the sheet-like texture commonly seen in the literature.62,63 It was seen that the nanocomposite sample contained a rough surface with small granular texture, where the average granule size is about a few nanometers. These granules were probably indicative of the TiO2 nanoparticles on the CNC surface. From SEM observation, there was no indication of the TiO2 aggregation in freeze-dried TiO2/CNC nanocomposites. The presence was uniformly distributed TiO2 nanoparticles in the CNC scaffold is clearly beneficial for photocatalytic activity.
To estimate the TiO2 growth kinetics in the CNC scaffold, we have evaluated TiO2/CNC nanocomposite samples using the aliquots prepared at varying reaction times: 0.5 h, 1 h, 2 h, 3 h using the regular high-resolution TEM method (cryo-TEM was not carried out due to the difficulty in sample preparation). The results are shown in Fig. 4, where the black dots are recognized as TiO2 nanoparticles and the grey substrates are from the CNC scaffold. In this figure, CNC particles were found to be in tangled bundles rather than individual rods as seen in cryo-TEM images (Fig. 2B), which was a result form the drying step during the TEM sample preparation. It was difficult to obtain quantified information of the TiO2 crystal size from these images as the particle appeared to be in irregular shape and some stacked on top of each other. Although, there was no notable increase in crystal size, a general trend that the TiO2 density was increasing could still be observed. Therefore, it was thought that the formation of the TiO2 crystal is a relatively faster process (<30 min) and a higher time-resolution technique is required to discern the crystal growth.
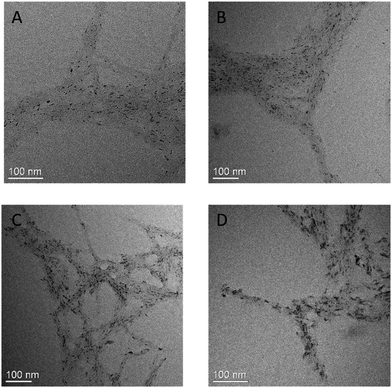 | ||
| Fig. 4 TEM images of TiO2/CNC nanocomposite prepared at varying reaction time: (A) 0.5 h, (B) 1 h, (C) 2 h, (D) 3 h. | ||
Growth evaluation of TiO2 nanocrystal in the CNC scaffold
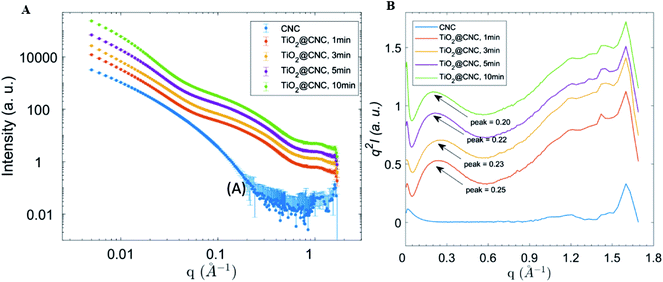
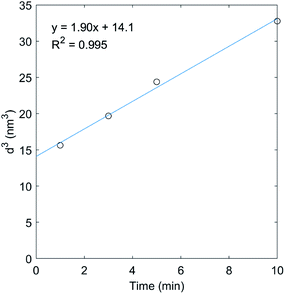
Although electron microscopy is an excellent technique to investigate the structure of TiO2/CNC nanocomposites, it is not suitable to characterize the TiO2 crystal growth within the CNC scaffold in this study for two reasons: (1) resolving the smaller structure of nanoparticle during growth requires higher voltage electron beam, which may damage the organic part (i.e., CNC) of the nanocomposite; (2) due to the limited observation area, it may be difficult to extract statistically significant data from the TEM results. To resolve this issue, the complementary X-ray scattering technique64 was used to extract the structure information of nanocomposite in suspension. For this purpose, aliquots of reaction mixture were taken at 1, 3, 5, and 10 min, respectively, and measured by solution SAXS. The corresponding scattering profiles of CNC and TiO2/CNC suspensions (0.2 wt%) are illustrated in Fig. 5A. From these profiles, it was found that a distinct scattering peak emerged in the mid-q region of the scattering profile, which could be attributed to the formation of TiO2 crystals. To better locate the peak location, Lorentz correction (i.e. Iq2 vs. q plot) was carried out, and the results are shown in Fig. 5B. It was found that as the reaction time increased from 1 min to 10 min, the scattering peak (from TiO2 nanoparticle formation) was shifted from 0.25 Å−1 to 0.20 Å−1. According to the Bragg's Law, the real-space dimension corresponding to these peaks were 2.5 nm, 2.7 nm, 2.9 nm, and 3.2 nm, respectively. These lengths were consistent with the average TiO2 crystal dimension (around 4 nm) of fully developed nanoparticles, as examined by TEM and XRD in this work. Therefore, we argue that the shift of the scattering peak is indicative of the growth of TiO2 nanocrystals. It was found that the peak shift within the first 10 min was relatively fast, whereas the shift became much slower with the increase time. This is consistent with the hypothesis that the presence of sulfuric groups becomes the major factor limiting the size of TiO2 nanocrystals. With increasing time, more TiO2 crystals were developed because of the increase in nucleating density, however, the size of the nanocrystal was regulated by the content and distribution of the sulfuric groups in the CNC scaffold. The relatively broad peak in the Lorentz corrected plot (Fig. 5B) is also consistent with the fact that the scattering profile was the sum of scattered intensities from all particles with different dimensions in the scattering volume, but the breadth of the scattering peak for different intensity profile seemed to be the same.The TiO2 crystal growth results were analyzed by the Lifshitz–Slyozov–Wagner (LSW) theory, which is a mathematical approach to describe the particle coarsening.65 In this approach, the growth of the nanoparticle is assumed to be driven by the equilibrium concentration of the specie at the solid/liquid interface. The small particles are less stable and readily soluble, and the nucleation sites have lower surface energy where the particle species tend to deposit. Therefore, there is a concentration gradient that leads to the transport of particle species. As shown in Fig. 6, the result of the cubic of the TiO2 crystal size over reaction time could be fitted by the LSW model with a very high R-square value. The resulting experimental rate constant was further compared with the theoretical value to check the validity of employing the LSW model. To this end, the diffusion coefficient D of the solvated particles can be expressed by the Stokes–Einstein equation (eqn (6)):
 | (6) |
 | (7) |
It is known that the surface energy of TiO2 is weakly dependent on temperature, whereas for anatase, its surface energy should be in the range of 1.3–1.8 J m−2.66,67 Let us assume the molar volume of anatase is 21.1 cm3 mol−1 (the molar mass of TiO2 (79.866 g mol−1) divided by the density of anatase (3.78 g cm−3)); the solubility of TiO2 in the experimental condition is about 4 × 10−12 to × 10−13 mol L−1 and a is around 0.5 nm;68,69 the Avogadro's constant is 6.02 × 10²³ mol−1; the viscosity of water at 70 °C is 0.4045 mPa s.70 With these parameters, the theoretical constant K can be calculated which is in the range of 8.97 × 10⁻⁴ to 1.24 × 10⁻² nm3 s−1. The measured experimental K value of 3.96 ×10⁻³ nm3 s−1 (the slope 1.90 nm3 min−1 was 8 times of the constant K, so K = slope/8 = 0.238 nm3 min−1 = 3.96 ×10⁻³ nm3 s−1) was within this range.
The results from the LSW fit indicated that the growth of the TiO2 nanoparticles in the TiO2/CNC composites followed the diffusion-controlled mechanism.68,71 We argue that the CNC surface having abundant hydroxyl groups provides the nucleating sites for the nanoparticle growth. The absence of isolated TiO2 nanoparticles indicated that the CNC surface was a very effective nucleating scaffold. The negative charged sulfuric groups on the CNC surface can lower the surface energy by interacting with the positive Ti(OH)3+ species (under slightly acidic conditions), thus limiting the growth of the nanoparticle by creating a minimum surface energy. Notably, this process is relatively fast where the solution SAXS technique has been shown as an effective tool to extract the information about the crystal size during TiO2 formation and provide new insights into the growth mechanism.
In the similar nanocomposite systems, the demonstrated SAXS approach provides a facile way to study the nanoparticle growth mechanism on the soft matter template. Currently, understanding and controlling the growth of nanoparticles in such systems has raised great research interest, and many advanced techniques including in situ microscopy, spectroscopy, and scattering techniques have been utilized for characterization.72–74 Among them, some microscopic tools, such as liquid TEM is the most straightforward way to observe the system and acquire the real space information. However, the experimental setup for such a measurement usually needs to balance the electron beam damage to soft materials and the spatial resolution, where the operations can be intricated.75 The spectroscopic methods are also useful, but they can only be employed to a limited scope of subjects having luminescence or light-emitting properties. The advantages of the solution SAXS technique to study the growth mechanism on the soft matter scaffold, such as in the present system, are several. (1) The sample can be measured in dispersion state during synthesis and the sample preparation is very straightforward. (2) The sample inside the irradiated volume is flowing continuously so the beam damage can be minimized, and a good statistical average can be obtained. (3) The scattered intensity from the inorganic component is much stronger due to the higher electron density so a good scattering contrast can be achieved enabling high instrumentation sensitivity. Therefore, a synergistic combination of the characterization methods abovementioned could lead to a better understanding of the structure and mechanism of the nanocomposite systems.
Photocatalytic, antibacterial activity and stability of TiO2/CNC nanocomposites
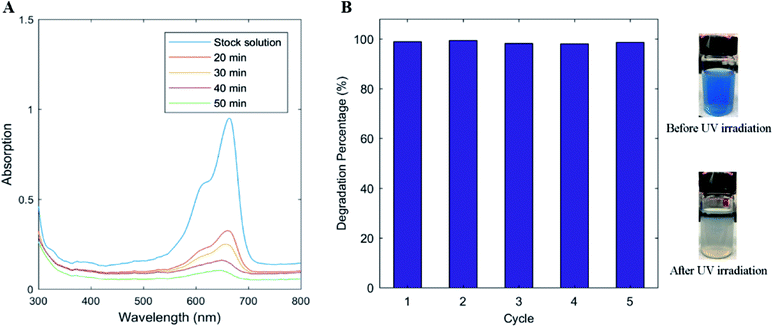
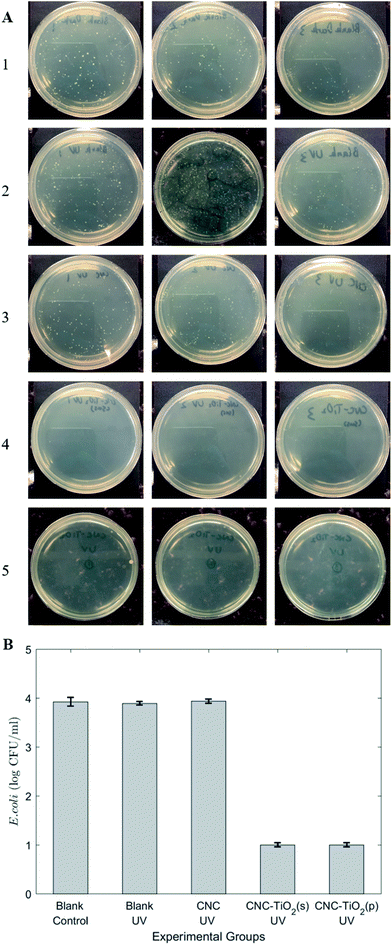
It is well known that the UV photons can excite the electrons in TiO2, which are capable of oxidizing water to generate oxidative hydroxyl free radicals that can subsequently oxidize organic compounds and deactivate bacteria in the water.76 The TiO2/CNC composites were expected to have good photocatalytic activity because the TiO2 particles were present in the nanoscale. To evaluate the ability of TiO2/CNC nanocomposites for water purification applications, two tests were performed: the MB degradation and bacterial inactivation under UV irradiation. In the first test, MB as the model organic dye (MB has characteristic peak at 665 nm in UV-Vis range) can be oxidized by hydroxyl free radicals. The test was carried out in a dynamic mode, where the results are shown in Fig. 7A. It was seen that when the MB solution was mixed with the TiO2/CNC nanocomposites (5 mL of 20 mg L−1 MB solution was mixed with 10 mL of 0.1 wt% TiO2/CNC suspension), a significant decrease in the absorbance at 665 nm was observed with the increasing irradiation time. In another test, the photocatalytic activity of TiO2/CNC nanocomposite to degrade MB in continuous repetitions (5 cycles) was evaluated. The results are shown in Fig. 7B. It was seen that the TiO2/CNC nanocomposites possessed high photocatalytic activity, which was managed to degrade over 98% of the MB dye in solution even in the fifth 5 cycle. Therefore, the TiO2/CNC composites could be a very good candidate for wastewater treatment.TiO2 can be activated by UV-C light to generate oxidative free radicals and deactivate microbes. In this evaluation, E. coli K12 strain was selected as the model bacteria. In the presence of TiO2/CNC nanocomposites, the bacterial concentration in the suspension was found to decrease by 3 orders of magnitude using 30 min of UV radiation (Fig. 8A and B). However, no significant change in the number of bacteria was found in the blank control group (with or without UV) and the experimental groups only having CNC. Therefore, the antibacterial activity of the nanocomposite was clearly resulted from the incorporation of TiO2 nanoparticles. The commercial germicide UV lights usually have a short wavelength (∼254 nm). The results here showed that the presence of TiO2/CNC could effectively deactivate the bacteria in water using mild UV light (wavelength ∼ 400 nm, which could not inhibit the bacteria growth). Therefore, the use of TiO2/CNC nanocomposites can greatly reduce the energy consumption and potential hazards brought by the need for short-wavelength UV light.
Table 1 illustrates the comparison of photocatalytic activities among varying TiO2/nanocellulose composite systems,77–84 including TiO2/CNC in this work. It was found that the demonstrated TiO2/CNC nanocomposite possessed the smallest TiO2 nanoparticles with high efficiency. In this survey, only a few systems had TiO2 nanoparticles smaller than 10 nm, where all systems containing sub 10 nm TiO2 nanocrystals exhibited excellent catalytic performance (i.e., high dye removal and bacteria reduction). We note that the demonstrated TiO2/CNC nanocomposite was prepared by the simple synthesis that is significantly more energy efficient than the hydrothermal method or CVD method.
| TiO2 nanoparticle size | Precursor | Catalytic application | Performance | Ref. |
|---|---|---|---|---|
| 3–4 nm | Ti(SO4)2 | Photodegradation of methyl blue and antibacterial activity | >98% dye removal | This work |
| >99% bacteria reduction | ||||
| 20–40 nm | Ti(SO4)2 (hydrothermal) | Photodegradation of methyl orange | >99% dye removal | 77 |
| 4.3–8.5 nm | Ti(OBu)4 (hydrothermal) | Photodegradation of methyl orange | >99% dye removal | 78 |
| ∼20 nm | Commercial | Antibacterial activity | Up to 87.9% bacteria reduction | 79 |
| ∼200 nm | Ti(OiPr)4 (microwave) | Photodegradation of rhodamine B | 74% dye removal | 80 |
| 12 nm | Commercial | Antibacterial activity | Up to 50% bacteria reduction | 81 |
| <25 nm | Commercial | Degradation of nitrophenols | Up to 88% nitrophenols removal | 82 |
| N/A | Ti(OiPr)4 | Photodegradation of eosin Y | Up to 90% dye removal | 83 |
| Nanotube with 7 nm thickness | CVD | Photodegradation of methyl blue | >99% dye removal | 84 |
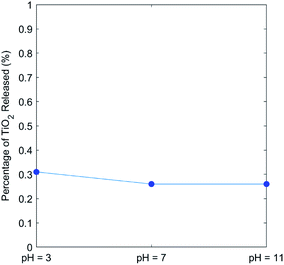
The bonding (adhesion) stability of TiO2 nanoparticles on the CNC scaffold was determined by immersing the TiO2/CNC nanocomposite in water at different pH value for 24 h, where the supernatant was characterized by ICP-MS to determine the Ti concentration. The result is shown in Fig. 9. It was found that there was minimal release of Ti, where the release was almost independent of the pH value. In specific, over the pH range from 3 to 11, the total release of TiO2 in the period of 24 h varied from 0.31% to 0.26%, which was very small. With the fact that TiO2 nanoparticles have low oral toxicity and the reaction time during the photocatalytic tests was much lower than 24 h, this low released amount of TiO2 suggested the TiO2/CNC nanocomposite system is suitable for practical applications.85
When using nanoparticles for water treatment, there are many issues for practical applications. In specific, unbounded nanoparticles are hard to operate and they also have toxicity concerns. In addition, the use of nanoparticles in suspension will usually incur high transportation cost. In this study, the nanosized TiO2 crystals induced by the nanocellulose surface not only can retain the catalytic activity of TiO2, but also minimize the release of TiO2 nanoparticles into water, thus lowering the potential toxicity. Furthermore, the nanocomposite format can greatly facilitate the separation of the treated water and photocatalytic agents, thus minimize any secondary contamination concern.
Conclusions
In this study, a nanocomposite containing TiO2 nanoparticles embedded in the cellulose nanocrystal scaffold was developed and characterized. The synthesis of this nanocomposite was straightforward and can produce a wide range TiO2 content nanocomposite. The TGA results indicated the TiO2 content in the demonstrated nanocomposite (21.3 wt%) was close to the theoretical value (23.1 wt%) and the resulting TiO2 nanocrystal was in the form of anatase as revealed by XRD. The cryo-TEM, high-resolution TEM and SEM/EDS results all indicated that the TiO2 nanocrystals (around 4 nm) were distributed homogeneously on the CNC surface. The formation of TiO2 nanocrystals is due to the presence of negatively charged sulfuric groups on the CNC surface that prevents the aggregation of nanoscale crystals. The growth of TiO2 nanocrystal in CNC suspension was monitored by solution SAXS, where the average crystal size was estimated by the Lorentz-corrected scattering profile. The TiO2 crystal growth results were consistent with the predication of the Lifshitz–Slyozov–Wagner theory, indicating that the CNC surface provided the nucleation sites for TiO2 growth, but the growth process was diffusion-controlled. The resulting TiO2/CNC nanocomposite exhibited excellent environmental remediation properties, based on the methylene blue dye degradation and antibacterial tests. It was found that the TiO2/CNC nanocomposite could degrade >98% of MB under UV irradiation for 5 cycles of testing, and it could also inhibit the bacteria growth by 3 orders of magnitude.Conflicts of interest
No potential conflict of interest was declared by the authors.Acknowledgements
The financial support for this work was provided by a grant from the National Science Foundation (DMR-1808690). We thank Dr Lin Yang and Dr Shirish Chodankar at the LiX beamline in the NSLS-II at BNL. The LiX beamline is operated by a DOE BER contract DE-SC0012704 supported by a NIH-NIGMS grant P41GM111244. This research also used electron microscopy resources in the Center for Functional Nanomaterials at BNL, which is a U.S. DOE Office of Science Facility. The CFN is operated by a DOE contract no. DE-SC0012704. We also thank Dr Chung-Chueh Chang in AERTC at Stony Brook University for his assistance with the TGA and SEM measurements.References
- D. Klemm, F. Kramer, S. Moritz, T. Lindstrom, M. Ankerfors, D. Gray and A. Dorris, Angew. Chem., Int. Ed., 2011, 50, 5438–5466 CrossRef CAS PubMed.
- R. J. Moon, A. Martini, J. Nairn, J. Simonsen and J. Youngblood, Chem. Soc. Rev., 2011, 40, 3941–3994 RSC.
- C. Salas, T. Nypelo, C. Rodriguez-Abreu, C. Carrillo and O. J. Rojas, Curr. Opin. Colloid Interface Sci., 2014, 19, 383–396 CrossRef CAS.
- Y. Habibi, L. A. Lucia and O. J. Rojas, Chem. Rev., 2010, 110, 3479–3500 CrossRef CAS PubMed.
- N. Lin, J. Huang and A. Dufresne, Nanoscale, 2012, 4, 3274–3294 RSC.
- J. F. Revol, H. Bradford, J. Giasson, R. H. Marchessault and D. G. Gray, Int. J. Biol. Macromol., 1992, 14, 170–172 CrossRef CAS PubMed.
- Y. Habibi, Chem. Soc. Rev., 2014, 43, 1519–1542 RSC.
- S. A. Paralikara, J. Simonsen and J. Lombardi, J. Membr. Sci., 2008, 320, 248–258 CrossRef.
- L. Goetz, A. Mathew, K. Oksman, P. Gatenholm and A. J. Ragauskas, Carbohydr. Polym., 2009, 75, 85–89 CrossRef CAS.
- N. Grishkewich, N. Mohammed, J. T. Tang and K. C. Tam, Curr. Opin. Colloid Interface Sci., 2017, 29, 32–45 CrossRef CAS.
- K. Bethke, S. Palantoken, V. Andrei, M. Ross, V. S. Raghuwanshi, F. Kettemann, K. Greis, T. T. K. Ingber, J. B. Stuckrath, S. Valiyaveettil and K. Rademann, Adv. Funct. Mater., 2018, 28, 1800409 CrossRef.
- P. R. Sharma, A. Chattopadhyay, S. K. Sharma, L. H. Geng, N. Amiralian, D. Martin and B. S. Hsiao, ACS Sustainable Chem. Eng., 2018, 6, 3279–3290 CrossRef CAS.
- P. R. Sharma, B. Zheng, S. K. Sharma, C. Zhan, R. Wang, S. R. Bhatia and B. S. Hsiao, ACS Appl. Nano Mater., 2018, 1, 3969–3980 CrossRef CAS.
- P. R. Sharma, R. Joshi, S. K. Sharma and B. S. Hsiao, Biomacromolecules, 2017, 18, 2333–2342 CrossRef CAS PubMed.
- P. R. Sharma and A. J. Varma, Chem. Commun., 2013, 49, 8818–8820 RSC.
- P. R. Sharma, A. Chattopadhyay, S. K. Sharma and B. S. Hsiao, Ind. Eng. Chem. Res., 2017, 56, 13885–13893 CrossRef CAS.
- P. R. Sharma, P. R. Rajamohanan and A. J. Varma, Carbohydr. Polym., 2014, 113, 615–623 CrossRef CAS PubMed.
- P. R. Sharma, A. Chattopadhyay, C. Zhan, S. K. Sharma, L. H. Geng and B. S. Hsiao, Cellulose, 2018, 25, 1961–1973 CrossRef CAS.
- C. Zhan, P. R. Sharma, L. Geng, S. K. Sharma, R. Wang, R. Joshi and B. S. Hsiao, Sci. China: Technol. Sci., 2019, 62, 971–981 CrossRef CAS.
- Y. Habibi, H. Chanzy and M. R. Vignon, Cellulose, 2006, 13, 679–687 CrossRef CAS.
- H. Xie, H. Du, X. Yang and C. Si, Int. J. Polym. Sci., 2018, 2018, 7923068 Search PubMed.
- J. T. Tang, J. Sisler, N. Grishkewich and K. C. Tam, J. Colloid Interface Sci., 2017, 494, 397–409 CrossRef CAS PubMed.
- Y. Xue, Z. H. Mou and H. N. Xiao, Nanoscale, 2017, 9, 14758–14781 RSC.
- M. Kaushik and A. Moores, Green Chem., 2016, 18, 622–637 RSC.
- L. X. Sang, Y. X. Zhao and C. Burda, Chem. Rev., 2014, 114, 9283–9318 CrossRef CAS PubMed.
- R. L. House, N. Y. M. Iha, R. L. Coppo, L. Alibabaei, B. D. Sherman, P. Kang, M. K. Brennaman, P. G. Hoertz and T. J. Meyer, J. Photochem. Photobiol., C, 2015, 25, 32–45 CrossRef CAS.
- N. Wang, C. Chu, X. Xu, Y. Du, J. Yang, Z. Bai and S. Dou, Adv. Energy Mater., 2018, 8, 1801888 CrossRef.
- D. A. Panayotov, A. I. Frenkel and J. R. Morris, ACS Energy Lett., 2017, 2, 1223–1231 CrossRef CAS.
- M. Vasilopoulou, N. Kelaidis, E. Polydorou, A. Soultati, D. Davazoglou, P. Argitis, G. Papadimitropoulos, D. Tsikritzis, S. Kennou and F. Auras, Sci. Rep., 2017, 7, 17839 CrossRef PubMed.
- C. J. Bueno-Alejo, J. L. Hueso, R. Mallada, I. Julian and J. Santamaria, Chem. Eng. J., 2019, 358, 1363–1370 CrossRef CAS.
- P. Pazhamalai, K. Krishnamoorthy, V. K. Mariappan and S.-J. Kim, J. Colloid Interface Sci., 2019, 536, 62–70 CrossRef CAS PubMed.
- K. Nakata and A. Fujishima, J. Photochem. Photobiol., C, 2012, 13, 169–189 CrossRef CAS.
- Y. An, D. J. de Ridder, C. Zhao, K. Schoutteten, J. Vanden Bussche, H. L. Zheng, G. Chen and L. Vanhaecke, Water Sci. Technol., 2016, 73, 2868–2881 CrossRef CAS PubMed.
- S. M. Ilina, P. Ollivier, D. Slomberg, N. Baran, A. Pariat, N. Devau, N. Sani-Kast, M. Scheringer and J. Labille, Environ. Sci.: Nano, 2017, 4, 2055–2065 RSC.
- Y. Sun, Y. He, B. Tang, Z. Wu, C. Tao, J. Ban, L. Jiang and X. Sun, RSC Adv., 2018, 8, 31996–32002 RSC.
- F. Xu, Chemosphere, 2018, 212, 662–677 CrossRef CAS PubMed.
- W. J. G. M. Peijnenburg, M. Baalousha, J. W. Chen, Q. Chaudry, F. Von der kammer, T. A. J. Kuhlbusch, J. Lead, C. Nickel, J. T. K. Quik, M. Renker, Z. Wang and A. A. Koelmans, Crit. Rev. Environ. Sci. Technol., 2015, 45, 2084–2134 CrossRef CAS.
- P. Bansal, A. P. Deshpande and M. G. Basavaraj, J. Colloid Interface Sci., 2017, 492, 92–100 CrossRef CAS PubMed.
- B. Nowack and T. D. Bucheli, Environ. Pollut., 2007, 150, 5–22 CrossRef CAS PubMed.
- K. A. D. Guzman, M. P. Finnegan and J. F. Banfield, Environ. Sci. Technol., 2006, 40, 7688–7693 CrossRef PubMed.
- A. Weir, P. Westerhoff, L. Fabricius, K. Hristovski and N. von Goetz, Environ. Sci. Technol., 2012, 46, 2242–2250 CrossRef CAS PubMed.
- J. P. S. DesOrmeaux, J. D. Winans, S. E. Wayson, T. R. Gaborski, T. S. Khire, C. C. Striemer and J. L. McGrath, Nanoscale, 2014, 6, 10798–10805 RSC.
- Z. Q. Wang, A. G. Wu, L. C. Ciacchi and G. Wei, Nanomaterials, 2018, 8, 65 CrossRef PubMed.
- C. Zhang, M. Zhou, S. Liu, B. Wang, Z. Mao, H. Xu, Y. Zhong, L. Zhang, B. Xu and X. Sui, Carbohydr. Polym., 2018, 191, 17–24 CrossRef CAS PubMed.
- D. Shen, Y. Dai, J. Han, L. Gan, J. Liu and M. Long, Chem. Eng. J., 2018, 332, 563–571 CrossRef CAS.
- K. J. Prathap, Q. Wu, R. T. Olsson and P. Dinér, Org. Lett., 2017, 19, 4746–4749 CrossRef CAS PubMed.
- K. Zhang, M. Shen, H. Liu, S. Shang, D. Wang and H. Liimatainen, Carbohydr. Polym., 2018, 186, 132–139 CrossRef CAS PubMed.
- J. P. Lagerwall, C. Schütz, M. Salajkova, J. Noh, J. H. Park, G. Scalia and L. Bergström, NPG Asia Mater., 2014, 6, e80 CrossRef CAS.
- K. E. Shopsowitz, H. Qi, W. Y. Hamad and M. J. MacLachlan, Nature, 2010, 468, 422–425 CrossRef CAS PubMed.
- K. E. Shopsowitz, J. A. Kelly, W. Y. Hamad and M. J. MacLachlan, Adv. Funct. Mater., 2014, 24, 327–338 CrossRef CAS.
- K. E. Shopsowitz, W. Y. Hamad and M. J. MacLachlan, Angew. Chem., Int. Ed., 2011, 50, 10991–10995 CrossRef CAS PubMed.
- D. Y. Zhang and L. M. Qi, Chem. Commun., 2005, 2735–2737, 10.1039/b501933h.
- A. Ivanova, D. Fattakhova-Rohlfing, B. E. Kayaalp, J. Rathousky and T. Bein, J. Am. Chem. Soc., 2014, 136, 5930–5937 CrossRef CAS PubMed.
- Y. Li, L. Cao, L. Li and C. Yang, J. Hazard. Mater., 2015, 289, 140–148 CrossRef CAS PubMed.
- Y. Li, J. Zhang, C. Zhan, F. Kong, W. Li, C. Yang and B. S. Hsiao, Carbohydr. Polym., 2019 Search PubMed , accepted.
- G. J. Wilson, A. S. Matijasevich, D. R. Mitchell, J. C. Schulz and G. D. Will, Langmuir, 2006, 22, 2016–2027 CrossRef CAS PubMed.
- H. G. Yang, C. H. Sun, S. Z. Qiao, J. Zou, G. Liu, S. C. Smith, H. M. Cheng and G. Q. Lu, Nature, 2008, 453, 638–641 CrossRef CAS PubMed.
- P. R. Sharma and A. J. Varma, Carbohydr. Polym., 2014, 114, 339–343 CrossRef CAS PubMed.
- P. R. Sharma and A. J. Varma, Carbohydr. Polym., 2014, 104, 135–142 CrossRef CAS PubMed.
- J. Z. Y. Li, C. Zhan, F. Kong, W. Li, C. Yang and B. S. Hsiao, Carbohydr. Polym., 2019 Search PubMed , accepted.
- H. P. Klug and L. E. Alexander, X-ray diffraction procedures: for polycrystalline and amorphous materials, Wiley, 1974 Search PubMed.
- X. Feng, X. H. Meng, J. P. Zhao, M. Miao, L. Y. Shi, S. P. Zhang and J. H. Fang, Cellulose, 2015, 22, 1763–1772 CrossRef CAS.
- S. Sultan and A. P. Mathew, Nanoscale, 2018, 10, 4421–4431 RSC.
- I. Pilz, O. Glatter and O. Kratky, in Methods Enzymol, Elsevier, 1979, vol. 61, pp. 148–249 Search PubMed.
- Y. Xia, Y. Xiong, B. Lim and S. E. Skrabalak, Angew. Chem., Int. Ed., 2009, 48, 60–103 CrossRef CAS PubMed.
- C. D. Terwllliger and Y. M. Chiang, J. Am. Ceram. Soc., 1995, 78, 2045–2055 CrossRef.
- D.-P. Song, M.-J. Chen, Y.-C. Liang, C.-Y. Wu, Z.-J. Xie and Q.-S. Bai, Modell. Simul. Mater. Sci. Eng., 2010, 18, 075002 CrossRef.
- G. Oskam, A. Nellore, R. L. Penn and P. C. Searson, J. Phys. Chem. B, 2003, 107, 1734–1738 CrossRef CAS.
- S. Ziemniak, M. Jones and K. Combs, J. Solution Chem., 1993, 22, 601–623 CrossRef CAS.
- J. Kestin, M. Sokolov and W. A. Wakeham, J. Phys. Chem. Ref. Data, 1978, 7, 941–948 CrossRef CAS.
- E. M. Wong, J. E. Bonevich and P. C. Searson, J. Phys. Chem. B, 1998, 102, 7770–7775 CrossRef CAS.
- T. J. Woehl, J. E. Evans, I. Arslan, W. D. Ristenpart and N. D. Browning, ACS Nano, 2012, 6, 8599–8610 CrossRef CAS PubMed.
- L. Qu, W. W. Yu and X. Peng, Nano Lett., 2004, 4, 465–469 CrossRef CAS.
- J. r. Polte, T. T. Ahner, F. Delissen, S. Sokolov, F. Emmerling, A. F. Thünemann and R. Kraehnert, J. Am. Chem. Soc., 2010, 132, 1296–1301 CrossRef CAS PubMed.
- N. De Jonge and F. M. Ross, Nat. Nanotechnol., 2011, 6, 695 CrossRef CAS PubMed.
- T. Leung, C. Chan, C. Hu, J. Yu and P. Wong, Water Res., 2008, 42, 4827–4837 CrossRef CAS PubMed.
- Y. Chen, H. Liu, B. Geng, J. Ru, C. Cheng, Y. Zhao and L. Wang, RSC Adv., 2017, 7, 17279–17288 RSC.
- D. Sun, J. Yang and X. Wang, Nanoscale, 2010, 2, 287–292 RSC.
- N. A. El-Wakil, E. A. Hassan, R. E. Abou-Zeid and A. Dufresne, Carbohydr. Polym., 2015, 124, 337–346 CrossRef CAS PubMed.
- D. Nunes, A. Pimentel, A. Araujo, T. Calmeiro, S. Panigrahi, J. Pinto, P. Barquinha, M. Gama, E. Fortunato and R. Martins, Top. Catal., 2018, 61, 1591–1606 CrossRef CAS.
- E. Lizundia, U. Goikuria, J. L. Vilas, F. Cristofaro, G. Bruni, E. Fortunati, I. Armentano, L. Visai and L. Torre, Biomacromolecules, 2018, 19, 2618–2628 CrossRef CAS PubMed.
- A. B. RanguMagar, B. P. Chhetri, A. Parameswaran-Thankam, F. Watanabe, A. Sinha, J.-W. Kim, V. Saini, A. S. Biris and A. Ghosh, ACS Omega, 2018, 3, 8111–8121 CrossRef CAS PubMed.
- T. Anirudhan and S. Rejeena, J. Mater., 2015, 2015, 636409 Search PubMed.
- M. Kettunen, R. J. Silvennoinen, N. Houbenov, A. Nykanen, J. Ruokolainen, J. Sainio, V. Pore, M. Kemell, M. Ankerfors, T. Lindstrom, M. Ritala, R. H. A. Ras and O. Ikkala, Adv. Funct. Mater., 2011, 21, 510–517 CrossRef CAS.
- H. Shi, R. Magaye, V. Castranova, J. J. P. Zhao and f. toxicology, Part. Fibre Toxicol., 2013, 10, 15 CrossRef CAS PubMed.
| This journal is © The Royal Society of Chemistry 2019 |

