 Open Access Article
Eutectic liquid crystal mixture E7 in nanoporous alumina. Effects of confinement on the thermal and concentration fluctuations†
Aristoula Selevoua,
George Papamokosa,
Tolga Yildirimc,
Hatice Duran c,
Martin Steinhart
 d and
George Floudas
 *ab
*ab
aDepartment of Physics, University of Ioannina, P. O. Box 1186, 451 10 Ioannina, Greece. E-mail: gfloudas@uoi.gr
bUniversity Research Center of Ioannina (URCI), Institute of Materials Science and Computing, Ioannina, Greece
cDepartment of Materials Science & Nanotechnology Engineering, TOBB University of Economics and Technology, Söğütözü Cad. 43, Ankara, 06560, Turkey
dInstitut für Chemie Neuer Materialien, Universität Osnabrück, D-49069 Osnabrück, Germany
First published on 20th November 2019
Abstract
The eutectic mixture of liquid crystals E7 is studied in confinement by means of thermal and dielectric measurements. The uniform 1-D confinement provided by self-ordered nanoporous alumina leads to a decrease in the nematic to isotropic transition temperature due to interaction with the pore surface, e.g. surface anchoring. The prevalence of certain dynamic modes of relaxation is found to depend on the surface properties of the confining pores. The dynamics (i.e., relaxation times) were found to accelerate with increasing confinement, resulting in a decreasing glass temperature, independent of surface treatment. From the pre- and meta-transitional dependence of the dielectric permittivity on temperature we are able to deduce a weakening effect of confinement on the nematic to isotropic (N/I) transition which allows the determination of a critical pore diameter (in the range from 11 nm to 23 nm) below which the transition becomes continuous. Comparison of the N/I transition of E7 to those of its constituent liquid crystals reveals a significantly weaker transition occurring over a widened temperature range. This suggest the importance of concentration fluctuations in rounding first order phase transitions that are triggered by the different length scales and ranges of nematic stability in E7. The results have an impact beyond the present case and for several soft materials (e.g. oligomers used as OLEDs, polymers, colloids) as it demonstrates the importance of concentration fluctuations in addition to thermal fluctuation on the strength of phase transitions.
1 Introduction
The physics of confined soft matter has been extensively studied for a wide array of materials and confining hosts. Rod-like liquid crystals (LCs) are of interest due to their utilization in device fabrication. However, as a significant portion of LCs in technological applications are in contact with hard interfaces,1,2 it is necessary to investigate the effects of geometric confinement on the thermodynamics and dynamics of LCs. Apart from size effects, LCs in confined geometries3–6 are susceptible to surface interactions such as anchoring and density modulations.7,8 Therefore, the director field configuration and, macroscopically, the material's optical and dielectric properties, are directly related to the size of the system as well as the competition of surface effects with the intrinsic elastic forces.E7, in particular, is a liquid crystalline mixture comprised of four hematogenic compounds with non-coinciding nematic ranges. Its usefulness arises from a long range (∼125 K) of nematic stability at temperatures typical for applications. As such, the literature on E7 is widely concerned with composites with other systems, such as polymer dispersions and ferromagnetic nanoparticles. Bulk dynamics of pure E7 have been studied mainly by dielectric spectroscopy exhibiting various modes of dipolar relaxation.9–16 This has also been supplemented by specific heat,9 rheological10 and neutron scattering11 measurements which allow the identification of the molecular process responsible for the dynamics. With respect to the nematic to isotropic (N/I) transition, optical birefringence studies12 have deduced a tricritical dependence of the nematic order parameter on temperature. Furthermore, studies on E7 in the presence of nanometric sized colloidal dispersions13 and a cellulose derivative14 indicated surface induced orientation effects which strengthen the high frequency relaxation mode. In confinement, previous dielectric studies of E7 employed, as confining matrices, either Anopore membranes15 or SBA-type molecular sieves (20 nm in diameter).16 In both hosts, a hindered surface relaxation emerged in addition to the bulk-like modes and confinement impacted the high frequency mode two fold: first, with an acceleration of dynamics and, second, with an increase in fragility as the system approached its glass temperature. However, already in the bulk state, a satisfactory assignment of all exhibited relaxation modes has not been accomplished. In addition, the previously employed confining geometries lacked the uniformity and full range of diameters afforded by self-ordered nanoporous alumina (AAO).17–20 This is necessary if we intend on distinguishing size effects from interactions with a uniform host as well as consistently examining the effect of surface interactions. Lastly, as E7 is a model nematic system, it provides a suitable candidate to examine the impact of confinement on the order of a phase transition (that is clearly of the first kind in the bulk) with implications to the nature of phase transitions in confined soft matter, in general.
In the present work, we investigate the effect of confinement on the thermodynamics and dynamics of the LC mixture E7. Specifically, thermal measurements are used to statically map the temperature ranges of phases exhibited in confinement compared to those in the bulk. Broadband dielectric spectroscopy is employed in the detection of such ranges dynamically and the study of molecular dynamics in confinement, for varying surface conditions. We report a depression and broadening of transition temperatures as well as increased molecular mobility with confinement. Dielectric measurements provide evidence for a weaker N/I transition with decreasing pore size allowing the estimation of a critical pore size below which the transition becomes continuous. Furthermore, a comparison of the N/I transition in E7 and similar alkylcyanobiphenyl molecules indicates a more complex description of the transition for a mixed system as compared to one-component system.
2 Experimental section
Materials and method of infiltration
The investigated liquid crystal was the eutectic mixture E7 (Merck). Self-ordered nanoporous alumina membranes (pore diameters: 25, 35, 65, 200, 400 nm; pore depth 100 μm) were prepared by following the anodization procedures in the literature.17–19 Prior to infiltration, AAO membranes were annealed overnight in a vacuum at 443 K. Infiltration was performed, within the material's isotropic phase at atmospheric pressure, at 343 K and proceeded via capillary action for no more than 6 hours. Following this procedure, samples were brought to ambient temperature and subsequently quenched with liquid nitrogen, and excess E7 was removed from the membrane surfaces with sharp razor blades and soft nonabrasive polishing paper. The difference in membrane mass before and after infiltration is calculated as the mass of the infiltrated sample. Typically, the sample mass was ∼12 mg (400 nm), ∼2.5 mg (200 nm), ∼5.5 mg (65 nm), ∼3 mg (35 nm), ∼2 mg (25 nm). In octadecylphosphonic acid (C18H39O3P; ODPA) modified pores, E7 was spread on the AAO surface modified with (ODPA) at 338 K. The E7 loaded AAO membranes were kept at 343 K for 24 hours under 200 mbar vacuum. The samples were subsequently quenched with liquid nitrogen, and residual E7 was removed from the AAO surfaces with sharp razor blades and soft polishing paper.Surface modificaton with ODPA
Octadecylphosphonic acid was purchased from Alfa Aesar. Self-ordered AAO was activated in 30% aqueous H2O2 solution for 2 h at 45 °C, dried at 120 °C for 15 minutes, and immersed for 48 h at 25 °C into a 4.2 mM solution of ODPA in a n-heptane/isopropanol (v![[thin space (1/6-em)]](https://www.rsc.org/images/entities/char_2009.gif) :
:![[thin space (1/6-em)]](https://www.rsc.org/images/entities/char_2009.gif) v/5
v/5![[thin space (1/6-em)]](https://www.rsc.org/images/entities/char_2009.gif) :
:![[thin space (1/6-em)]](https://www.rsc.org/images/entities/char_2009.gif) 1) solvent mixture. Subsequently, the substrates were washed with copious amounts of n-heptane/isopropanol mixture and acetone for several times and sonicated to remove any physisorbed (not grafted) ODPA. Finally, they were dried under vacuum (200 mbar) at room temperature overnight. Surface modification with phosphonate coupling agents bearing long alkyl chains (typically from 8 to 18C atoms) leads to the formation of monolayers.
1) solvent mixture. Subsequently, the substrates were washed with copious amounts of n-heptane/isopropanol mixture and acetone for several times and sonicated to remove any physisorbed (not grafted) ODPA. Finally, they were dried under vacuum (200 mbar) at room temperature overnight. Surface modification with phosphonate coupling agents bearing long alkyl chains (typically from 8 to 18C atoms) leads to the formation of monolayers.
Surface analysis of ODPA modified AAO membranes
XPS measurements were used to determine if the surfaces of the pores were successfully coated with the ODPA molecule (Fig. S1, ESI†). Thermo Scientific K-Alpha instrument and a 300 W MgKα (1253.6 eV) X-ray source were used for the analysis. The spectrum was taken at an angle of 60° to the surface.Differential scanning calorimetry (DSC)
Thermal analyses were carried out with a Mettler Toledo Star DSC. A 2–12 mg portion of the sample material was placed in aluminum pans that were sealed before the measurements. In the case of bulk E7, empty aluminum pans were used as reference. In the case of AAO infiltrated with E7, native AAO pieces (with the same pore diameter, the same pore depth, and the same pore area) were used as reference samples. Firstly, the sample cooled at a rate of 10 K min−1 from room temperature to 173 K and then heated to 353 K at the same rate in a nitrogen atmosphere. The same cycle was repeated two times and the results from the second heating and cooling thermographs were employed in the analysis of the phase transition (nematic–isotropic) and glass transition temperatures. Temperature-modulated DSC (TM-DSC) was also employed using a Q2000 (TA Instruments) calorimeter (University of Ioannina). Temperature ramps in the vicinity of the N/I transition were performed at a rate of 2 K min−1 with a modulation amplitude A = 0.04 K and period T = 20 s. This allowed for the extraction of the temperature dependent phase shift, δ, between the applied heating rate (source) and heat flow rate (sample).Dielectric spectroscopy
Dielectric measurements were carried out at atmospheric pressure for temperatures T = 215.15–263.15 K and frequencies f = 5 × 10⁻² to 1.1 × 10⁷ Hz using a Novocontrol Alpha frequency analyzer with an active sample head. The complex dielectric permittivity ε* = ε*(ω,T,P) is a function of frequency ω, temperature T, and in general pressure P; it is expressed as a sum of real and imaginary parts, ε* = ε′ − iε′′, corresponding to storage and loss of the external electric field's energy, respectively. For bulk E7, the DS measurements were carried out in the usual parallel plate geometry with electrodes of 20 mm in diameter and a sample thickness of 50 μm maintained by Teflon spacers. For confined E7, an electrode of 10 mm in diameter was placed on top of AAO whereas the aluminum bottom of the AAO templates served as the lower electrode. Care was taken to account for the fact that the system under consideration is a heterogeneous dielectric consisting of a mixture of the confining matrix material (AAO) and the LC whose dynamics are of interest (E7). The measured dielectric spectra were corrected for the geometry by using two capacitors in parallel (composed of and
and  and the measured total impedance was related to the individual values through
  ). In the analysis of DS spectra, the empirical equation of Havriliak and Negami (HN)21
 | (1) |
 | (2) |
Both the measured ε′′ spectra and the derivative of ε′ (dε′/d![[thin space (1/6-em)]](https://www.rsc.org/images/entities/char_2009.gif) ln
ln![[thin space (1/6-em)]](https://www.rsc.org/images/entities/char_2009.gif) ω ∼ −(2/π)ε′′) have been used in fitting relaxation processes which are visible and hidden by the conductivity contribution, respectively.22 In the spectra where more than one relaxation processes contribute to ε*, a summation of HN functions was employed.
ω ∼ −(2/π)ε′′) have been used in fitting relaxation processes which are visible and hidden by the conductivity contribution, respectively.22 In the spectra where more than one relaxation processes contribute to ε*, a summation of HN functions was employed.
Computational methods
Molecules 5CB, 7CB, 8OCB and 5CT were fully optimized with no constraints and tight optimization criteria were employed (RMS force criterion was set to 1 × 10⁻⁵). The UltraFine integration grid for numerical integrations was selected (99-point radial quadrature and 590-point Lebedev angular quadrature) to obtain smooth convergence of the floppy parts of the molecules. Frequency calculations confirmed that stationary points are local minima. The alkyl groups for all molecules were initially set to all trans conformation. The combination of the DFT-B3LYP23,24 level of theory and cc-pVTZ25 basis set were employed which was recently shown to reproduce experimental values of dipole moments with high accuracy.26 For all computations Gaussian 16 (ref. 27) software package was employed.3 Results and discussion
Bulk phase study
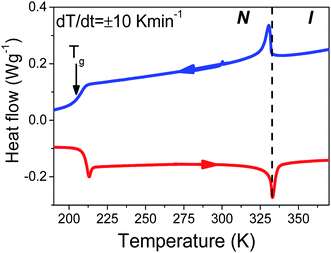
The composition of E7 as well as pertinent physical properties of its constituents are summarized in Table 1, from DFT calculations and literature values.28–33 The dipole moments of all molecules along with the pictorial representation of their optimized structures are also shown in Table 1. For molecules 5CB, 7CB and 5CT the vector of the dipole moment is almost parallel to the aromatic rings and the nitrile bond while the values of the dipole moment lie close to each other: 6.1, 6.2, and 6.4 debye respectively. For molecule 8OCB a greater deviation from parallelicity is observed for the vector of the dipole moment while the value of the dipole moment is 7.3 debye. This difference is attributed to the ether group present in 8OCB.31 The cartesian coordinates of the optimized structures for all molecules are given in the ESI section.†The thermal properties of bulk E7 are concisely depicted in the thermogram of Fig. 1. Cooling and subsequent heating at a rate of 10 K min−1 reveal two distinct features. First, an exo/endo thermic peak on cooling/heating at the N/I transition (at ∼333 K) and, second, a step-like change at the glass temperature (at ∼208 K) (the minor feature at ∼305 K is a baseline feature). Concerning which element of the mixture influences the phase state most, as a first approximation we consider the weighted average of the constituents' TN/I and obtain a trial value of TN/I = 333.8 K. Surprisingly, this estimate is quite close to the actual TN/I. Therefore, we may assume that E7's thermal properties are the composition of those belonging to the individual molecules comprising the mixture. The exceptionally large range of nematic stability can be understood as the inability of the different molecules to form smectic or crystalline phases due to packing constraints imposed by the different length scales of individual components. Furthermore, we may assume that the mixture's molecules retain mobility down to the lowest Tg of the individual components in the mixture. In this case, comparing the observed Tg for E7 with those of 5CB, 7CB and 8OCB, we conclude that the liquid-to-glass temperature is determined largely by 5CB (e.g. the majority component that is also the more mobile).
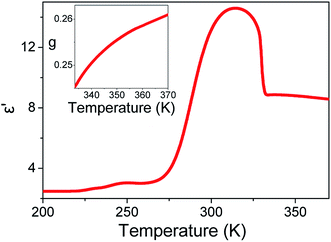
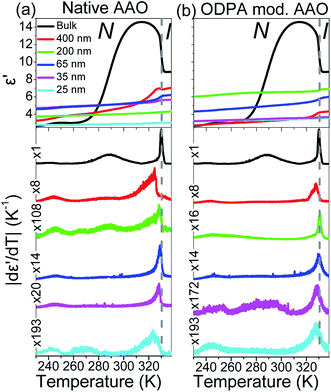
Fig. 2 displays the isochronal (f = 106 Hz) temperature dependence of the dielectric permittivity, ε′, on heating bulk E7 at a rate of dT/dt = 5 K min−1. The N/I transition appears as a discontinuous decrease of the dielectric permittivity at ∼330 K. Upon approaching TN/I, a substantial portion of the bulk nematic phase (∼15 K) exhibits a gradual reduction of ε′ prior to the transition suggesting a large range of pre-transitional fluctuations. Furthermore, within the isotropic phase of bulk E7, we note an almost temperature independent dielectric permittivity. This is contrary to theory which predicts a T−1 orientational contribution to the dielectric permittivity as21,22
 | (3) |
 is the local field, N0/V is the number density of dipoles expressed as (ρ/M)NA, where ρ is the mass density, M is the molar mass and NA is Avogadro's number, μ is the dipole moment of a single independent molecule and g is the dipolar orientation correlation function defined according to Kirkwood and Fröhlich as
 | (4) |
From eqn (3) using the values M = 271.75 g mol−1, ρ = 1.03 g cm−3, μ = 6.3 debye and ε∞ = n2 = 2.59,34 we extract a value of g ∼ 0.25 (inset, Fig. 2). This indicates that the isotropic phase exhibits non-zero dipolar correlations with antiparallel alignment of neighboring dipoles as g < 1. This is consistent with both previous experimental observations35 and simulation results.36 A value of g = 1 would correspond to the case of non-correlated dipoles, therefore, the fact that even as we progress 40 K into the isotropic phase the correlation factor has only increased by 6% towards a hypothetical isotropic value of unity suggests a persistence of dipolar correlations for a substantial fraction of the isotropic phase.
E7 dynamics in the bulk
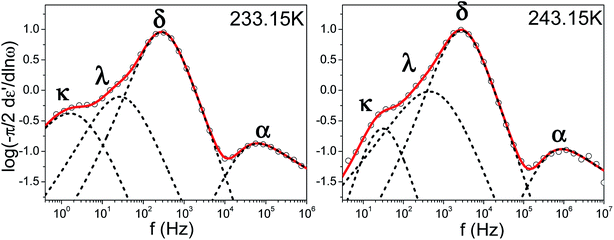
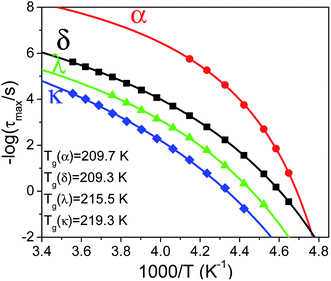
Because of its wide range of nematic stability, E7 lends itself to an exhaustive study of the various relaxation modes of a nematogen. Theoretical models which employ orientational probability distribution functions and take into account only the point symmetry of the nematic phase predict the existence of four dielectrically active relaxation domains.37,38 These are associated with molecules aligned either parallel or perpendicular to the probing field performing end-over-end rotation about the short molecular axis (slow) and precession/nutation about the nematic director or rotation about the long molecular axis (fast). Experimental studies on liquid crystalline dynamics tend to identify two processes termed α-(fast) and δ-(slow) which are well separated within the nematic phase due to the nematic potential which hinders the dynamics of the latter mode.39,40 In the present study isothermal loss spectra of bulk E7 exhibit four modes of dielectric relaxation here labeled as κ, λ, δ and α processes (Fig. 3). The α and δ processes are assigned to molecules aligned parallel to the probing electric field performing precession about the nematic director and reorientation about the short molecular axis, respectively. Similarly, the κ and λ processes are assigned to the same motions but for molecules aligned almost perpendicularly to the electric field. Previous studies have identified the freezing of the α-process as responsible for the LC's glass temperature.9–11 A faster mode associated with the reorientation about the long molecular axis is not dielectrically active.The relaxation times for end-over-end rotational motions (δ and κ processes) can be described by a Debye (m = mn = 1) distribution. Precessional motions about the director (α and λ processes) exhibit a distribution of relaxation times with corresponding HN parameters m = 0.9, mn = 0.5 and m = 0.75, mn = 1, respectively. As these should be the faster relaxation modes, for molecules parallel and almost perpendicular to the probing field, the fact that they do not exhibit a Debye time distribution is indicative of an underlying distribution of angles between the molecules and the external field or nematic director.31 The temperature evolution of all processes in Fig. 3 can be described by a Vogel–Fulcher–Tammann (VFT) dependence as
τ = τ0![[thin space (1/6-em)]](https://www.rsc.org/images/entities/char_2009.gif) eB/(T−T0) eB/(T−T0)
| (5) |
Effect of confinement on phase behavior
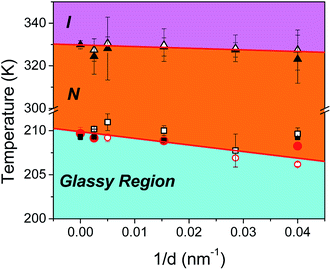
The effect of confinement can be discussed by performing isochronal measurements of the dielectric permittivity. Earlier studies have shown the sensitivity of the ε′(T) dependence to various phase transitions and even to the identification of new phases under confinement.28,31,41 Fig. 5 depicts isochronal (f = 106 Hz) measurements of the dielectric permittivity, ε′, at a rate of 5 K min−1 for bulk and confined E7 within native and ODPA modified AAO. ODPA adsorbed form organic solvents forms stable monolayers on the amorphous surface of AAO pores resulting in hydrophobic low-energy surfaces.42,43 The representation of ε′ is supplemented with its absolute derivative with respect to temperature, |dε′/dT|. This allows greater sensitivity in detecting even weak thermodynamic and dynamic transitions as has been shown earlier by some of us.In regard to the effect of confinement, first we note, upon increasing confinement in both native (Fig. 5(a)) and ODPA modified (Fig. 5(b)) AAO pores, a depression and broadening of TN/I.44 The fact that the step in ε′(T = TN/I) reduces with decreasing pore size is equivalent to the decreasing values of |dε′/dT| (T = TN/I) and indicates a weakening of the transition in confinement. The decrease of TN/I with confinement can be described by a linear dependence versus inverse pore diameter as Tm = Tm∞ − A/d where Tm∞ = 329.8 ± 0.5 K and A = 77 ± 32 nm. This is discussed considering a simplistic model of a nematic in contact with a solid substrate. The effect of the solid substrate is to introduce a perturbation of the nematic ordering, with lengthscales comparable to the molecular length, creating an interface or even an interphase. The presence of adsorbed molecules leads to an increase in surface tension whereas the fixed mean orientation of molecules at the interface (surface anchoring) affects molecules farther away from the surface due to anchoring; molecules arrange in such a conformation that reduces the elastic energy but deforms the equilibrium director field. Therefore, at a given temperature (i.e., only spatially dependent director field) the free energy density includes contributions from elastic (volume) and surface terms.45–47 These two contributions yield a decrease in TN/I which is expressed analytically as
 | (6) |
 | (7) |
Here, Δσ, is the difference in surface tension between the nematic and isotropic phases, ΔH is the enthalpy associated with the transition and ρ the density of the liquid crystal. From eqn (6) considering twist (k22 = 4.5 × 10⁻¹² N) and bend (k33 = 13 × 10−12 N) distortions48 separately, a typical value of S = 0.3 in the nematic phase and a0 = 9 × 10⁴ J m−3 K (ref. 46) yields depressions equal to 0.27 K (R = 400 nm), 70 K (R = 25 nm) and 0.79 K (d = 400 nm), 200 K (d = 25 nm), respectively. From eqn (7) using values TN/I = 333.79 K, Δσ = 0.026 × 10⁻³ N m−1,46 ΔH = 4.78 J g−1 and ρ = 1.03 g cm−3, we obtain depressions equal to 0.017 K (d = 400 nm) and 0.28 K (d = 25 nm). Representative experimental values of ΔT are equal to 5.5 K and 6.8 K in native 400 nm and 25 nm pores, respectively. We may conclude that the depression of TN/I in E7 contains contributions from both elastic distortions and surface tension effects.
Secondly, comparing the form of |dε′/dT| (T = TN/I) in native and ODPA modified AAO, the latter exhibit a broader and more symmetrical shape than the former. This can be understood in light of orientation effects; ODPA induces homeotropic anchoring of molecules at the pore's surface creating a spatially dependent director field. Therefore, material in different parts of the pore is subject to varying boundary conditions, such as surface pinning or intermolecular elastic forces, requiring a larger range of temperatures to undergo the transition. This is consistent with an earlier study of cyanobiphenyls confined to 200 nm Anopore membranes4 where Cp(T = TN/I) peaks exhibited greater depression, broadening and symmetry in radial rather than axial alignment.
Lastly, apart from the N/I transition, we observe low temperature signatures in the |dε′/dT| curves of all samples. These are attributed to resonances of dipolar relaxation (i.e., loss) processes which exhibit maximum losses at a certain temperature when examined at a constant frequency of the external electric field and are subsequently discussed.
Effect of confinement on dynamics
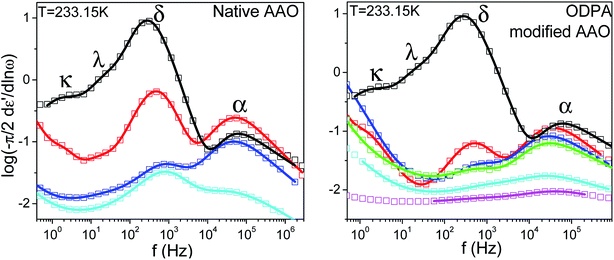
More informative of the dynamic processes exhibited in confined E7 are the isothermal loss spectra in Fig. 6. All confined samples, within native AAO pores, exhibit α and δ processes; λ and κ processes are both seen in 400 nm pores with the former persisting in 65 and 25 nm pores. In ODPA modified pores, α- and δ-processes are evident in addition to the κ process in 400 nm and 200 nm pores and the λ process in 65 nm and 25 nm pores. The existence of at least one κ or λ process is indicative of non-perfect nematic alignment even within the confining matrices. In addition, all spectral modes display broadening of relaxation time distributions with increasing confinement.In fact, the broadening of α- and δ-relaxation time distributions is almost identical for diameters of a specific pore size, irrespective of surface properties, with an exception in the case of 25 nm pores where the low frequency wing of the δ-process is wider than its native counterpart as mnative = 0.85 and mODPA = 0.48. However, already from the low temperature regions in Fig. 5 and from Fig. 6, we observe that E7 confined to ODPA modified pores exhibits a persistent preference for relaxation via the α-process. Oppositely, within native AAO pores, the preferred mode is the δ-process in 400 nm and 25 nm pores versus the α-process in 65 nm pores. Therefore, it is presumed that molecular alignment in native 400 nm and 25 nm pores is axial whereas in 65 nm pores it is planar radial or escaped radial. A similar observation was made in the case of 5CB23 where confinement in native 35 nm and 25 nm pores yielded a preference for α- or δ-dynamics, respectively, concluding that the selection of dynamics in confinement is influenced by size effects which are also in competition with surface induced orientation effects.
We observe that for all confined samples the ratios of TΔε(δ)/TΔε(α) are much smaller than that in the bulk, with values of 1.53, 0.27 and 1.17 in native pores with sizes of 400 nm, 65 nm and 25 nm, respectively, and values 0.32, 0.28, 0.2, 0.6, 0.6 in treated pores with respective sizes of 400 nm, 200 nm, 65 nm, 35 nm and 25 nm. As seen in Fig. 6, this can be attributed to a decrease of Δε(δ) indicating that slow modes are generally less favored in confinement than in the bulk.
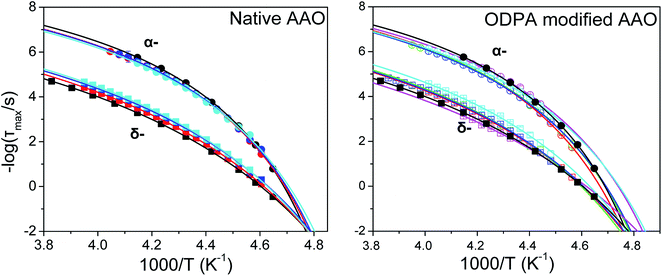
Both α- and δ-modes in confinement exhibit a VFT temperature dependence with similar relaxation times for each separate process in native and modified confinement (Fig. 7). Corresponding fits are performed using a constant τ0 for each process equal to that acquired from the bulk (−log![[thin space (1/6-em)]](https://www.rsc.org/images/entities/char_2009.gif) τ0(α) = 10.4 and −log
τ0(α) = 10.4 and −log![[thin space (1/6-em)]](https://www.rsc.org/images/entities/char_2009.gif) τ0(δ) = 9.7). This arises from the assumption that at the high temperature limit (i.e., well within the isotropic phase) dynamics should be unaffected by confinement. The values of VFT fitting parameters obtained for α- and δ-processes within native and ODPA modified pores are listed in Tables 2 and 3, respectively. We have also included, for both processes and types of pores, the values of the isobaric steepness index defined as49
τ0(δ) = 9.7). This arises from the assumption that at the high temperature limit (i.e., well within the isotropic phase) dynamics should be unaffected by confinement. The values of VFT fitting parameters obtained for α- and δ-processes within native and ODPA modified pores are listed in Tables 2 and 3, respectively. We have also included, for both processes and types of pores, the values of the isobaric steepness index defined as49
m* = [d(log![[thin space (1/6-em)]](https://www.rsc.org/images/entities/char_2009.gif) τ)/d(Tg/T)]Tg τ)/d(Tg/T)]Tg
| (8) |
| Native AAO | α-process | δ-process | ||||||
|---|---|---|---|---|---|---|---|---|
| B (K) | T∞ (K) | Tg (K) | m* | B (K) | T∞ (K) | Tg (K) | m* | |
| Bulk | 546 ± 24 | 190 ± 0.7 | 209.6 ± 0.7 | 136 | 1047 ± 10 | 170.3 ± 0.3 | 209.2 ± 0.3 | 63 |
| 400 nm | 590 ± 3 | 188.5 ± 0.2 | 209.2 ± 0.2 | 126 | 976 ± 1 | 173.1 ± 0.1 | 209.3 ± 0.1 | 67 |
| 65 nm | 597 ± 2 | 188.0 ± 0.2 | 208.9 ± 0.2 | 124 | 932 ± 3 | 174.3 ± 0.2 | 208.9 ± 0.2 | 70 |
| 25 nm | 625 ± 5 | 186.4 ± 0.4 | 208.3 ± 0.4 | 118 | 898 ± 1 | 175.9 ± 0.1 | 209.2 ± 0.1 | 73 |
| ODPA modified AAO | α-process | δ-process | ||||||
|---|---|---|---|---|---|---|---|---|
| B (K) | T∞ (K) | Tg (K) | m* | B (K) | T∞ (K) | Tg (K) | m* | |
| Bulk | 546 ± 24 | 190 ± 0.7 | 209.6 ± 0.7 | 136 | 1047 ± 10 | 170.3 ± 0.3 | 209.2 ± 0.3 | 63 |
| 400 nm | 599 ± 4 | 189.2 ± 0.3 | 210.2 ± 0.3 | 124 | 936 ± 1 | 175.42 ± 0.1 | 210.2 ± 0.1 | 71 |
| 200 nm | 620 ± 6 | 187.5 ± 0.4 | 209.2 ± 0.4 | 119 | 896 ± 13 | 177.4 ± 0.8 | 210.9 ± 0.9 | 73 |
| 65 nm | 633 ± 2 | 186.7 ± 0.1 | 208.8 ± 0.2 | 117 | 928 ± 7 | 175.6 ± 0.5 | 210.0 ± 0.5 | 72 |
| 35 nm | 613 ± 13 | 185.5 ± 0.9 | 206.9 ± 0.9 | 120 | 1160 ± 30 | 164.9 ± 1.9 | 207.7 ± 1.9 | 57 |
| 25 nm | 654 ± 3 | 183.6 ± 0.2 | 206.2 ± 0.2 | 115 | 837 ± 9 | 178.5 ± 0.7 | 209.6 ± 0.7 | 78 |
Comparing the parameters from Tables 2 and 3 we observe that fits yield, in all diameters irrespective of surface properties, higher values of the B parameter for the δ-process relative to the α-process, suggestive of the higher energy cost of activating a cooperative motion. Furthermore, in both types of pores we note an increase in fragility, or equivalently a decrease in the steepness index, of the α-process and a concomitant increase in that of the δ-process with confinement. Lastly, for a given diameter, the fragility corresponding to the α-process in native pores is somewhat higher than that in ODPA modified pores. This suggests that, a reduction of temperature, even close to the Tg, affects the dynamics associated with the α-process more in ODPA modified pores than in native pores. Extracting the glass temperature of the α-process in both types of confining pores, we note a depression with decreasing pore size described as Tg(α) = Tbulkg(α) − A/d with Tbulkg(α) = 209.8 ± 0.3 K and A = 75 ± 15 nm; a similar, though not as strong depression is seen for the glass temperature of the δ-process with Tbulkg(δ) = 209.9 ± 0.2 K and A = 19 ± 12 nm. The reduction in both TN/I and Tg(α), Tg(δ) results in a downward shift of the nematic phase upon reducing pore diameter. This is concisely depicted in the corresponding phase diagram (Fig. 8). The steeper Tg (α or δ) as compared to the TN/I dependence on inverse pore diameter effectively enlarges the N phase region under confinement.
The enhanced mobility that results from the decrease in the glass temperature can be discussed within the framework of the rotational diffusion model.50 The latter considers a diffusing rod-like molecule confined in a conical region in which all orientations up to a maximum cone angle are equally probable. The calculated dipolar autocorrelation function is found to decay rapidly as the conical volume (or angle) decreases. Therefore, an accelerated rotation of low molecular weight mesogens is predicted as they are confined to a decreasing volume.
Effect of confinement on the nature of the N/I transition
E7 confined to native and ODPA treated pores shows strong pre- and meta-transitional phenomena in the vicinity of the N/I transition, evident in the absolute derivative of the dielectric permittivity. Treated pores, in particular, exhibited not only broadening but also an increasingly symmetric form upon increasing confinement. They are, therefore, ideal in examining the effect of confinement on the pre- and meta-transitional fluctuations around the N/I transition. The following equations51 were used to describe the “critical” behavior of the quantity |dε′/dT| in the vicinity of the N/I transition:
 | (9) |
 | (10) |
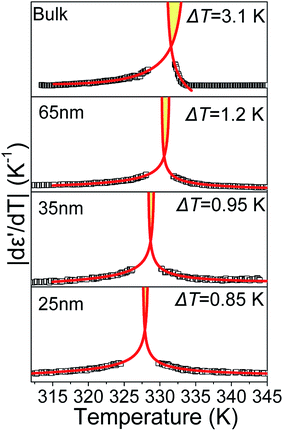
According to eqn (9) and (10), approaching the transition from below and above, respectively, physical quantities exhibit an exponential divergence versus the so called “reduced temperature”.52,53 Reduced temperature is, on either side of the transition, a measure of distance from the virtual transition temperatures T*, T**, i.e., the temperature at which the transition would occur if it were continuous. T* corresponds to the limit of supercooling the isotropic phase (obtained by extrapolating the fluctuations above the transition) and T** to the limit of superheating the nematic phase (obtained by extrapolating the fluctuations below the transition). The existence of a non-zero metastability region, ΔT = T** − T*, is indicative of a first-order transition whereas a second-order or continuous transition is characterized by ΔT = 0.54 In eqn (9) and (10) the terms BL|T − T**/T**|−α, BH|T − T*/T*|−α are different on either side of the peak while A, C are kept equal on either side of the peak constituting the non-singular background. Fits were performed simultaneously on both sides of the |dε′/dT| peaks corresponding to the N/I transition (in ODPA modified AAO pores) in ranges of 10 K into nematic and isotropic phases. A common coexistence range of 3.6 K about the peak maximum was excluded in order to consider the fluctuations pertinent to each pure phase; this region was extracted from the divergence of the phase shift recorded from TM-DSC on heating at a rate of 5 K min−1 using a temperature amplitude A = 0.04 K and period T = 20 s. Proximity of the N/I transition to a tricritical point12,55,56 was assumed by using α = 0.5. This allowed for estimation of a region of metastability, ΔT, about the actual transition equal to T** −T*. The extracted metastability region's, ΔT = T** − T* width, shows a systematic reduction with increasing confinement (Fig. 9) indicating a weakening of the N/I transition. However, as even in the severest examined confinement (e.g. 25 nm), ΔT ≠ 0, we conclude that the transition is not yet continuous.
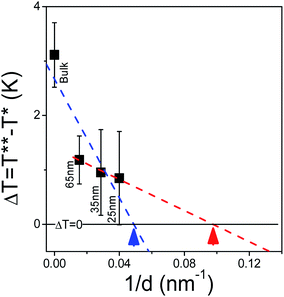
Plotting the width of ΔT versus inverse pore diameter allows for the estimation of a hypothetical critical diameter at which the N/I transition becomes continuous (i.e., ΔT = 0). Due to the sudden decrease in ΔT when going from bulk to confined conditions, two linear fits are performed and this is shown in Fig. 10. Depending on the method of extrapolation the extracted critical diameter ranges from 11 nm to 23 nm. This is similar to the critical diameters previously estimated (23 nm and 16 nm) from cyanobiphenyls 7CB and 8CB, respectively, imbibed in tubular silica nanochannels.57
Origin of the N/I transition in a mixture system
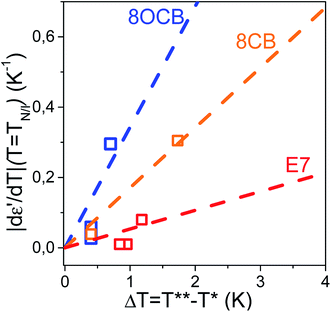
In the preceding discussion we have considered two independent quantities as markers of the N/I transition's strength: initially, the value of |dε′/dT| (T = TN/I) and, subsequently, the width of the metastability region ΔT about the actual transition. As a non-zero value of both quantities is related to the first-order character of the N/I transition it is reasonable to expect a linear correspondence between the two. This is shown in Fig. 11. To this end we consider the ratio |dε′/dT| (T = TN/I)/ΔT extracted as the slope of the plot |dε′/dT| (T = TN/I) = f(ΔT). The value of the aforementioned slope is calculated for E7 and compared to those of conventional thermotropic LCs belonging the cyanobiphenyl group, 8CB and 8OCB and studied earlier by us.31Fits include the point (0,0) as a value of zero for |dε′/dT| (T = TN/I) would imply the same for ΔT, and vice versa. The extracted slopes are (0.34 ± 0.09) for 8OCB, (0.17 ± 0.02) for 8CB and (0.05 ± 0.02) for E7. This is interpreted as an inherently weaker N/I transition in the mixture system, E7. We extend our argument by noticing that for all LCs in confinement the slope of |dε′/dT| (T = TN/I) = f(ΔT) is less than unity. Therefore, in a confined length scale the first-order nature of a transition is more pronounced in the thermal fluctuations about the transition temperature than the sudden divergence at exactly the transition temperature; this indicates the increasing potential of fluctuations in destabilizing ordered phases in confinement.
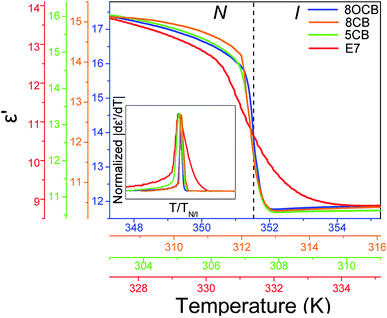
Central to the understanding of the origin of the N/I in the eutectic mixture E7 is a comparison with its constituents. Fig. 12 compares ε′(T) for E7, 8CB, 8OCB and 5CB in a range of about ±4 K about their respective TN/I's. Note the sharp, step-like, decrease for pure systems at TN/I in contrast to E7 which exhibits an S-shape decrease. In the |dε′/dT| representation this is portrayed as a broader peak for E7 with strong pre- and meta-transitional fluctuations (inset to Fig. 12). This can be explained as follows; in pure systems, pre-transitional phenomena are attributed to order parameter fluctuations, with the increase in thermal energy, which eventually lead to an order-disorder transition at TN/I. However, in E7 we note a large temperature range of fluctuations which must be attributed not only to pure thermal disordering but, also, to local concentration fluctuations triggered by the different constituents of the mixture exhibiting different length scales and ranges of nematic stability.
It must be stressed that 5CB and 8OCB account for 67% of E7, therefore the gradual character of the transition in E7 is not inherent in its constituents but results due to the effect of mixing. This leads to the conclusion that the mixing of LCs renders the final system eutectic with a single, widened nematic range at the cost of an equally protracted and gradual transition.
4 Conclusions
Two-dimensional hard confinement of the eutectic compound E7 in self-ordered AAO membranes alters its phase behavior, molecular dynamics and nature of the N/I transition. Decreasing pore size resulted in a depression of TN/I due to the effect of surface tension and elastic distortions on the nematic order. Dynamics were found to accelerate with increasing confinement, as predicted by the rotational diffusion model, resulting in a decreasing Tg. This resulted in displacing the region of nematic stability towards lower temperatures with decreasing pore diameter. The effect of surface treatment was seen as a preference for relaxation via the least cooperative α-mode due to constraints imposed by homeotropic anchoring at the pore surface. Confinement was found to weaken the N/I transition as evidenced by a reduction in the corresponding metastability region's width from 3.1 K to 0.85 K. Extrapolation of this weakening to a zero-valued metastability region allowed the calculation of a critical diameter (in the range from 23 nm to 11 nm) at which the transition is expected to become continuous. Lastly, comparing the N/I transition in the E7 to those of pure systems by use of the proposed ratio |dε′/dT|(T = TN/I)/ΔT revealed a broader transition in the former. This was interpreted as the result of local concentration fluctuations – triggered by the different lengthscales and nematic ranges of the components – on top of the conventional thermally activated order fluctuations.These results are not only of technological relevance in the implementation of devices with tunable dielectric properties but also in the understanding of the physics of phase transitions in soft matter under confinement.
Conflicts of interest
There are no conflicts to declare.Acknowledgements
The computations in this paper were run on the Odyssey cluster supported by the FAS Division of Science, Research Computing Group at Harvard University. We thank Professor Kaxiras for providing access to its cluster. H. D. gratefully acknowledges the Max-Planck-Gesellschaft (MPG) for financial support of the MPIP-TOBB ETU Partner Group Program. AAO infiltration process support by E. Tuncel is gratefully acknowledged.References
- P. G. de Gennes, and J. Prost, The Physics of Liquid Crystals, Oxford University Press, Oxford (UK), 1994 Search PubMed.
- G. P. Crawford, and S. Zumer, Liquid crystals in complex geometries, Taylor and Francis, London, 1996 Search PubMed.
- G. S. Iannacchione and D. Finotello, Phys. Rev. Lett., 1992, 69, 2094 CrossRef CAS PubMed.
- G. S. Iannacchione and D. Finotello, Phys. Rev. E, 1994, 50, 4780 CrossRef CAS PubMed.
- S. A. Rozanski, R. Stannarius, H. Groothues and F. Kremer, Liq. Cryst., 1996, 20, 59 CrossRef.
- S. Diez, M. A. Perez-Jubindo, M. R. de la Fuente, D. O. López, J. Salud and J. L. Tamarit, Liq. Cryst., 2006, 9, 1083 CrossRef.
- Y. Trukhina and T. Schilling, Phys. Rev. E, 2008, 77, 011701 CrossRef PubMed.
- G. P. Crawford, R. Ondris-Crawford, S. Žumer and J. W. Doane, Phys. Rev. Lett., 1993, 70, 1838 CrossRef CAS PubMed.
- A. R. Brás, H. Dionísio and A. Schönhals, J. Phys. Chem. B, 2008, 112, 8227 CrossRef PubMed.
- M. Mierzwa, M. Paluch, S. J. Rzoska, J. Zioło, and U. Maschke, Soft Matter under Exogenic Impacts, Springer, 2007, pp. 201–214 Search PubMed.
- A. Schönhals, S. Frunza, L. Frunza, T. Unhruh, B. Frick and R. Zorn, Eur. Phys. J.: Spec. Top., 2010, 189, 251 Search PubMed.
- V. M. Lenart, S. L. Gómez, I. H. Bechtold, A. M. Figueiredo Neto and S. R. Salinas, Eur. Phys. J. E, 2012, 35, 4 CrossRef CAS PubMed.
- M. C. W. van Boxtel, M. Wübbenhorst, J. van Turnhout, C. W. M. Bastiaansen and D. J. Broer, Liq. Cryst., 2003, 30(2), 235 CrossRef CAS.
- M. T. Viciosa, A. M. Nunes, A. Fernandes, P. L. Almeida, M. H. Godinho and M. D. Dionísio, Liq. Cryst., 2002, 29, 429 CrossRef CAS.
- A. R. Brás, M. Dionísio and A. Schönhals, J. Phys. Chem. B, 2008, 112, 8227 CrossRef PubMed.
- A. R. Brás, S. Frunza, L. Guerreiro, I. M. Fonseca, A. Corma, L. Frunza, M. Dionísio and A. Schönhals, J. Chem. Phys., 2010, 132, 224508 CrossRef PubMed.
- H. Masuda and K. Fukuda, Science, 1995, 268, 1466–1468 CrossRef CAS PubMed.
- H. Masuda, F. Hasegwa and S. Ono, J. Electrochem. Soc., 1997, 144, L127 CrossRef CAS.
- H. Masuda, K. Yada and A. Osaka, Jpn. J. Appl. Phys., 1998, 37, L1340 CrossRef.
- M. Steinhart, Adv. Polym. Sci., 2008, 220, 123 CAS.
- F. Kremer, and A. Schönhals, in Broadband Dielectric Spectroscopy, Springer, Berlin, 2002 Search PubMed.
- G. Floudas, Polymer Science: A Comprehensive Reference, in Dielectric Spectroscopy, ed. K. Matyjaszewski, and M. Möller, Elsevier BV, Amsterdam, vol. 2.32, pp.825–845, 2012 Search PubMed.
- A. D. Becke, J. Chem. Phys., 1993, 98, 5648 CrossRef CAS.
- C. Lee, W. Yang and R. G. Parr, Phys. Rev. B: Condens. Matter Mater. Phys., 1988, 37, 785 CrossRef CAS PubMed.
- T. H. Dunning, J. Chem. Phys., 1989, 90, 1007 CrossRef CAS.
- A. L. Hickey and C. N. Rowley, J. Phys. Chem. A, 2014, 118, 3678 CrossRef CAS.
- M. J. Frisch, G. W. Trucks, H. B. Schlegel, G. E. Scuseria, M. A. Robb, J. R. Cheeseman, G. Scalmani, V. Barone, G. A. Petersson, H. Nakatsuji, X. Li, M. Caricato, A. V. Marenich, J. Bloino, B. G. Janesko, R. Gomperts, B. Mennucci, H. P. Hratchian, J. V. Ortiz, A. F. Izmaylov, J. L. Sonnenberg, D. Williams-Young, F. Ding, F. Lipparini, F. Egidi, J. Goings, B. Peng, A. Petrone, T. Henderson, D. Ranasinghe, V. G. Zakrzewski, J. Gao, N. Rega, G. Zheng, W. Liang, M. Hada, M. Ehara, K. Toyota, R. Fukuda, J. Hasegawa, M. Ishida, T. Nakajima, Y. Honda, O. Kitao, H. Nakai, T. Vreven, K. Throssell, J. A. Montgomery Jr, J. E. Peralta, F. Ogliaro, M. J. Bearpark, J. J. Heyd, E. N. Brothers, K. N. Kudin, V. N. Staroverov, T. A. Keith, R. Kobayashi, J. Normand, K. Raghavachari, A. P. Rendell, J. C. Burant, S. S. Iyengar, J. Tomasi, M. Cossi, J. M. Millam, M. Klene, C. Adamo, R. Cammi, J. W. Ochterski, R. L. Martin, K. Morokuma, O. Farkas, J. B. Foresman, and D. J. Fox, Gaussian 16, Revision B.01, Gaussian, Inc., Wallingford CT, 2016 Search PubMed.
- C. Grigoriadis, H. Duran, M. Steinhart, H.-J. Butt and G. Floudas, ACS Nano, 2011, 5, 9208–9215 CrossRef CAS.
- A. Hourri, T. K. Bose and J. Thoen, Phys. Rev. E, 2001, 63, 051702 CrossRef CAS.
- K. C. Sungh and P. C. Jain, Struct. Chem., 1996, 7, 215 CrossRef.
- A. Selevou, G. Papamokos, M. Steinhart and G. Floudas, J. Phys. Chem. B, 2017, 121, 7382 CrossRef CAS PubMed.
- J. Jiang, E. Zhuravlev, Z. Huang, L. Wei, Q. Xu, M. Shan, G. Xue, D. Zhou, C. Schick and W. Jiang, Soft Matter, 2013, 9, 1488–1491 RSC.
- B. Lamia, N. Gogibus, B. Ewen, T. Pakula, X. Coqueret, M. Benmouna and U. Maschke, Polymer, 2004, 45, 6555 CrossRef.
- C.-S. Yang, C.-J. Lin, R.-P. Pan, C. T. Que, K. Yamamoto, M. Tani and C.-L. Pan, J. Opt. Soc. Am. B, 2010, 27, 1866 CrossRef CAS.
- Y. Kim, M. Lee, H. S. Wang, S. Ahn and J. Kim, Vib. Spectrosc., 2017, 92, 182 CrossRef CAS.
- J. Peláez and M. Wilson, Phys. Chem. Chem. Phys., 2007, 9, 2968 RSC.
- A. Kozak, J. K. Moscicki and G. Williams, Mol. Cryst. Liq. Cryst., 1991, 201, 1–12 CrossRef.
- S. Diez, M. A. Perez-Jubindo, M. R. de la Fuente, D. O. López, J. Salud and J. L. Tamarit, Liq. Cryst., 2006, 9, 1083 CrossRef.
- G. Meier and A. Saupe, Mol. Cryst., 1966, 1, 515–525 CrossRef CAS.
- A. J. Martin, G. Meier and A. Saupe, Symp. Faraday Soc., 1971, 5, 119 RSC.
- H. Duran, H. B. Hartmann-Azanza, M. Steinhart, D. Gehrig, F. Laquai, X. Feng, K. Müllen, H.-J. Butt and G. Floudas, ACS Nano, 2012, 6, 9359 CrossRef CAS.
- P. Thissen, M. Valtiner and G. Grundmeier, Langmuir, 2010, 26, 156 CrossRef CAS.
- E. Hoque, J. A. DeRose, G. Kulik, P. Hoffmann, H. J. Mathieu and B. Bhushan, J. Phys. Chem. B, 2006, 110, 10855 CrossRef CAS.
- D. Wilms, A. Winkler, P. Virnau and K. Binder, Phys. Rev. Lett., 2010, 105, 045701 CrossRef PubMed.
- B. Jérôme, Rep. Prog. Phys., 1991, 54, 391 CrossRef.
- M. Kuzma and M. Labes, Mol. Cryst. Liq. Cryst., 1983, 100, 103–110 CrossRef CAS.
- M. Alcoutlabi and G. B. McKenna, J. Phys.: Condens. Matter, 2005, 17, 461 CrossRef.
- B. Klus, U. A. Laudyn, M. A. Karpierz and B. Sahraoui, Opt. Express, 2014, 22, 24 CrossRef PubMed.
- G. Floudas, M. Paluch, A. Grzybowski, and K. Ngai, Molecular dynamics of glass-forming systems, in Effects of pressure, Springer, 2011 Search PubMed.
- C. C. Wang and R. Pecora, J. Chem. Phys., 1980, 72, 5333 CrossRef CAS.
- S. Diez-Berart, D. O. López, M. R. de la Fuente, J. Salud, M. A. Pérez-Jubindo and D. Finotello, Liq. Cryst., 2010, 37, 893 CrossRef CAS.
- C. Domb, and M. S. Green, in Phase Transitions and Critical Phenomena, Academic Press, 1972 Search PubMed.
- H. E. Stanley, in Introduction to Phase Transitions and Critical Phenomena, Clarendon Press, Oxford, 1971 Search PubMed.
- M. Kleman, and O. D. Lavrentovich, in Soft Matter Physics: An Introduction, Springer, 2003 Search PubMed.
- P. K. Mukherjee and T. B. Mukherjee, Phys. Rev. B: Condens. Matter Mater. Phys., 1995, 52, 9965 CrossRef PubMed.
- P. K. Mukherjee, J. Phys.: Condens. Matter, 1998, 10, 9191 CrossRef CAS.
- A. V. Kityk, M. Wolff, K. Knorr, D. Morineau, R. Lefort and P. Huber, Phys. Rev. Lett., 2008, 101, 187801 CrossRef PubMed.
Footnote |
| † Electronic supplementary information (ESI) available: XPS high-resolution spectra for pristine and ODPA modified AAO. Cartesian coordinates of optimized structures in DFT calculations. See DOI: 10.1039/c9ra08806g |
| This journal is © The Royal Society of Chemistry 2019 |


