
 Open Access Article
 This Open Access Article is licensed under a Creative Commons Attribution-Non Commercial 3.0 Unported Licence
Effects of cooling rate on structural relaxation in amorphous drugs: elastically collective nonlinear langevin equation theory and machine learning study
Anh D. Phan *abc,
Katsunori Wakabayashic,
Marian Paluchd and
Vu D. Lamef
*abc,
Katsunori Wakabayashic,
Marian Paluchd and
Vu D. Lamef
aFaculty of Materials Science and Engineering, Phenikaa Institute for Advanced Study, Phenikaa University, Hanoi 12116, Vietnam. E-mail: anh.phanduc@phenikaa-uni.edu.vn
bFaculty of Information Technology, Artificial Intelligence Laboratory, Phenikaa University, Hanoi 12116, Vietnam
cDepartment of Nanotechnology for Sustainable Energy, School of Science and Technology, Kwansei Gakuin University, Sanda, Hyogo 669-1337, Japan
dInstitute of Physics, University of Silesia, SMCEBI, 75 Puku Piechoty 1a, 41-500 Chorzow, Poland
eInstitute of Materials Science, Vietnam Academy of Science and Technology, Hanoi, Vietnam
fGraduate University of Science and Technology, Vietnam Academy of Science and Technology, Hanoi, Vietnam
First published on 4th December 2019
Abstract
Theoretical approaches are formulated to investigate the molecular mobility under various cooling rates of amorphous drugs. We describe the structural relaxation of a tagged molecule as a coupled process of cage-scale dynamics and collective molecular rearrangement beyond the first coordination shell. The coupling between local and non-local dynamics behaves distinctly in different substances. Theoretical calculations for the structural relaxation time, glass transition temperature, and dynamic fragility are carried out over twenty-two amorphous drugs and polymers. Numerical results have a quantitatively good accordance with experimental data and the extracted physical quantities using the Vogel–Fulcher–Tammann fit function and machine learning. The machine learning method reveals the linear relation between the glass transition temperature and the melting point, which is a key factor for pharmaceutical solubility. Our predictive approaches are reliable tools for developing drug formulations.
I. Introduction
Amorphous drugs have attracted much attention1–5 owing to their large solubility and enhanced bioavailability compared to the crystalline counterparts. The disordered structure of amorphous pharmaceutical products is formed by the rapid cooling of the molten material. The molecular mobility of an amorphous material is characterized by structural (alpha) relaxation time, τα. Since the structural relaxation process originates from liquid structure reorganization, τα is temperature-dependent and significantly slowed down at low temperatures. Below the glass transition temperature Tg, which is defined by τα(Tg) = 100 s, the drug stays in a disordered state for a long time, which is larger than the experimental observation time scale. However, the pharmaceutical can possibly be recrystallized during manufacturing or storage processes.1,2 It turns out that the physical stability of many amorphous systems is relatively poor. Comprehensive understanding of glassy states and the molecular mobility of amorphous drugs is crucial to formulate pharmaceutical products having desired properties1,2 and understand the fundamentals of glassy state physics.The relaxation processes of amorphous materials can be experimentally measured using broadband dielectric spectroscopy (BDS) and differential scanning calorimetry (DSC).1,2 BDS technique determines the structural relaxation time corresponding to thermal variation. DSC can measure the glass transition temperature and analyze phase separation in experimental samples at different cooling rates. The relevant timescale of molecular motions measured by BDS spans from picosecond above melting temperature to hundreds seconds in vicinity of the glass transition temperature. This technique can be used to investigate both structural (primary or long-time) and transient (secondary or short-time) relaxation processes.
Recently, the Elastically Collective Nonlinear Langevin Equation (ECNLE) theory has been developed to understand structural relaxation time of amorphous systems,6–11 in which an amorphous material is modeled as a fluid of molecular particles. The ECNLE theory considers a single molecular motion affected by the nearest-neighbor interactions and cooperative motions of molecules outside a particle cage formed by the neighboring molecules.6–10 This physical picture leads to a local barrier of a dynamic free energy and a collective barrier for each molecule caused by its nearest-neighbor interactions and effects of cooperative molecular rearrangements, respectively. These barriers are density-dependent and mutually correlated.
Plugging the two barriers calculated using the ECNLE theory into Kramer's theory gives the structural relaxation time.6–11 To find the temperature dependence of alpha relaxation time, one proposed an analytical conversion (thermal mapping) from averaged particle density to temperature based on experimental dimensionless compressibility data associated with equation of state.6–10 The theoretical calculations have also provided quantitative good predictions for the glass transition temperature and dynamic fragility of colloidal systems,8,9 supercooled liquids,7,9 and polymer melts.6,10 However, the experimental equation-of-state data needed for the original thermal mapping has rarely measured in amorphous drugs. Thus, we have recently proposed another density-to-temperature conversion using the thermal expansion and experimental glass transition temperature values.11 Our approach has successfully described temperature-dependent molecular dynamics in one- and multi-component amorphous drugs.
Most ECNLE calculations have assumed a universal correlation between local and collective barrier for all substances when inserting into Kramer's theory. The assumption simplifies roles of chemical and biological complexities on the glass transition. Consequently, the quantitative agreement between theoretical calculations and experiments is imperfect. Moreover, since the dynamic fragility of a material depends strongly on the form of τα(T), a small theory-experiment deviation in τα(T) leads to an inaccurate prediction of the fragility.
In this work, we introduce an adjustable parameter characterizing for a non-universal local-collective correlation in pharmaceuticals. The new version of the ECNLE theory accurately and simultaneously predicts the glass transition temperature and dynamic fragility of amorphous drugs. We employ machine learning technique to reveal a undiscovered relation between melting point and glass transition. We also predict the glass transition temperature based on BDS data. Our ECNLE numerical results are quantitatively compared to experimental data and machine learning calculations.
Theoretical understanding of how glassy dynamics of amorphous materials varies with the cooling rate is limited. Previous theoretical studies12–14 have given phenological/qualitative descriptions for the Tg change as a function of cooling rate. Based on the theoretical development of this paper, we propose, for the first time, an analysis to provide quantitative determinations for this phenomenon and insightful discussions for experiments.
II. Structural relaxation time of amorphous drugs
Amorphous drugs/materials are theoretically described as a fluid of disconnected spherical rigid particles, which interact with each other via hard-sphere interaction. The particle diameter is d and the number density of particles is ρ. A particle is assumingly acted by three forces including (1) the caging force caused by the surrounding fluid, −∂Fdyn(r)/∂r, (2) the thermal white noise, δf, (3) the friction force, −ζs(∂r/∂t), here ζs is a short-time friction constant and r ≡ r(t) is the displacement of the particle. The key quantity is Fdyn(r) known as the dynamic free energy of the tagged particle due to its nearest neighbors.6,7,15,16 Based on an overdamped equation-of-motion for the scalar displacement of a tagged particle, we have
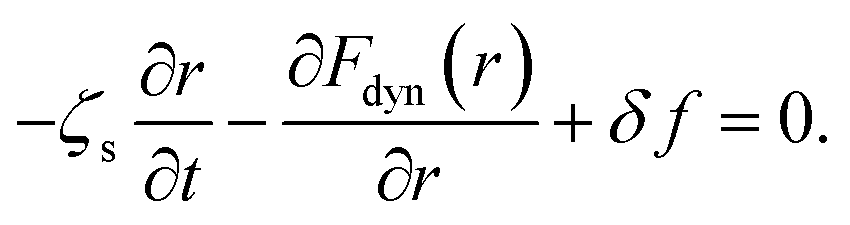 | (1) |
The thermal noise force satisfies 〈δf(0)δf(t)〉 = 2kBTζsδ(t), where kB is the Boltzmann constant and T is temperature. According to ECNLE theory, the dynamic free energy is6,7,15,16
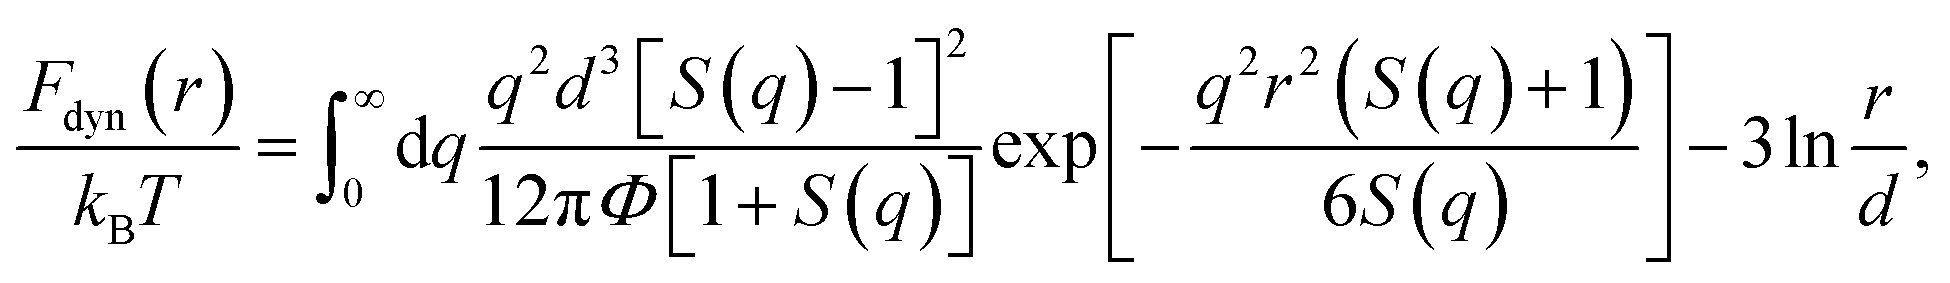 | (2) |
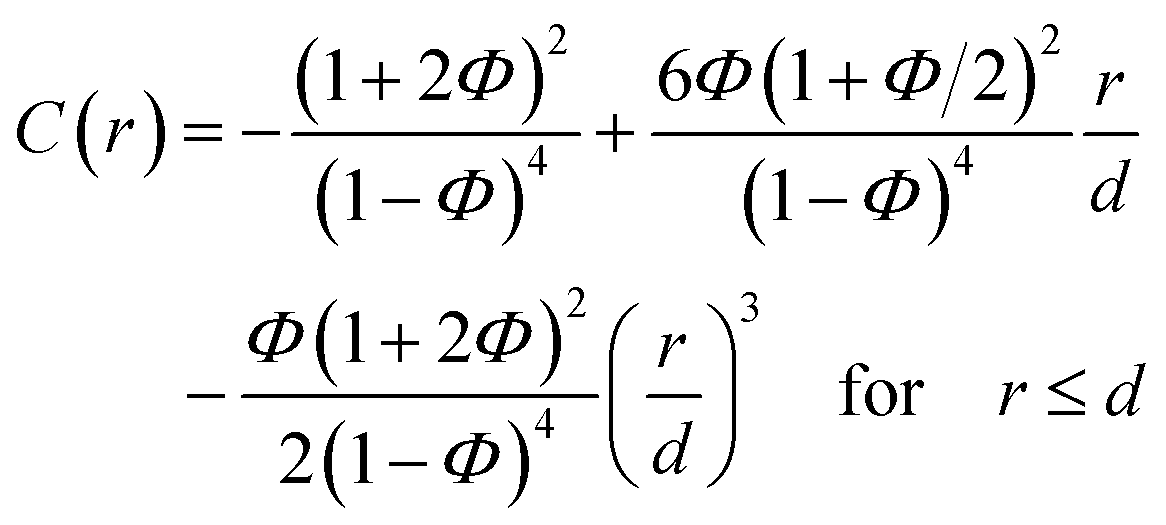 | (3) |
| C(r) = 0 for r > d. | (4) |
Recall that the ECNLE theory ignores effects of rotational motions and only consider translational motions, which are angularly-averaged. The first term of eqn (2), which depends strongly on the fluid structure and density, is the dynamic trapping potential and favors the particle localization. While the second term independent of the system structure represents the ideal fluid state.
Fig. 1 shows an illustration of the dynamic free energy as a function of r and key physical quantities in the local caging constraint. In dilute suspension (Φ ≤ 0.43),15–17 Fdyn(r) monotonically decreases with an increase of r and particles move without constraint. When Φ > 0.43, the tagged particle is dynamically arrested within a particle cage formed by its neighbors and one observes an emergence of a free-energy barrier. The particle cage radius, rcage, as depicted in Fig. 1 is determined as the first minimum position in the radial distribution function, g(r). Since S(q) and g(r) are a Fourier-transform pair, one has 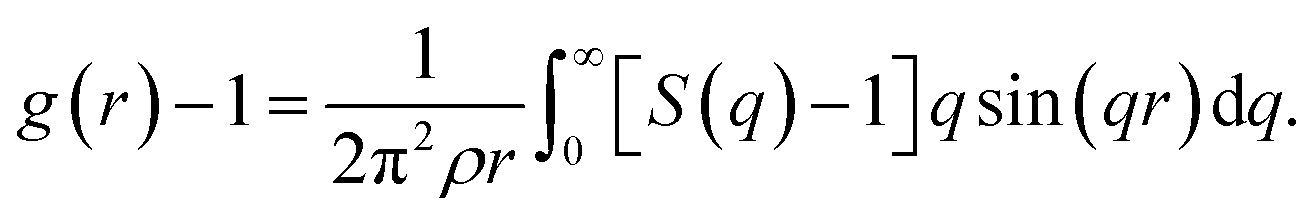 Thus, the radius of the particle cage is about 1.3 − 1.5d. When the dynamic free energy reaches the local minimum and maximum, one obtains the localization length (rL) and the barrier position (rB). The energy difference between these two positions is the local hopping barrier FB = Fdyn(rB) − Fdyn(rL). The jump distance from the localized position to the barrier position is defined as Δr = rB − rL. K0 = |∂2Fdyn(r)/∂r2|r=rL and KB = |∂2Fdyn(r)/∂r2|r=rB are absolute curvatures at the localization length and barrier position.
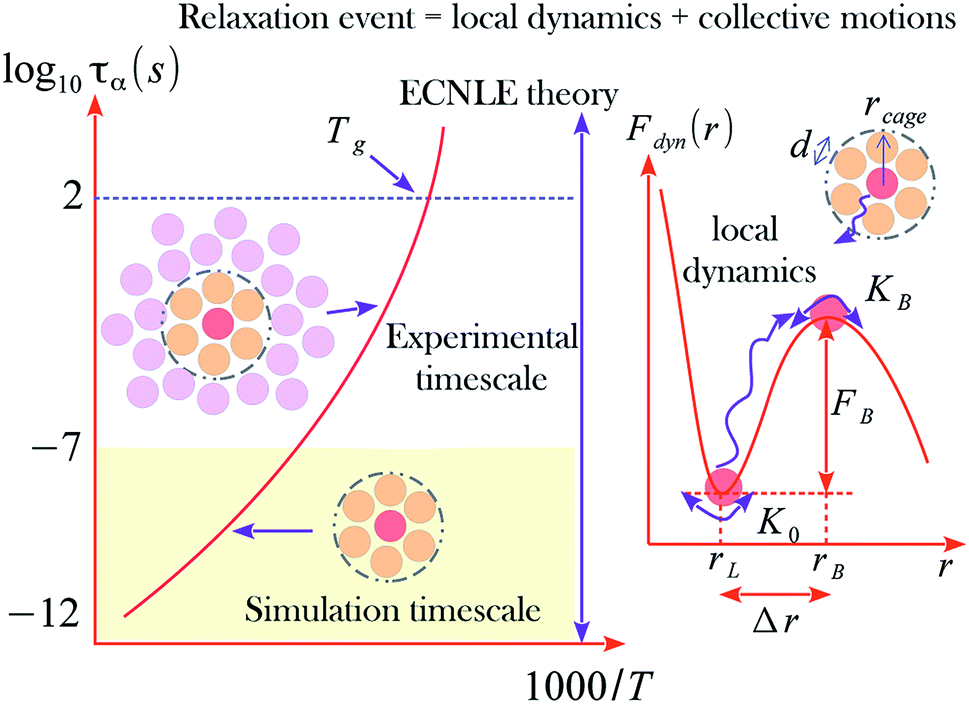 | ||
| Fig. 1 A general form of temperature dependence of structural relaxation time described by a coupled process of local cage-scale dynamics and collective motions. The dynamic free energy profile of a tagged particle indicates key length scales and a barrier in the local dynamics. | ||
The rearrangement of particles in the first shell causes a small expansion on the surface of the particle cage and generates a harmonic displacement field u(r) in surrounding medium via collective motions of other particles. In bulk systems, one can obtain analytical form of the distortion field by Lifshitz's continuum mechanics analysis18
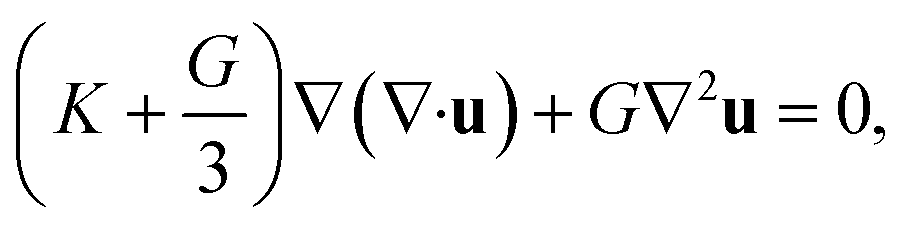 | (5) |
 | (6) |
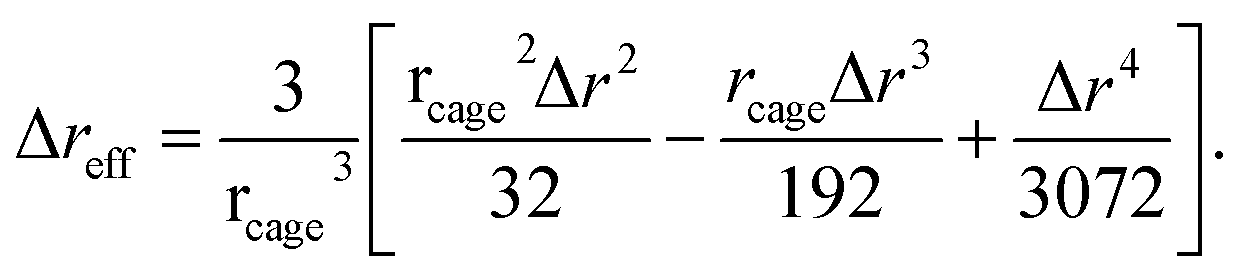
Solving eqn (5) with the boundary condition at the cage surface gives
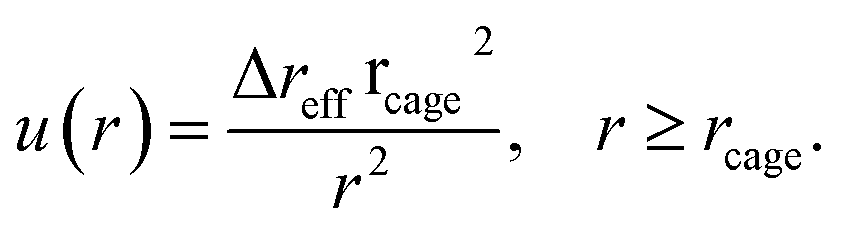 | (7) |
The spatial harmonic displacement energy of a particle at separation distance r from the center of its arrested cage is K0u2(r)/2. Since the local time-averaged density is ρg(r), the number of particles found at a distance between r and r + dr is ρg(r)4πr2dr. One can integrate the elastic energies of particles outside the cage to quantify effects of cooperative motions. The collective elastic barrier, Fe, is
 | (8) |
For r ≥ rcage, one can approximate g(r) ≈ 1. The collective motions of molecules play a more important role than the local dynamics in the glass transition at high densities or low temperatures6–8 as depicted in Fig. 1.
The activated relaxation is governed by both local and non-local processes. If a universal correlation between a local and non-local process is assumed, the total barrier is simply Ftotal = FB + Fe. The alpha relaxation time for a particle to diffuse from its particle cage is quantified by Kramer's theory:
 | (9) |
 | (10) |
To convert our hard-sphere calculations into the temperature dependence of the structural relaxation time, we proposed11 a thermal mapping, which is based on the thermal expansion process during temperature variation, to convert from a volume fraction of hard-sphere fluid to temperature of experimental material. The mapping is
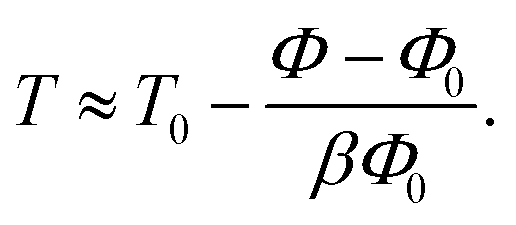 | (11) |
The parameter T0 depends on molar mass and particle size. Our numerical calculations indicate the structural relaxation time τα ≈ 100 s at Φ ≈ 0.611. Thus, one can approximately obtain T0 = Tg − (0.611 − Φ0)/βΦ0. The experimental value of Tg can be found in many literatures. Based on the calculation, we investigated the temperature dependence of the structural relaxation time of many amorphous drugs and their mixtures (binary and ternary composites).11 The theoretical calculations without any adjustable parameters quantitatively agree with various experimental data over 14 decades in time. While simulations can determine relaxation times only over first 3–6 decades and do not access experimental timescale as illustrated in Fig. 1.
Fig. 2 shows log10![[thin space (1/6-em)]](https://www.rsc.org/images/entities/char_2009.gif) τα of five representative pure amorphous drugs21–24 as a function of 1000/T calculated using eqn (9)–(11). Overall, the theoretical curves are relatively close to the experimental counterpart, except for calculations of vitamin A. A deviation of experimental data of the vitamin-A drug from theoretical calculations is expected. This is because the theory ignores many chemical and structural complexities such as hydrogen-bonding, network formers, and flexible molecular docking. Moreover, the approach seems to provide less quantitatively accurate predictions for the dynamic fragility of amorphous materials.
τα of five representative pure amorphous drugs21–24 as a function of 1000/T calculated using eqn (9)–(11). Overall, the theoretical curves are relatively close to the experimental counterpart, except for calculations of vitamin A. A deviation of experimental data of the vitamin-A drug from theoretical calculations is expected. This is because the theory ignores many chemical and structural complexities such as hydrogen-bonding, network formers, and flexible molecular docking. Moreover, the approach seems to provide less quantitatively accurate predictions for the dynamic fragility of amorphous materials.
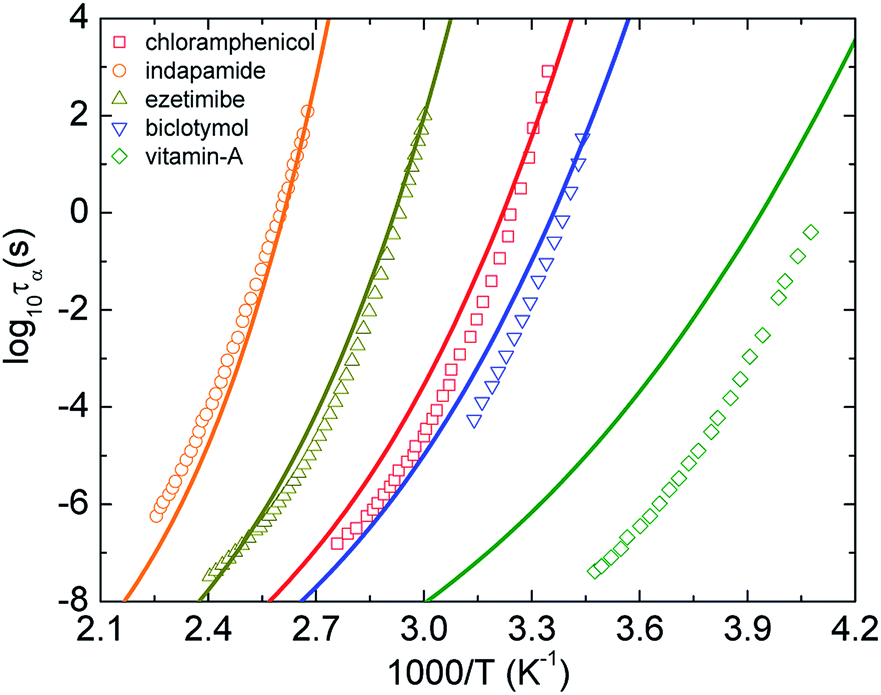 | ||
| Fig. 2 The temperature dependence of structural relaxation time of chloramphenicol,21 indapamide,22 ezetimibe,22 biclotymol,23 and vitamin-A acetate.24 Open points are experimental data in literatures and solid curves correspond to our ECNLE calculations. | ||
III. Nonuniversal coupling of local and cooperative dynamics
The dynamic fragility is calculated by
 | (12) |
One adopts the physical quantity to classify into two main categories: “strong” or “fragile” for glass-forming materials. For m ≤ 30, the glass formers are strong. The glass formers having m ≥ 100 are fragile. The remaining materials are called intermediate glass-forming materials.
The dynamic fragility is very sensitive to the slope of τα(T) at T = Tg. Thus, a good agreement between theory and experiment in τα versus T does not mean that another consistency in calculations of m occurs. In ref. 10, authors introduced an adjustable parameter ac to scale the collective elastic barrier as Fe → ac2Fe. The parameter ac captures chemical and biological complexities, conformational configuration, and chain connectivity in different thermal liquids and polymers. The parameter assesses the relative importance of the collective elastic distortion by assuming a non-universal coupling of the cage-scale hopping and collective rearrangements of fluid particles. The previous work10 obtained contemporaneously the quantitative accordance between theoretical ECNLE calculations and experimental values of both dynamic fragility and glass transition temperature for 17 polymers.
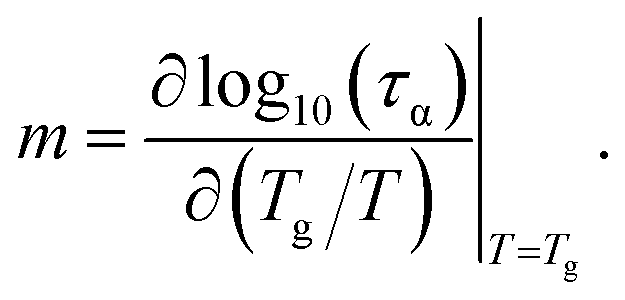
Motivated by the idea in ref. 10, in our calculations, we adjust parameters T0 and ac to achieve the best fit to the experimental temperature dependence of structural relaxation times. Fig. 3 shows experimental data and our theoretical calculations for τα(T) of 22 pure amorphous materials. We carry out the same procedure as calculations in Fig. 2 except for now Ftotal = FB + ac2Fe. Our numerical results agree quantitatively well with a wide range of experimental data. Remarkably, the activated events of carvedilol, celecoxib, chloramphenicol, and polystyrene below Tg, where τα ranges from 100 s to 104 s, are well-described using the ECNLE theory. Many previous works26,27,43,44 have observed a distinctive deviation, so-called a dynamic structural decoupling, in the relaxation process at low temperatures. For example, in Fig. 3a, the growth of τα(T) of carvedilol drug below Tg is abruptly deviated from what it is supposed to be. Currently, there is poor theoretical understanding for the interesting but challenging feature. In the framework of the ECNLE theory, the decoupling could be related to a temperature dependence of thermal expansion coefficient β in our thermal mapping.
 | ||
| Fig. 3 The temperature dependence of structural relaxation time of twenty-two various amorphous drugs and polymers listed in Table 1.11,18–39 Open points are experimental data in literatures and solid curves correspond to our ECNLE calculations. PVP is an abbreviation of polyvinyl pyrrolidone K30. | ||
From calculations in Fig. 3, we can estimate the glass transition temperature and dynamic fragility. The local-nonlocal coupling parameter ac, the characteristic temperature T0, the melting temperature Tm, and theoretical and experimental values for Tg and m of the studied materials are listed in Table 1. Clearly, the theoretical Tg is in perfect accordance with the experimental counterpart. The different accuracy of our calculations for the fragility is somehow expected and reflects a complicated Tg − m correlation.
| Materials | Tg(th) (K) | Tg(expt) (K) | m(th) | m(expt) | Tm(expt) (K) | ac | T0 (K) |
|---|---|---|---|---|---|---|---|
| Carvedilol25 | 308 | 310 (ref. 25) | 91.5 | 387.5 (ref. 38) | 2.1 | 450 | |
| Celecoxib26,27 | 328 | 328 (ref. 26) | 97.8 | 110 (ref. 26) | 432 (ref. 38) | 2.1 | 470 |
| Chloramphenicol21 | 301.1 | 301 (ref. 21) | 89 | 116 (ref. 21) | 423.5 (ref. 38) | 2.1 | 443 |
| Griseofulvin28 | 358 | 359 (ref. 28) | 88.7 | 84.6 (ref. 28) | 489 (ref. 39) | 1.2 | 533 |
| Indomethacin29 | 314.1 | 315 (ref. 29) | 86.4 | 77, 67, 64 (ref. 29) | 432 (ref. 39) | 1.5 | 476 |
| Ketoconazole30 | 308 | 316.3 (ref. 30) | 71.37 | 419 (ref. 38) | 1.0 | 493 | |
| Probucol31 | 294 | 294.7 (ref. 31) | 79.4 | 85 (ref. 31) | 398 (ref. 38) | 1.5 | 456 |
| Polystyrene32 | 373 | 373 (ref. 10) | 105.53 | 116, 143, 97, 121 (ref. 10) | 513 (ref. 40) | 1.7 | 528 |
| Bicalutamide33 | 325.3 | 325.4 (ref. 33) | 78.03 | 84 (ref. 33) | 464 (ref. 39) | 1.1 | 505 |
| Biclotymol23 | 288 | 288 (ref. 23) | 85.42 | 85 (ref. 23) | 2.1 | 430 | |
| Polyvinylpyrrolidone K30 (ref. 26) | 431.2 | 431 (ref. 26) | 58.47 | 70 (ref. 26) | 523 (ref. 41) | 0.3 | 672 |
| Tripropyl phosphate34 | 132.1 | 134 (ref. 34) | 40.3 | 194 (ref. 38) | 2.4 | 266 | |
| Vitamin-A acetate24 | 236.3 | 244.3 (ref. 24) | 76.6 | 83 (ref. 24) | 330 (ref. 42) | 3.4 | 349 |
| Nisoldipine35 | 303 | 305 (ref. 35) | 70.2 | 81 (ref. 35) | 425 (ref. 42) | 1.0 | 488 |
| Nifedipine35 | 315 | 315 (ref. 35) | 74.9 | 84 (ref. 35) | 444 (ref. 39) | 1.1 | 494 |
| Nimodipine35 | 284.1 | 285 (ref. 35) | 62 | 82 (ref. 35) | 398 (ref. 38) | 0.9 | 474 |
| Indapamide22 | 373.4 | 373.5 (ref. 22) | 75.3 | 73 (ref. 22) | 433 (ref. 38) | 0.7 | 578 |
| Ezetimibe22 | 333.3 | 333.1 (ref. 22) | 91.1 | 93 (ref. 22) | 436 (ref. 38) | 1.5 | 495 |
| Kollidon VA64 (ref. 11) | 376.2 | 378 (ref. 11) | 79 | 0.8 | 573 | ||
| Simvastatin11 | 301 | 303 (ref. 11) | 74.8 | 73 | 411 (ref. 38) | 1.3 | 471 |
| Flutamide36 | 272 | 271 (ref. 36) | 71.6 | 385 (ref. 38) | 1.4 | 438 | |
| Ibuprofen37 | 222 | 225 (ref. 37) | 68 | 87 (ref. 37) | 346 (ref. 39) | 2.4 | 356 |
IV. Machine-learning based analysis of glassy dynamics
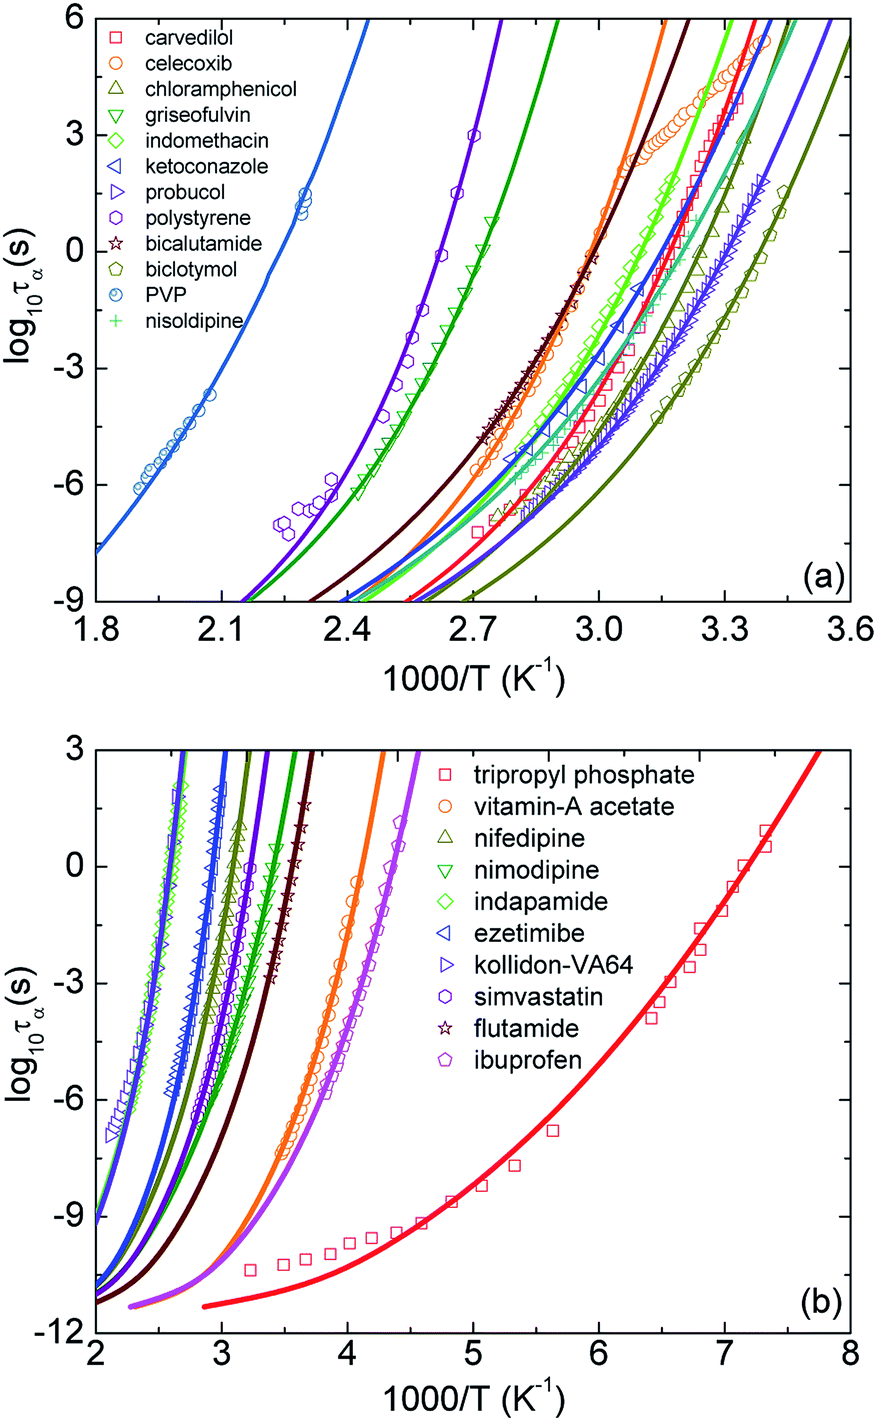
There are two main methods to obtain Tg from experiments. First, one can use the DSC measurement for samples to find the value of Tg. Second, experimentalists have widely used the Vogel–Fulcher–Tammann (VFT) equation to fit data measured by the BDS, which is inaccessible to the deeply supercooled state or (τα ≤ 1 s). From this fitting function, they can obtain the glass transition temperature at τα = 100 s via extrapolation. However, the fitting depends strongly on a focused regime of data.45 The selection process possibly causes large overprediction or underprediction of Tg. This is possibility why many works have reported different Tg values for a given material.Here we introduce, for the first time, another approach based on machine learning techniques. After obtaining a predictive model by applying the support vector regression (SVR) in the Scikit-learn Python library54 to experimental data of the temperature dependence of τα at high temperatures, we can predict new relaxation times at lower temperatures than the coolest temperature in the training dataset. The SVR with the radial basis function (RBF) kernel has two controlled parameters including a regularization parameter CRBF and a RBF kernel parameter γ. While γ is considered as the inverse of the standard deviation of the RBF kernel, CRBF determines the penalty of large slack variables. In our calculations, we chose γ = 0.1 and obtained equal performance when CRBF ≥ 100. As shown in Fig. 4, τα(T) versus 1000/T predicted by the SVR with CRBF = 103 grows smoothly and are close to experimental data for some representative amorphous drugs. The number of BDS data points for simvastatin, ketoconazole, bicalutamide, griseofulvin, vitamin-A acetate, and nisoldipine used for training are 24, 8, 17, 17, 22, and 28, respectively. The SVR calculations give Tgs for simvastatin, ketoconazole, bicalutamide, griseofulvin, vitamin-A acetate, and nisoldipine are 300.2, 308.64, 323, 358.2, 237.8, and 304 K, respectively. These values quantitatively agree experimental data and our ECNLE results in Table 1. This is a new reliable approach for investigating molecular dynamics of amorphous materials near Tg, particularly when the structural decoupling appears.26,27,33,43,44 The linear regression cannot be used in this protocol since it enforces a Arrhenius nature on any experimental data and keeps it unchanged in the predictive process.
 | ||
| Fig. 4 The temperature dependence of structural relaxation time of simvastatin11, ketoconazole,30 bicalutamide,33 griseofulvin28, vitamin-A acetate,24 and nisoldipine.35 Open points are experimental data in literatures and solid curves correspond to machine learning-based calculations. | ||
To find new minimalist correlations or physical insights among the quantities in Table 1, we employ a linear regression model in the scikit-learn library.54 This regression algorithm provides the simplest relation to describe a target variable from a set of descriptor variables. By adopting Tg and Tm experimental values of 71 glassy drugs listed in ref. 46 as a training dataset, one obtains Tm ≈ 1.362 Tg. It is important to note that these drugs are different from amorphous materials in this work. Then, we apply the predicted relation to our twenty substances to evaluate the validity of the model. Numerical results in Fig. 5 indicate that the Tg − Tm correlation works well. This finding suggests the ECNLE theory can be exploited to estimate the melting temperature with a reasonable deviation.
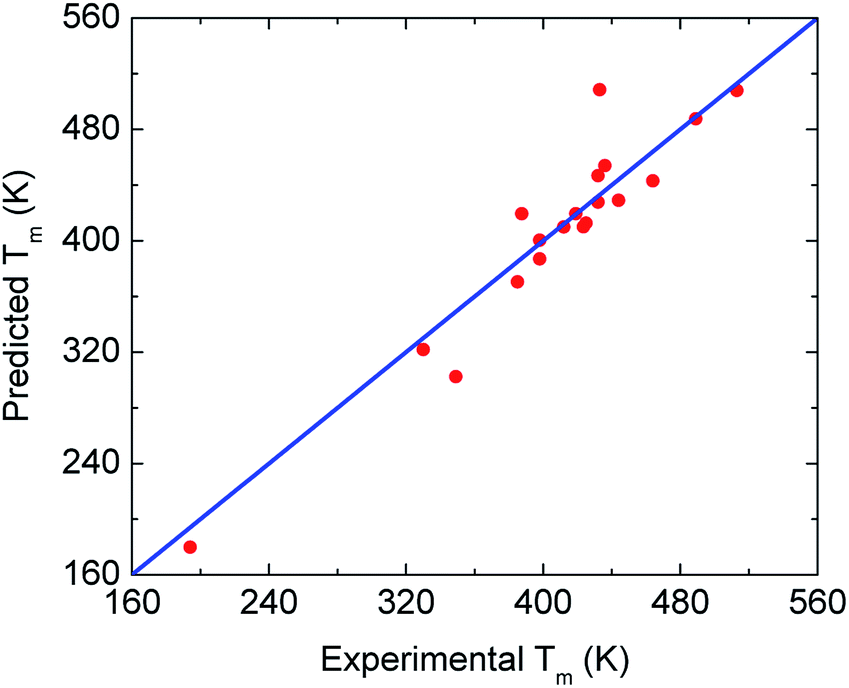 | ||
| Fig. 5 Cross-plot of predicted and experimental values of the melting temperature for all 20 drugs and polymers from Table 1. The blue line indicates perfect agreement. | ||
In many prior works,47–49 the melting point of amorphous drugs exhibits an essential role in the solubility determination of the drugs. The linear relation between Tg and Tm suggests that one can employ ECNLE theory to evaluate the solubility of amorphous materials and their mixtures.
V. Effects of cooling rate on glassy dynamics
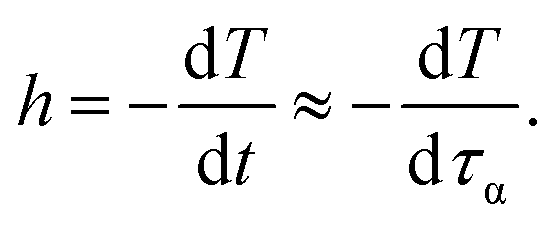
Although it is experimentally well-known that cooling rate has considerable impact on glassy dynamics, but theoretical understanding has remained ambiguous. Thus, in this section, we would propose a simple model to estimate how Tg is varied with different cooling rates.According to an assumption introduced by Cooper and Gupta in 1982,12 the molecular relaxation time is approximately equal to the experimental observation time at Tg. This assumption leads to a new definition of a cooling rate, h,
 | (13) |
The minus sign in eqn (13) represents an inverse variation between mobility and temperature.
Near glass transition temperature, eFtotal/kBT ≫ 1 and the alpha structural relaxation time in eqn (9) approximately becomes
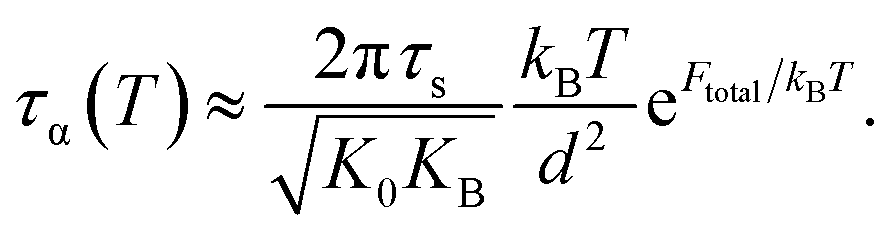 | (14) |
Recall that the total barrier here is Ftotal = FB + ac2Fe as discussed in Section III. After straightforward transformations, one obtains
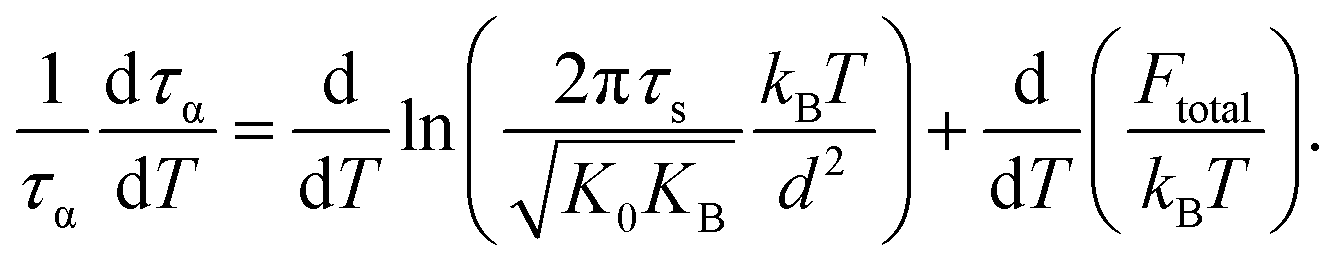 | (15) |
Since τs is order of picoseconds (10−12 s), the first term is much smaller than the second term near Tg. Thus,
 | (16) |
When the temperature dependence of structural relaxation time obeys the Arrhenius behavior, the total barrier Ftotal is a constant and our eqn (16) can be deduced to be the same mathematical form as previous studies13,14
 | (17) |
Moreover, combining eqn (14) and (16) gives
 | (18) |
The above equation reveals explicitly a correlation between the cooling rate and the glass transition temperature. Recall that various experimental studies have empirically indicated that lnh is linearly proportional to −1/Tg in a specific range of Tg. If the relation is universal, it suggests the first two terms in eqn (18) may play a minor role compared others and then our analysis can clearly explain the experimental observation.
Fig. 6 shows how the cooling rate influences the glass transition temperature of polystyrene,50 PVP,51 nifedipine,52 and indomethacin.51 Our theoretical calculations are relatively consistent with experimental data. Although both theoretical curves and data points are not perfect straight lines, the rough linearity is possibly observed in a certain range of the glass transition temperature. One can also crudely view these smooth curves as a combination of high- and low-Tg linear branches. Furthermore, as discussed in Section IV, Tm ≈ 1.362Tg, we expect plotting lnh versus 1000/Tm (not shown here) does not change the variation trends compared to Fig. 6. The finding is in accordance with other experimental works.53
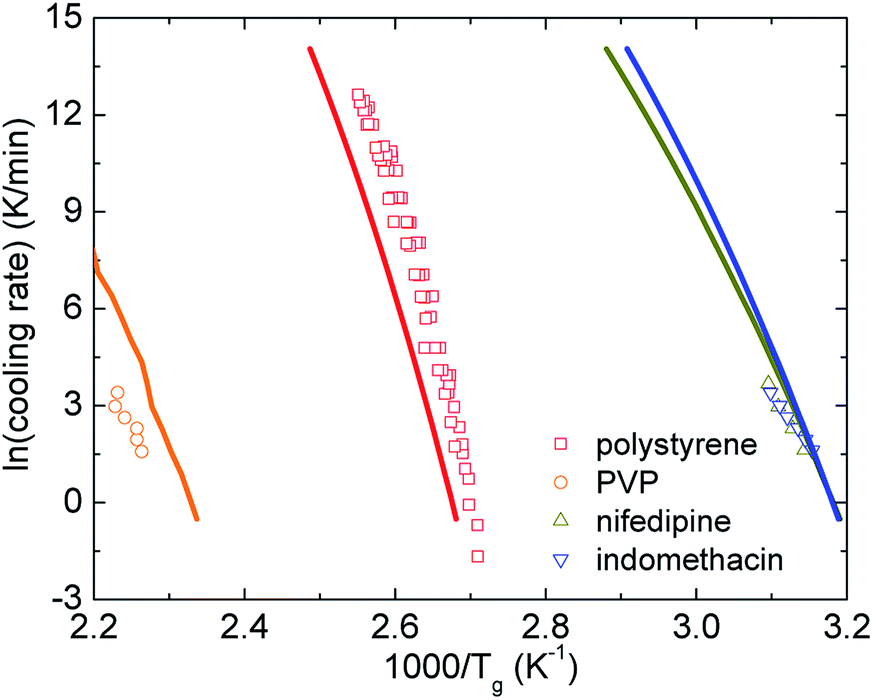 | ||
| Fig. 6 The logarithm of cooling rate as a function of inverse glass transition temperatures of various amorphous drugs and polymers. Points are experimental data and solid curves correspond to our theoretical calculations using eqn (16). | ||
The effects of cooling rate on Tg can be also analyzed using the VFT-type relaxation time, which is
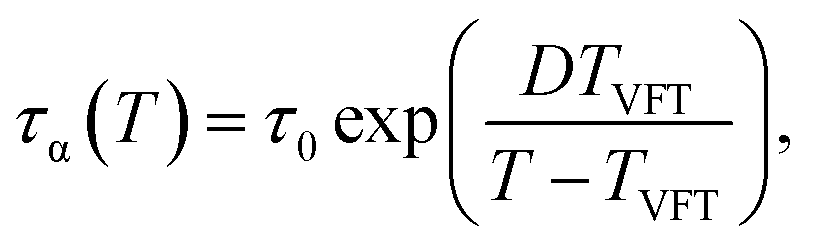 | (19) |
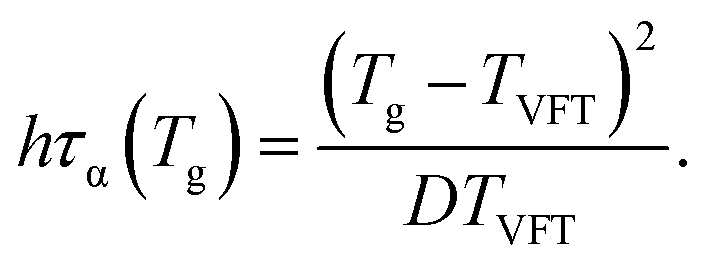 | (20) |
Interestingly, both ECNLE theory and VFT-function analysis give us the same form of the nontrivial correlation among the cooling rate, glass transition temperature, and fragility
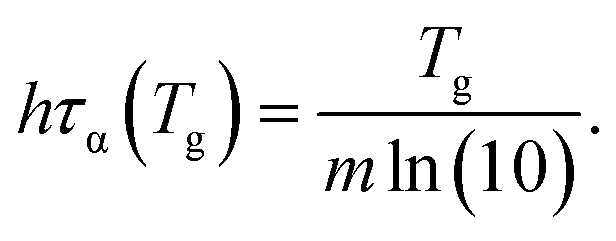 | (21) |
For small lnq (≤0) or low cooling rates, Tg of polystyrene is nearly unchanged, approximately 373 K. Thus, one can utilize the definition of τα(Tg) = 100 s to estimate Tg in the range of the cooling rate. It suggests that if τα of all substances is measured at the same low cooling rate, hτα(Tg) ≈ 100h and Tg is linearly proportional to m. However, since different experiments have been carried out at different cooling rates, it is hard to obtain a Tg − m trivial correlation.
VI. Conclusions
We have shown several theoretical approaches to improve quantitatively accurate predictions of the glass transition temperature and dynamic fragility of twenty-two amorphous drugs and polymers. The temperature dependence of the structural relaxation time is theoretically calculated using the version of ECNLE theory. By introducing an adjustable parameter to describe a non-universal correlation between local and collective molecular dynamics in different materials, our numerical results for the dynamic fragility and Tg measured at various cooling rates show better quantitative agreement with experiments than simply using the universal local-nonlocal coupling. Applying machine-learning calculations to BDS experimental data gives the same Tg values as using the VFT fit function. The finding suggests that machine learning technique can verify the VFT-based results in all BDS studies instead of comparing with DSC experiments. The machine-learning calculation may be more reliable to predict Tg and m when the structural decoupling of relaxation process occurs. Machine learning also reveals the linear relation of Tm ≈ 1.362Tg. This relation explains why the cooling rate changes the melting point and glass transition temperature in the same manner.Conflicts of interest
There are no conflicts to declare.Acknowledgements
This work was supported by JSPS KAKENHI Grant Numbers JP19F18322 and JP18H01154. The author, M. P., is grateful for the financial support received within the Project no. 2015/16/W/NZ7/00404 (SYMFONIA 3) from the National Science Centre, Poland. This research was funded by the Vietnam National Foundation for Science and Technology Development (NAFOSTED) under grant number 103.01-2019.318.References
- R. O. Williams III, A. B. Watts, and D. A. Miller, Formulating Poorly Water Soluble Drugs, Springer, New York, 2nd edn, 2016 Search PubMed.
- M. Rams-Baron, R. Jachowicz, E. Boldyreva, D. Zhou, W. Jamroz, and M. Paluch, Amorphous Drugs, Springer, Heidelberg, 2018 Search PubMed.
- C. Lipinski, Am. Pharm. Rev., 2002, 5, 82–85 Search PubMed.
- S. P. Bhardwaj and R. Suryanarayanan, Mol. Pharm., 2012, 9, 3209–3217 CrossRef CAS.
- Z. Wojnarowska, K. Grzybowska, L. Hawelek, M. Dulski, R. Wrzalik, I. Gruszka and M. Paluch, Mol. Pharm., 2013, 10, 3612–3627 CrossRef CAS.
- A. D. Phan and K. S. Schweizer, J. Phys. Chem. B, 2018, 122, 8451–8461 CrossRef CAS.
- S. Mirigian and K. S. Schweizer, J. Chem. Phys., 2014, 140, 194506 CrossRef.
- S. Mirigian and K. S. Schweizer, J. Phys. Chem. Lett., 2013, 4, 3648 CrossRef CAS.
- S. Mirigian and K. S. Schweizer, J. Chem. Phys., 2014, 140, 194507 CrossRef.
- S.-J. Xie and K. S. Schweizer, Macromolecules, 2016, 49, 9655–9664 CrossRef CAS.
- A. D. Phan, J. Knapik-Kowalczuk, M. Paluch, T. X. Hoang and K. Wakabayashi, Mol. Pharm., 2019, 16, 2992–2998 CrossRef CAS.
- A. Cooper and P. Gupta, Phys. Chem. Glasses, 1982, 23, 44 CAS.
- J. W. P. Schmelzder, J. Chem. Phys., 2012, 136, 074512 CrossRef.
- I. Gutzow and J. Schmelzer, The Vitreous State: Thermodynamics, Structure, Rheology, and Crystallization, Spring, Berlin, 1995 Search PubMed.
- K. S. Schweizer and E. J. Saltzman, J. Chem. Phys., 2003, 119, 1181 CrossRef CAS.
- E. J. Saltzman and K. S. Schweizer, J. Chem. Phys., 2006, 125, 044509 CrossRef.
- J.-P. Hansen and I. R. McDonald, Theory of Simple Liquids, Academic Press, London, 2006 Search PubMed.
- L. D. Landau and E. M. Lifshitz, Theory of Elasticity, Permagon Press, London, 3nd edn, 1975 Search PubMed.
- S. S. Dalal and M. D. Ediger, Molecular Orientation in Stable Glasses of Indomethacin, J. Phys. Chem. Lett., 2012, 3, 1229–1233 CrossRef CAS.
- J. A. Forrest and K. Dalnoki-Veress, When Does a Glass Transition Temperature Not Signify a Glass Transition?, ACS Macro Lett., 2014, 3, 310–314 CrossRef CAS.
- J. Knapik-Kowalczuk, Z. Wojnarowska, K. Chmiel, M. Rams-Baron, L. Tajber and M. Paluch, Mol. Pharm., 2018, 15, 1928–1940 CrossRef CAS.
- J. Knapik, Z. Wojnarowska, K. Grzybowska, K. Jurkiewicz, L. Tajber and M. Paluch, Mol. Pharm., 2015, 12, 3610–3619 CrossRef CAS PubMed.
- M. Romanini, M. Lorente, B. Schamme, L. Delbreilh, V. Dupray, G. Coquerel, J. L. Tamarit and R. Macovez, Macromolecules, 2018, 51, 9382–9392 CrossRef CAS.
- Z. Wojnarowska, M. Paluch, P. Wlodarczyk, L. Hawelek, R. Wrzalik, J. Ziolo, M. Wygledowska-Kania, B. Bergler-Czop, L. Brzezinska-Wcislo and P. Bujak, Phys. Rev. E, 2011, 83, 051502 CrossRef CAS PubMed.
- K. Grzybowska, S. Capaccioli and M. Paluch, Adv. Drug Deliv. Rev., 2016, 100, 158182 CrossRef PubMed.
- K. Grzybowska, K. Chmiel, J. Knapik-Kowalczuk, A. Grzybowski, K. Jurkiewicz and M. Paluch, Mol. Pharm., 2017, 14, 1154–1168 CrossRef CAS.
- K. Grzybowska, M. Paluch, A. Grzybowski, Z. Wojnarowska, L. Hawelek and K. Kolodziejczyk, J. Phys. Chem. B, 2010, 114, 12792–12801 CrossRef CAS.
- Q. Shi, C. Zhang, Y. Su, J. Zhang, D. Zhou and T. Cai, Mol. Pharm., 2017, 14, 2262–2272 CrossRef CAS PubMed.
- Q. Shi, J. Zhang, C. Zhang, J. Jiang, J. Tao, D. Zhou and T. Cai, Mol. Pharm., 2017, 14, 4694–4704 CrossRef CAS.
- M. H. Fung, M. DeVault, K. T. Kuwata and R. Suryanarayanan, Mol. Pharm., 2018, 15, 1052–1061 CrossRef CAS.
- J. Knapik-Kowalczuk, Z. Wojnarowska, M. Rams-Baron, K. Jurkiewicz, J. Cielecka-Piontek, K. L. Ngai and M. Paluch, Mol. Pharm., 2017, 14, 2670–2680 CrossRef CAS PubMed.
- Y. He, T. R. Lutz, M. D. Ediger, C. Ayyagari, D. Bedrov and G. D. Smith, Macromolecules, 2004, 37, 5032–5039 CrossRef CAS.
- J. Szczurek, M. Rams-Baron, J. Knapik-Kowalczuk, A. Antosik, J. Szafraniec, W. Jamroz, M. Dulski, R. Jachowicz and M. Paluch, Mol. Pharm., 2017, 14, 1071–1081 CrossRef CAS.
- S. Adishchev, D. Bock, C. Gainaru, R. Kahlau, B. Micko, N. Petzold, B. Pötzschner and E. A. Rössler, Z. Phys. Chem., 2012, 226, 1149–1168 CrossRef CAS.
- J. Knapik-Kowalczuk, W. Tu, K. Chmiel, M. Rams-Baron and M. Paluch, Mol. Pharm., 2018, 15, 2455–2465 CrossRef CAS PubMed.
- K. Chmiel, J. Knapik-Kowalczuka, R. Jachowicz and M. Paluch, Eur. J. Pharm. Biopharm., 2019, 136, 231–239 CrossRef CAS.
- K. Adrjanowicz, K. Kaminski, M. Dulski, P. Wlodarczyk, G. Bartkowiak, L. Popenda, S. Jurga, J. Kujawski, J. Kruk, M. K. Bernard and M. Paluch, J. Chem. Phys., 2013, 139, 111103 CrossRef CAS PubMed.
- https://pubchem.ncbi.nlm.nih.gov/compound/.
- D. Mahlin and C. A. S. Bergström, Eur. J. Pharm. Sci., 2013, 49, 323–332 CrossRef CAS PubMed.
- http://www.inchem.org/documents/icsc/icsc/eics1043.htm.
- https://www.chemicalbook.com/.
- http://www.chemspider.com/.
- B. Ruta, G. Baldi, Y. Chushkin, B. Ruffle, L. Cristofolini, A. Fontana, M. Zanatta and F. Nazzani, Nat. Commun., 2014, 5, 3939 CrossRef CAS.
- H.-B. Yu, R. Richert and K. Samwer, Sci. Adv., 2017, 3, e1701577 CrossRef PubMed.
- J.-H. Hung, T. K. Patra, V. Meenakshisundaram, J. H. Mangalara and D. S. Simmons, Soft Matter, 2019, 15, 1223–1242 RSC.
- D. Q. M. Craig, P. G. Royall, V. L. Kett and M. L. Hopton, Int. J. Pharm., 1999, 179, 179–207 CrossRef CAS PubMed.
- C. M. Wassvik, A. G. Holmén, C. A. S. Bergström, I. Zamora and P. Artursson, Eur. J. Pharm. Sci., 2006, 29, 294–305 CrossRef CAS.
- Y. Ran, N. Jain and S. H. Yalkowsky, J. Chem. Inf. Comput. Sci., 2001, 415, 1208–1217 CrossRef PubMed.
- S. Emami, A. Jouyban, H. Valizadeh and A. Shayanfar, J. Solution Chem., 2015, 44, 2297–2315 CrossRef CAS.
- J. E. K. Schawe, Thermochim. Acta, 2015, 602, 128–134 CrossRef.
- B. C. Hancock, C. R. Dalton, M. J. Pikal and S. L. Shamblin, Pharm. Res., 1998, 15, 762–767 CrossRef CAS.
- Y. Aso, S. Yoshioka and S. Kojima, J. Pharm. Sci., 2001, 90, 798–806 CrossRef CAS.
- D. Simatos, G. Blond, G. Roudaut, D. Champion, J. Perez and A. L. Faivre, J. Therm. Anal., 1996, 47, 1419–1436 CrossRef CAS.
- F. Pedregosa, G. Varoquaux, A. Gramfort, V. Michel, B. Thirion, O. Grisel, M. Blondel, P. Prettenhofer, R. Weiss, V. Dubourg, J. Vanderplas, A. Passos, D. Cournapeau, M. Brucher, M. Perrot and E. Duchesnay, J. Mach. Learn. Res., 2011, 12, 2825–2830 Search PubMed.
| This journal is © The Royal Society of Chemistry 2019 |